
People moving from Seattle or Bellevue often ask a version of the same question: is Snoqualmie as safe as it looks? The short answer is yes — and the data is not even close. With a violent crime rate of 0.07 per 1,000 residents (FBI 2024 data), Snoqualmie sits in a different statistical category from nearly every city in Washington State. But the numbers deserve context, because Washington's statewide property crime rate ranked third-highest in the nation in 2024 — and that backdrop shapes how Snoqualmie's own property crime figure reads depending on which comparison you reach for first.
The city of roughly 13,800 residents sits at the eastern edge of the Seattle metro in King County, where SR-18 and SR-202 funnel traffic between the Snoqualmie Valley and the broader eastside corridor. The economic mix here — Boeing and Microsoft employees filling Snoqualmie Ridge, hospitality workers connected to Salish Lodge & Spa and Snoqualmie Casino — creates a community with both suburban stability and a daily influx of tourists to Snoqualmie Falls. That visitor traffic is part of the local safety conversation in a way that pure residential statistics don't fully capture.
The Snoqualmie Police Department runs on a community-policing philosophy it calls 'No Call too Small,' a phrase that appears on the department's own municipal page alongside a decade-long claim of being among Washington's safest cities. In 2024, the department reinstated its School Resource Officer position, and in 2025 it completed an evidence vault remodel flagged in a Law Enforcement Management and Administrative Performance (LEMAP) study as preparation for future accreditation. These are operational details — not marketing — and they tell you something about how seriously the department takes institutional infrastructure at this size.
Whether you're researching a specific neighborhood or trying to understand how Snoqualmie compares to nearby North Bend, Fall City, or Issaquah, the sections below break down the actual crime numbers, what drives property crime here, how the police department operates, and what newcomers tend to notice about safety after a few months living in the valley.

The Numbers: How Snoqualmie's Crime Rates Stack Up
Violent Crime: The Cleanest Stat in the City
Snoqualmie's violent crime rate of 0.07 per 1,000 residents is, put plainly, extraordinary. The FBI's 2024 national average sits at 3.59 per 1,000 — making Snoqualmie's figure roughly 98% below that baseline. Washington State's 2024 violent crime rate ran between 3.26 and 3.29 per 1,000, meaning Snoqualmie tracks 97–98% below even the statewide figure.
At a city of 13,800 people, a rate of 0.07 per 1,000 translates to roughly one violent incident in the reporting window. A single event in a small city can move that number materially, which is worth keeping in mind — but year over year, the pattern holds.
Property Crime: The Number That Needs Context
Snoqualmie's property crime rate of 24.1 per 1,000 residents is where the conversation gets more nuanced — and where Washington's statewide picture becomes essential framing. The state's 2024 property crime rate was approximately 246.7 per 1,000 (ranked third-highest nationally), so Snoqualmie's figure is well below the state average. Against the national backdrop, 24.1 per 1,000 reads as moderate rather than low.
| Geography | Violent Crime (per 1,000) | Property Crime (per 1,000) | Data Year |
|---|---|---|---|
| Snoqualmie, WA | 0.07 | 24.1 | 2024 |
| Washington State | 3.26–3.29 | ~246.7 | 2024 |
| U.S. National Average | 3.59 | ~195–200 (est.) | 2024 |
| City-Data Composite Index | 73 (U.S. avg: 235.3) | 2024 | |
City-Data.com's composite crime index for Snoqualmie scored 73 against a U.S. average of 235.3 — placing it safer than roughly 62% of American cities on that weighted measure. That index blends both violent and property crime, so Snoqualmie's near-zero violent rate pulls the composite down significantly.
Washington's overall crime rates moved in a favorable direction in 2024: property crimes fell 13.4% and violent crimes dropped 7.6% year-over-year, per the Washington Association of Sheriffs and Police Chiefs (WASPC) 2024 Crime in Washington annual report. Snoqualmie's already-low numbers sit against that improving statewide backdrop.
What Drives Property Crime in Snoqualmie
Tourism Traffic and Opportunistic Theft
Snoqualmie Falls draws hundreds of thousands of visitors per year. That daily influx — cars parked in the Salish Lodge & Spa lot, along the Falls overlook, and at the Northwest Railway Museum — creates a consistent opportunity window for vehicle break-ins and theft from unlocked cars. Residents near the Falls area, particularly along Railroad Ave SE and the immediate downtown district, see this play out more directly than families up on Snoqualmie Ridge.
Vehicle prowls — windows smashed, bags grabbed from back seats — are the most common property crime complaint locals will mention. Leaving anything visible in a parked car near the Falls or the casino corridor is the kind of habit that gets corrected quickly after one incident.
The Casino Corridor Effect
Snoqualmie Casino sits on SR-202 outside the main city grid, and the surrounding area generates its own low-level property crime pattern. The casino draws a high volume of transient traffic, and parking lots at that scale attract opportunists. This is not a problem concentrated in residential neighborhoods — it's corridor-specific and well understood by longtime residents.
Snoqualmie Ridge vs. Downtown: A Safety Geography
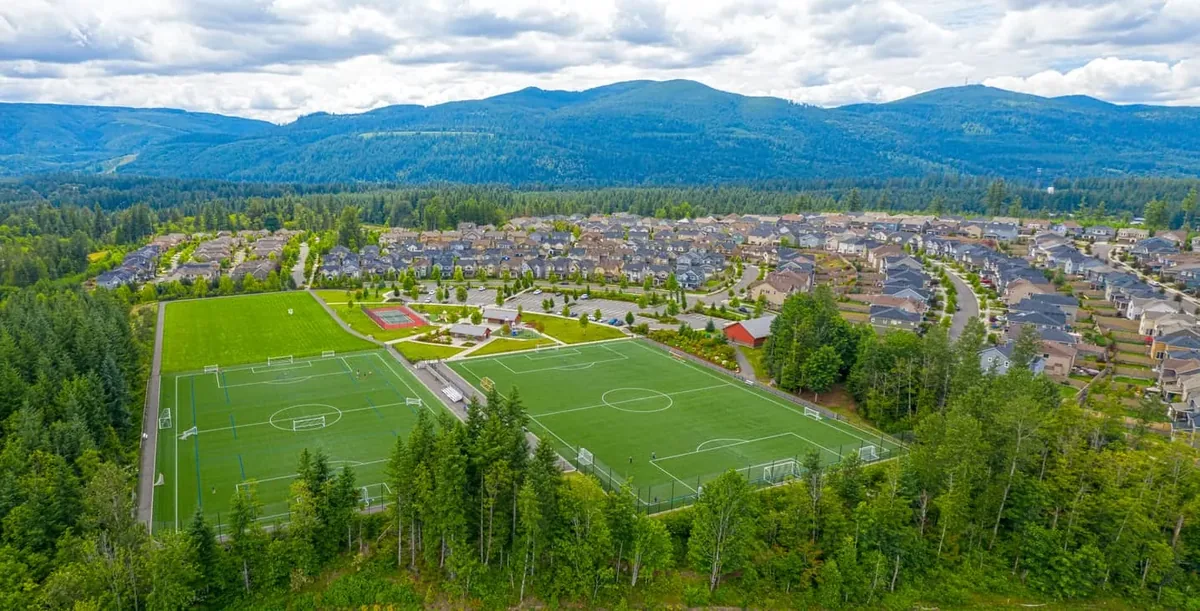
The neighborhoods that make up most of Snoqualmie's residential footprint — Snoqualmie Ridge, The Reserve at Snoqualmie Ridge, Silver Fir, Eagle Pointe, and Deer Park — are planned, master-developed communities with cul-de-sacs, good sightlines, and a strong neighborhood-watch culture. The neighborhood character breakdown covers these areas in more detail, but from a safety standpoint, residents consistently describe these as among the quieter streets in the valley.
Downtown Snoqualmie's Historic District and the Riverbend and Jacobia areas closer to the valley floor are more mixed — older housing stock, proximity to the tourist corridor, and more foot traffic after dark near Falls Ave SE. That doesn't translate to danger, but it does mean a different ambient environment than the Ridge.
How the Snoqualmie Police Department Operates
Small Department, Clear Philosophy
The Snoqualmie Police Department is a small municipal force serving roughly 13,800 residents. Washington ranked last in the nation in 2024 for police officers per capita — 1.38 officers per 1,000 residents against a national average of 2.31 — so Snoqualmie operates within a statewide context of lean department staffing. The department's stated response to that reality is community-level engagement rather than density.
The 'No Call too Small' motto isn't just a tagline. Longtime residents describe calling about minor issues — a suspicious car, a noise concern — and getting a response the same shift. That responsiveness is partly a function of call volume: Snoqualmie isn't fielding the case load of Bellevue or Issaquah.
Institutional Investment
In 2025, the department completed a comprehensive remodel of its evidence vault — a step flagged in a 2024 LEMAP (Law Enforcement Management and Administrative Performance) study as necessary groundwork for future accreditation. That kind of institutional infrastructure work doesn't make headlines, but it signals a department operating with long-term professional standards in mind.
The School Resource Officer position was fully reinstated in 2024 after a period of absence — an officer now embedded in the local school community rather than simply responding to calls after the fact. For parents considering Snoqualmie, that's a tangible operational change worth knowing about.
Community-Engagement Programs
In summer 2026, the department relaunched its Safe Rider Citation Program — a partnership with North Bend Police, Snoqualmie Fire, and Eastside Fire & Rescue that rewards kids spotted wearing helmets while biking or scootering with a free ice cream. It reads as lighthearted, but the underlying point is real: this is a department that invests in being recognizable to kids before anything goes wrong. That community-trust dynamic tends to correlate with better crime reporting and faster information flow when something does happen.
Looking to buy in Snoqualmie? Estimate your payment.
Enter your numbers to see an estimated monthly mortgage payment.
Estimate only. Excludes HOA fees and mortgage insurance. The interest rate above is a starting point, not a quoted rate — replace it with your own to see real numbers. Insurance is a flat placeholder, not a Snoqualmie quote.
Neighborhood Safety Snapshot
Reading the Table Honestly
Snoqualmie's eight canonical neighborhoods vary in character more than in raw crime exposure — the city-wide rates are low enough that neighborhood-level violent crime differences are statistically thin. What differs is the type and likelihood of opportunistic property incidents, proximity to tourist corridors, and the general ambient feel of a street at 10pm.
| Neighborhood | Character | Primary Safety Note | Best For |
|---|---|---|---|
| Snoqualmie Ridge | Master-planned, elevated, newer | Lowest exposure to tourist corridor; cul-de-sac layout limits through-traffic | Families Quiet |
| The Reserve at Snoqualmie Ridge | Upscale enclave within the Ridge | Gated-feel without formal gates; strong neighborhood awareness | Luxury Privacy |
| Silver Fir | Established Ridge-adjacent | Residential streets; minimal cut-through traffic | Families |
| Eagle Pointe | Newer construction, hillside | Low foot traffic; limited access points reduce opportunistic entry | Views Quiet |
| Deer Park | Smaller community, valley edge | Quiet residential; modest tourist exposure | Families Value |
| Downtown Historic District | Mixed-use, walkable, older | Highest pedestrian activity; vehicle prowl risk near Falls parking | Walkable |
| Riverbend | Valley floor, older stock | More transit-adjacent; modest ambient activity after dark | First-Time |
| Jacobia | Quiet, semi-rural feel | Low-traffic streets; away from casino and Falls corridors | Nature Privacy |
The table above reflects character and context — not a ranking of dangerous versus safe, because that distinction would be overstated at Snoqualmie's overall crime level. If you're researching specific areas before deciding on a neighborhood, the Snoqualmie Police Department's online reporting portal shows incident-level data that's more granular than city-wide averages.
What Newcomers Actually Notice After Six Months
The Surprise: It's Quieter Than the Numbers Suggest
People who move here from Seattle, Bellevue, or Issaquah often describe a specific adjustment: you stop locking your car in the driveway. Not because you've read the crime stats — because nothing happens, and after a while the habit fades. That behavioral shift is its own data point about how residents experience day-to-day safety on the Ridge.
The more honest version of this observation is that Snoqualmie's safety is largely residential. The calm that defines life in Silver Fir or Eagle Pointe does not automatically extend to leaving valuables in a car near Snoqualmie Falls on a Saturday in July, when the parking areas are packed with out-of-town visitors.
Why Some Residents Still Feel Uneasy
A small but real friction point: Washington's status as a high-property-crime state bleeds into the local conversation even when local numbers don't warrant alarm. Residents who follow regional news — stories about retail theft in Auburn or Renton — sometimes apply that anxiety to Snoqualmie by association. The data doesn't support that transfer, but the feeling persists, especially for people who moved from lower-crime states and expected Washington to feel uniformly safe.
The tourist season amplifies this. Memorial Day through Labor Day brings significantly more foot traffic through the Falls and casino corridors, and locals who live near those areas tend to be more attentive about securing vehicles during that window. It's a seasonal habit, not a permanent elevated-threat posture.
After Dark on Falls Ave SE
Downtown Snoqualmie at night is not a concern by any objective measure — but it is different from the Ridge neighborhoods after dark. An Irish pub and a tequila bar along Center Blvd SE and Falls Ave SE draw a Friday-night crowd, and the stretch along Railroad Ave SE has genuine foot traffic on weekends. For residents used to the quiet of the Ridge, that's an adjustment in feel more than a safety issue. For others, it's exactly the kind of lived-in energy a small-town downtown should have.
The honest bottom line: Snoqualmie's safety record is genuinely strong, anchored by an engaged police department and residential neighborhoods with low through-traffic and high neighbor familiarity. The one place to stay attentive is vehicle security near high-visitor destinations — a practical habit, not a fear response.
Local Expert Takeaway: Snoqualmie's violent crime rate of 0.07 per 1,000 is not a rounded figure or a marketing claim — it's the FBI's 2024 count for a city of nearly 14,000 people. The property crime rate of 24.1 per 1,000 deserves honest framing: it looks moderate against the national average but sits well below Washington State's own figure, in a state that ranked third-highest nationally for property crime in 2024. The practical safety advice here is less about neighborhoods and more about tourist corridors — don't leave anything visible in a car near Snoqualmie Falls or the casino on a busy weekend, and the rest of day-to-day life on the Ridge or in Jacobia runs without incident. The Snoqualmie Police Department is small, community-embedded, and operationally serious about accreditation-level standards. That combination — genuine institutional investment, low call volume, and a valley geography that keeps residential streets quiet — is what makes the statistics feel real to people who actually live here.
Quick Takeaways & FAQs
✅ Snoqualmie's violent crime rate of 0.07 per 1,000 residents is approximately 98% below the U.S. national average, making it one of the statistically safest cities in Washington State.
⚠️ Property crime at 24.1 per 1,000 is the real number to watch — driven largely by vehicle prowls near the Snoqualmie Falls tourist corridor, not residential neighborhoods.
📍 The Snoqualmie Police Department relaunched its Safe Rider Citation Program in summer 2026 with North Bend Police and local fire agencies — rewarding kids wearing bike helmets with free ice cream, reflecting a community-first policing approach that residents consistently notice.
What is Snoqualmie's violent crime rate compared to the rest of Washington?
Is Snoqualmie's property crime rate a concern?
Which neighborhoods in Snoqualmie are considered the safest?
How does the Snoqualmie Police Department compare to other cities of this size?
How does Snoqualmie's safety compare to nearby cities like Issaquah or North Bend?
Moving to Washington?
Tell us what you need help with and we'll connect you with local resources.
