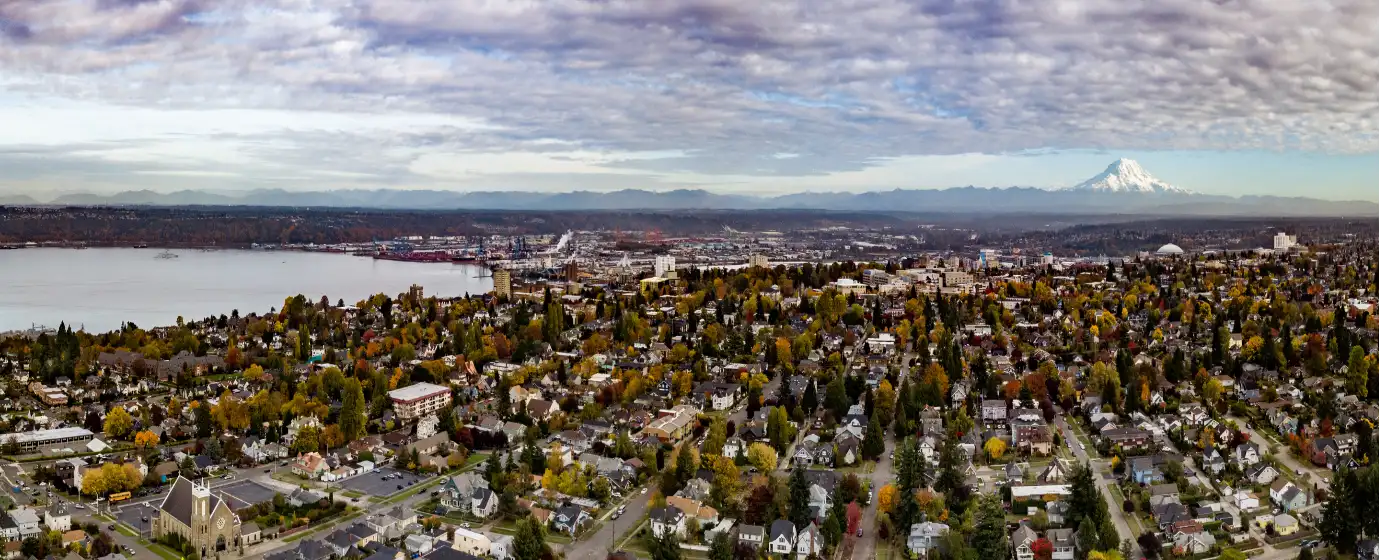
If you've been researching Tacoma and crime keeps coming up, you're not imagining things — and you're not being unfair to the city by asking. Tacoma's violent crime rate of 10.6 per 1,000 residents and property crime rate of 56 per 1,000 (2024 FBI Uniform Crime Report data) are genuinely above state and national averages, and the city itself made public safety the centerpiece of its 2025 mayoral race. But those citywide numbers flatten a story that is far more geographically specific than a single rate suggests. Northeast Tacoma and North End read like entirely different cities from Hilltop or parts of South Tacoma — same city, same headline statistic, dramatically different daily experience.
Here is what most crime write-ups miss: the 2024 data also shows that total reported crime in Tacoma fell roughly 23% between 2023 and 2024, with property crime down nearly 25% and violent crime down approximately 14.5% over the same period. That is not a rounding error — it is the largest single-year crime drop the city has recorded in recent memory, driven in part by a targeted Violent Crime Reduction Plan that produced a 36% reduction in violent incidents in the specific corridors where it was deployed. The trend line matters as much as the snapshot. The question isn't just whether Tacoma is safe — it's which parts are getting safer fastest, and which still carry real risk.
For regional context: Tacoma's numbers run higher than neighboring Puyallup and University Place, two cities that frequently come up in the same home search. But Seattle's citywide figures in several crime categories actually approach or exceed Tacoma's — a fact that surprises most people moving down from King County. The South Puget Sound corridor is not a simple safety gradient where everything north of Tacoma is safer. What Tacoma has is concentration: the worst of its crime is not spread evenly but stacked into specific corridors, which means where you land in the city matters enormously.
This guide breaks down Tacoma's crime data by neighborhood, puts the numbers in regional context, explains what the citywide figures actually mean at street level, and gives you the practical framework to evaluate any specific area before you decide where to put down roots.

Tacoma Crime Rates: What the 2024 Numbers Actually Say
The Raw Numbers
In 2024, Tacoma recorded 2,381 violent crimes and 12,551 property crimes, according to FBI Uniform Crime Report data. That works out to a violent crime rate of 10.6 per 1,000 residents and a property crime rate of 56 per 1,000 — both significantly above Washington state and national benchmarks.
To put those in perspective: the U.S. national violent crime rate was 359 per 100,000 in 2024, and Washington state's was 326 per 100,000. Tacoma's violent crime rate runs roughly three times the state average. The property crime comparison is somewhat less stark but still elevated — approximately 2.3 times the Washington state rate.
| Crime Category | Tacoma (2024) | WA State Avg | U.S. National Avg |
|---|---|---|---|
| Violent Crime Rate (per 100K) | 1,063 | 326 | 359 |
| Property Crime Rate (per 100K) | 5,604 | 2,467 | 1,760 |
| Aggravated Assault (incidents) | 1,794 | — | — |
| Robbery (incidents) | 413 | — | — |
| Rape (incidents) | 152 | — | — |
| Murder (incidents) | 22 | — | — |
| Larceny-Theft (incidents) | 7,887 | — | — |
* Sources: FBI UCR 2024, via plaincrime.com (released October 2025); USAFacts, citing FBI UCR 2024 (June 2026). State and national averages are per 100,000; Tacoma figures converted from per-1,000 city fact sheet for consistency.
The Category That Stands Out Most
Motor vehicle theft is Tacoma's most disproportionate crime category relative to national benchmarks — running at approximately four times the national average. If you move here and park on the street, this is the practical risk most residents actually encounter. Larceny-theft (everything from package theft to shoplifting) accounts for 52.8% of all reported Part I offenses, making it by far the most common category of crime in the city.
Within violent crime, aggravated assault is the dominant category at 1,794 incidents — nearly four times the robbery figure. This matters for how you read safety: the elevated violent crime rate is driven primarily by assault, not by stranger-danger robbery scenarios in most neighborhoods.
The Trend That Changes the Story
Total reported crime fell roughly 23% between 2023 and 2024. Property crime dropped nearly 25%; violent crime declined approximately 14.5%. Those are meaningful, verifiable reductions — not statistical noise. Tacoma's citywide crime rate is high by absolute measure, but the direction of travel in 2024 was sharply downward, and that trajectory shapes what the numbers mean for someone deciding where to live right now.
Neighborhood-by-Neighborhood Safety Breakdown
The single most important thing to understand about Tacoma crime is that the citywide rate is not your neighborhood rate. Northeast Tacoma logs around 681 total incidents per year; southern parts of the city log roughly 3,578. That gap is not incremental — it is the difference between a quiet residential street and a genuinely elevated-risk corridor. For a full character profile of each area, see the Tacoma neighborhoods guide; what follows here is the safety picture specifically.
| Neighborhood | Safety Profile | Violent Crime vs. City Avg | Best For |
|---|---|---|---|
| Northeast Tacoma | Consistently among the safest in the city; ~681 total incidents/year | ~76% lower | Families Quiet |
| North End / Proctor | Crime rate ~83% lower than citywide average; most sought-after residential area | Significantly lower | Walkable Families |
| West End | Safer than city average; conditions vary by pocket | ~40% lower | Families Value |
| Stadium District / Old Town | Property crime present (broad citywide pattern); violent crime lower than average | Below city avg | Walkable Commuter |
| Central Tacoma | Moderately elevated; wide block-to-block variation | Near or above city avg | Renters |
| South Tacoma | Elevated; roughly 3,578 total incidents/year in southern zones | ~23% above | Value |
| Hilltop | Primary violent-crime hotspot corridor; central Tacoma stretches also flagged | Significantly above | — |
The Neighborhoods Worth Moving To
Northeast Tacoma's violent crime rate — roughly 76% below the citywide figure — puts it in a genuinely different safety category than the rest of the city. It sits tucked along the city's eastern edge, bordered by Fife and largely insulated from the corridors that drive Tacoma's headline numbers.
North End and Proctor are what most people picture when someone says "the good part of Tacoma." The crime rate there is cited at approximately 83% lower than the citywide average. The tradeoff is that everyone who researches Tacoma safety figures this out, which pushes demand — and prices — in that direction.
West End sits closer to Point Defiance Park and carries a violent crime rate roughly 40% below the city average. Conditions aren't uniform across the whole area, so street-level research still matters, but as a broad zone it falls clearly on the safer side of Tacoma's geographic divide.
The Corridors That Drive the Citywide Rate
Hilltop is the neighborhood most cited in Tacoma crime data, and the data supports that reputation. Stretches of Central Tacoma also carry a disproportionate share of the city's violent incidents. South Tacoma's violent crime rate runs approximately 23% above the already-elevated citywide average.
Central Tacoma is the most nuanced case: block-to-block variation is wide enough that two streets a quarter-mile apart can feel meaningfully different. If you're looking at anything in Central Tacoma, street-level research — walking the block at different times, checking incident maps — matters more than the neighborhood average alone.

Property Crime: The Everyday Risk Most Residents Actually Face
Tacoma's property crime rate of 56 per 1,000 residents is the number that affects the most people day-to-day, and it behaves differently from the violent crime map. While violent crime clusters heavily in Hilltop and specific south and central corridors, property crime is distributed broadly across the city — including in North End, Stadium District, and Old Town.
What That Means Practically
Even in Tacoma's safer neighborhoods, you are living in a city with an elevated property crime rate. Larceny-theft — packages off porches, items from unlocked vehicles, retail theft — accounts for more than half of all reported offenses. Motor vehicle theft runs at roughly four times the national average, which is the single most concrete risk for someone relocating here.
The practical response most long-term Tacoma residents adopt isn't avoidance — it's habit. Locking vehicles consistently, not leaving anything visible in a parked car, and using a garage when available reduces your actual exposure considerably. These are not extraordinary precautions for a Pacific Northwest city; they are standard practice in Seattle and Portland as well.
Downtown and the Waterfront Corridor
The 2024 Tacoma Community Survey found that only 24% of residents feel safe in downtown Tacoma specifically — a number that stands in sharp contrast to the 64% who feel safe in their own neighborhoods during the day. Downtown's safety perception tracks with reality: it carries elevated property crime and visibility of social disorder, and the Ruston Way waterfront corridor, while a genuinely attractive destination, sits adjacent to areas that require situational awareness after dark.
This does not mean downtown is off-limits. Thousands of people work and eat there without incident daily. It means that the Stadium District and Old Town, which sit closer to the waterfront and carry somewhat different character than the core downtown blocks, are worth distinguishing from the broader downtown umbrella when you're evaluating where to spend time.
Looking to buy in Tacoma? Estimate your payment.
Enter your numbers to see an estimated monthly mortgage payment.
Estimate only. Excludes HOA fees and mortgage insurance. The interest rate above is a starting point, not a quoted rate — replace it with your own to see real numbers. Insurance is a flat placeholder, not a Tacoma quote.
What's Actually Changing: Tacoma's Crime Reduction Efforts
The 23% single-year drop in total crime between 2023 and 2024 isn't the result of a statistical anomaly. Tacoma deployed a Violent Crime Reduction Plan developed in partnership with researchers from the University of Texas San Antonio, using targeted hot-spot policing concentrated in the corridors that generate the most incidents.
What the Data Shows
In the areas where the hot-spot strategy was applied during the second half of 2024, violent crime incidents fell 36%. Drive-by shootings dropped roughly 32% and business robberies declined nearly 47% year-over-year in those zones. Those are not citywide averages — they are the results in the specific places the strategy targeted.
The implication for someone researching Tacoma now is that the worst-performing corridors in 2022 and 2023 are not static. Hilltop and the surrounding high-incident areas are where targeted intervention was most concentrated — which means the gap between those neighborhoods' historical reputation and their current reality may be narrowing, even if the numbers still show elevated risk relative to the city average.
What Hasn't Changed
Tacoma and neighboring Ruston carry the highest violent crime rates in Washington state by the most recent FBI data — a fact that drove public safety to the center of the 2025 mayoral race. Political attention does not automatically translate to sustained improvement, and one year of strong results needs to be confirmed by the 2025 UCR data before it represents a durable trend.
Motor vehicle theft, the category most elevated relative to national benchmarks, showed improvement in the 2024 figures but remains a structural issue across the South Puget Sound region, not just Tacoma. The shift to catalytic converter thefts in particular tracks regional patterns shared by Tacoma, Seattle, and their surrounding cities.
The Community Dimension
Despite the crime figures, 52% of respondents to the 2024 Tacoma Community Survey report a strong sense of community — a number that surprises people who have only seen Tacoma's crime headlines. Neighborhoods like North End around the Proctor District, and Northeast Tacoma near the waterfront, have active neighborhood associations that residents describe as genuinely engaged rather than performatively active. North End's main commercial stretch along Proctor Street is the kind of anchor corridor that draws neighbors together on weekday evenings — the type of local institution that exists in a neighborhood people have chosen to invest in, not flee.
How to Research Safety Before You Choose a Neighborhood
Start with the Geographic Reality
The most common mistake relocating buyers make in Tacoma is treating the city as a monolith. Someone sees the 10.6 violent crime rate and either rules the city out entirely or dismisses safety concerns because they're planning to live in North End. Both reactions miss the point. The city's safety profile is highly segmented by geography, and the relevant question is always which specific neighborhood — and which specific streets within it — you're considering.
The north-south and east-west divides within Tacoma are real and consequential. North of downtown along Proctor Street and through Northeast Tacoma, the experience is measurably different from South Tacoma along Pacific Avenue or the Hilltop corridor west of I-5. Understanding that divide is the starting point for any honest evaluation.
Tools That Actually Help
CrimeGrade.org and local incident map data from the Tacoma Police Department's public portal let you pull street-level incident data for any specific address. These are more useful than neighborhood averages for evaluating a specific block. Check the data over multiple time windows — a single month can be misleading; a rolling 12-month view shows patterns that matter.
Walk the neighborhood at different times. Tacoma's appearance shifts considerably between a Saturday afternoon and a Tuesday evening, and between 6 p.m. and 10 p.m. in some areas. The blocks immediately adjacent to elevated-risk corridors can feel quite different from the corridor itself — that's the block-to-block variation that matters most in Central Tacoma and the edges of the Stadium District.
What Surprises People After Six Months
The thing most newcomers don't expect is how localized Tacoma's rough patches actually are. People who move to North End or Northeast Tacoma and then read the city's crime headlines are often genuinely confused — their daily experience doesn't match the citywide number. People who move to South Tacoma having researched only the citywide figure, without drilling down to neighborhood-level data, sometimes find the gap between expectation and reality runs the other direction.
The second surprise is vehicle security. Even in the safer quadrants, motor vehicle theft running at roughly four times the national average means leaving a backpack or laptop bag visible on a car seat is a real mistake — not a theoretical one. Residents who adopt a clean-car habit within the first few weeks tend to have a very different experience than those who don't.
Regional Comparison: Putting It in Perspective
If you are coming from Puyallup or University Place, Tacoma's citywide crime rates are noticeably higher. If you are coming from Seattle, the comparison is more complicated — Seattle's figures in several crime categories approach or exceed Tacoma's, particularly for property crime. Moving to North End from a lower-crime Seattle neighborhood may actually mean moving to a comparably safe environment on a block-by-block basis, even though the citywide numbers tell a different story.
The honest framing: Tacoma is not a city where safety is irrelevant to your neighborhood decision. It is a city where the right neighborhood decision — driven by actual data, not the citywide headline — can land you somewhere with a safety profile that compares favorably to much of the Pacific Northwest.

Local Expert Takeaway: Tacoma's citywide crime numbers are real and worth taking seriously — but they are not your neighborhood's numbers. Northeast Tacoma and North End around Proctor Street consistently show crime rates 75-83% below the city average, which puts them in a genuinely different category from Hilltop or South Tacoma's elevated corridors. The 2024 data also showed the sharpest single-year crime reduction in recent memory, driven by targeted hot-spot policing in the corridors that needed it most. If you're evaluating Tacoma, pull street-level incident data for the specific blocks you're considering — not just the neighborhood label — and check motor vehicle theft patterns specifically, because that's the category that catches even North End residents off guard.
Quick Takeaways & FAQs
✅ Tacoma recorded a roughly 23% drop in total crime between 2023 and 2024 — the largest single-year reduction in recent memory, driven by targeted hot-spot policing in the city's highest-risk corridors.
⚠️ Tacoma's violent crime rate runs approximately three times the Washington state average and its property crime rate about 2.3 times the state average — numbers that are real, not inflated, and that make neighborhood selection genuinely consequential.
📍 Motor vehicle theft runs at roughly four times the national average even in safer neighborhoods like North End — a clean-car habit (nothing visible, always locked) is standard practice for long-term Tacoma residents across the city.
Is Tacoma safe to live in?
What are the safest neighborhoods in Tacoma?
Which Tacoma neighborhoods have the highest crime?
How does Tacoma's crime rate compare to Seattle?
Is Tacoma's crime rate getting better or worse?
Moving to Washington?
Tell us what you need help with and we'll connect you with local resources.
