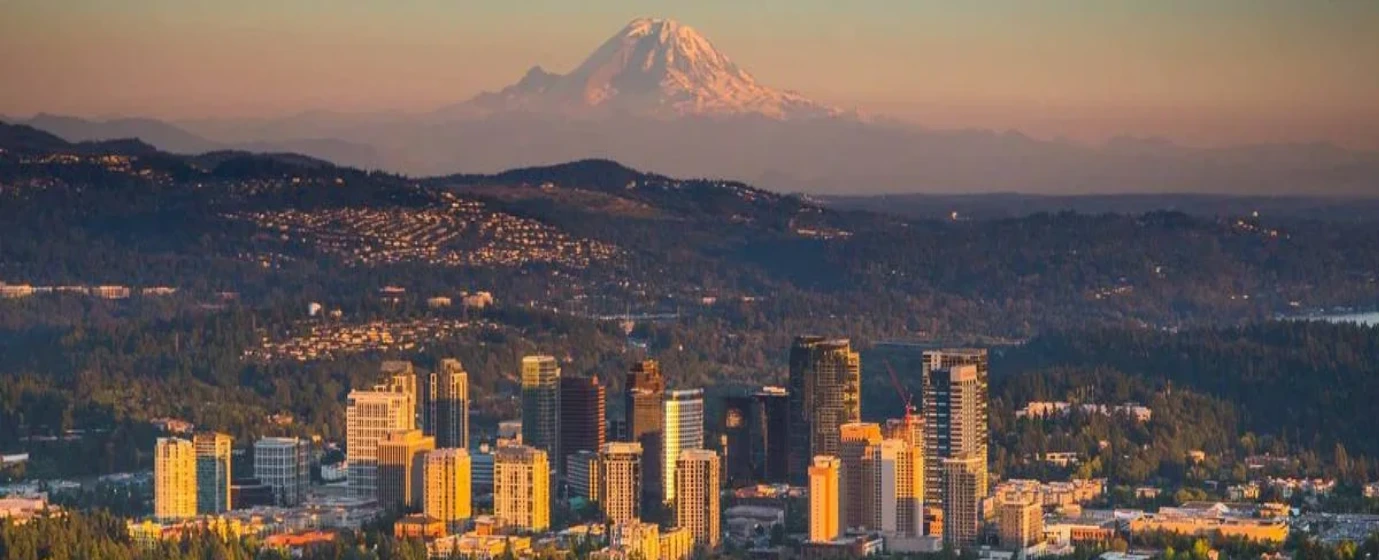
Maybe you've looked at Bellevue's crime statistics and noticed a number that surprised you: a property crime rate of 34 per 1,000 residents. For a city with this income level, that figure can stop a relocating family cold. But that single number conceals the most important thing to understand about safety in Bellevue — where that crime actually happens. The city's commercial corridors, particularly around Downtown Bellevue and The Bellevue Collection on Bellevue Square, generate a disproportionate share of theft and motor vehicle theft. Step into the residential neighborhoods east and south of the core, and you're looking at a fundamentally different risk picture.
Bellevue sits on the eastern shore of Lake Washington, directly across from Seattle via I-90 and SR-520, and that proximity shapes everything — including how crime data gets read. The city's violent crime rate of approximately 1 per 1,000 residents is not just low for a city of 154,000; it sits dramatically below Washington State's own rate of roughly 3.26 per 1,000, and well below the national figure of 3.59 per 1,000 (federal crime reporting data, 2024). That reflects something real about who lives here and what the police department prioritizes.
The trajectory matters as much as the snapshot. Bellevue Police reported 5,698 total crimes in 2025, down from 7,828 in 2024 — a 27% single-year drop that the department attributes in part to a targeted strategy called P.I.E. (Prevention, Intervention, Enforcement), which focuses resources on identified crime hotspots. Property crimes specifically fell from 6,546 to 4,412 in that same period. Context also matters: Washington State ranked among the worst in the nation for property crime and motor vehicle theft in 2024, meaning Bellevue's elevated property crime rate partly reflects state-level patterns rather than something unique to this city.
Whether you're considering a move to Somerset, Crossroads, or somewhere along the west side near Meydenbauer Bay, the sections below break down Bellevue's crime statistics by neighborhood, put the numbers in state and national context, and give you the practical framework for evaluating safety before you decide on an area.
Bellevue's Crime Numbers in Context
The Violent Crime Picture
Bellevue's violent crime rate of approximately 1 per 1,000 residents is, simply put, one of the lowest you will find in any American city above 100,000 people. NeighborhoodScout characterizes it as 'about average for all communities in America, across all population sizes' — but that framing undersells what the number means for a city this size, where rates of 3–5 per 1,000 are common. The national violent crime rate stood at 3.59 per 1,000 in 2024; Bellevue's rate is roughly a quarter of that.
Washington State itself isn't a low-crime state. The state's violent crime rate runs approximately 3.26–3.29 per 1,000 — meaning Bellevue clocks in at less than a third of the state average. For residents moving from within Washington, particularly from west of Lake Washington, this gap is material.
The Property Crime Caveat
Property crime is where Bellevue's numbers diverge from its reputation. At 34 per 1,000, the city's property crime rate sits above the national baseline of approximately 17.6 per 1,000 (1,760 per 100,000). That's a genuine gap — not something to explain away.
What the city-level figure doesn't tell you is that this rate is driven heavily by theft and motor vehicle theft concentrated in high-foot-traffic commercial zones, not in quiet cul-de-sacs in Somerset or on the tree-lined streets of Newport Hills. A city's property crime rate is calculated against its residential population, but commercial corridors attract visitors, shoppers, and commuters who don't live there. Bellevue's downtown draws foot traffic from across the eastside and from Seattle — and commercial-district theft inflates the city-wide number.
| Geography | Violent Crime (per 1,000) | Property Crime (per 1,000) | Source / Year |
|---|---|---|---|
| Bellevue, WA | ~1.0 | ~34 | NeighborhoodScout, 2024 federal crime data |
| Washington State | ~3.26–3.29 | ~high (3rd worst U.S.) | 2024 federal crime data via USAFacts |
| United States (national avg) | ~3.59 | ~17.6 | 2024 federal crime data via USAFacts |
| Seattle, WA (comparative) | ~60% higher than Bellevue | ~40% higher than Bellevue | 2024–2025 comparative analysis |
| Bellevue 2024 total crimes | 7,828 total (all categories) | Bellevue Police / MaggiesUnRE, May 2026 | |
| Bellevue 2025 total crimes | 5,698 total — down 27% year-over-year | Bellevue Police / MaggiesUnRE, May 2026 | |
* Property crime figures for Washington State reflect the state ranking (3rd worst nationally for property crime and motor vehicle theft in 2024) rather than a precise per-1,000 rate, which varies by source and reporting year.
The year-over-year trend lines are moving in the right direction. Violent crimes fell 8% and property crimes dropped 3% in the most recent federal crime reporting period, and the 2025 police data showed an even steeper decline across both categories.
Neighborhood-by-Neighborhood Safety Breakdown
The city-wide average is a starting point, not an answer. Where you actually land on Bellevue's safety spectrum depends almost entirely on which neighborhood you choose. Here's what the data shows — and what it doesn't show on a map.
| Neighborhood | Safety Profile | Key Risk / Character | Best For |
|---|---|---|---|
| Somerset | A+ safety grade (2026); violent crime ~45 per 100,000; property crime ~771 per 100,000 | Consistently among the lowest crime rates in the city; elevated, residential, limited through-traffic | Families Quiet |
| West Bellevue / Meydenbauer | Among the strongest residential safety grades citywide | Low density, proximity to Meydenbauer Bay Park; residential character keeps commercial theft pressure minimal | Luxury Views |
| Newport Hills | Consistently grades B+ or higher in neighborhood-level analysis | Quiet hillside neighborhood; insulated from downtown commercial corridors | Families Quiet |
| Bridle Trails | C+ overall (CrimeGrade.org 2025); 54th percentile — safer than 54% of U.S. neighborhoods; total crime ~34.64 per 1,000 | Sits near SR-520 interchange; marginally higher risk than the southeast quadrant but still above national midpoint | Nature Commuter |
| Eastgate | Grades B or higher; residential zones well-separated from I-90 commercial activity | I-90 interchange proximity introduces some commercial-corridor spillover; residential pockets are calmer | Commuter Value |
| Crossroads | Mixed; more diverse commercial activity than the southeast quadrant | Higher pedestrian and retail density than Somerset or Newport Hills; watch property crime near the Crossroads shopping center | Walkable Renter |
| Factoria | Commercial-residential hybrid; grades vary by block | Retail-heavy; property crime more concentrated near big-box corridors; adjacent residential streets are calmer | Commuter Transit |
| Downtown Bellevue | Highest property crime risk in the city; 1-in-13 annual property victimization risk (2024 federal crime data) | Commercial density and foot traffic drive the numbers; violent crime remains low even here | Walkable Transit |
Approximately 93% of Bellevue neighborhoods grade B or higher for safety in 2026 crime-map analysis, and roughly 80% grade A — a distribution that makes Bellevue a genuine outlier among Washington cities of comparable size.
The Downtown Reality
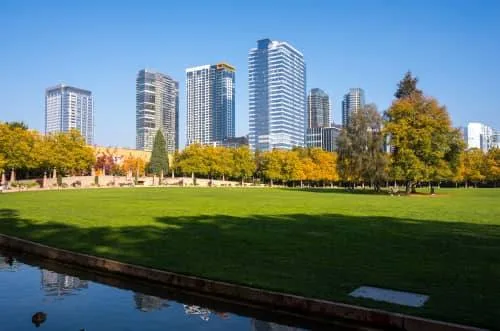
Downtown Bellevue's 1-in-13 property victimization figure sounds alarming, but it reflects the same commercial-density math you'd see in the retail core of any major city. The risk is real — particularly for car break-ins near The Bellevue Collection and the transit centers — but the violence rate even downtown remains low. If you're evaluating a condo near Bellevue Downtown Park or along NE 4th Street, the right questions are about parking security and package theft, not personal safety after dark.
For a fuller picture of how these neighborhoods differ in character and what that means day-to-day, see the best neighborhoods in Bellevue guide.

What's Driving Property Crime — and Why It's Not What You Think
The Commercial-Corridor Effect
Bellevue's property crime rate of 34 per 1,000 is calculated against a residential population of about 154,000 people — but the theft and motor vehicle theft that inflate that figure happen disproportionately in commercial zones that serve a much larger daily population. The Bellevue Collection alone draws millions of visitors annually. Park-and-ride lots near transit hubs, surface parking near Crossroads, and the retail corridors along Bellevue Way NE are where car break-ins concentrate.
This isn't a defense of the number — property crime is a real cost, especially if you park outdoors. But it does mean a household in Somerset or Newport Hills experiences a meaningfully different risk environment than the city-wide figure implies.
The State-Level Context
Washington ranked 3rd worst in the nation for property crime and 3rd worst for motor vehicle theft in 2024. Any city sitting inside this state absorbs some of that pressure — Bellevue is not immune. What's notable is that despite this state-level headwind, Bellevue's property crime rate runs substantially below Seattle's and has trended downward.
The P.I.E. Strategy and 2025 Results
The Bellevue Police Department's Prevention, Intervention, Enforcement approach targets identified crime hotspots with concentrated resources rather than spreading patrol capacity evenly across the city. The 2025 data — total crimes down 27%, property crimes down from 6,546 to 4,412 — suggests the strategy is producing measurable results. That's the largest single-year crime reduction on record for the city, per department data cited in May 2026 reporting.
One honest caveat: the 2025 figures come from a real-estate blog citing BPD data rather than a direct departmental release. The trend direction aligns with the federal crime reporting year-over-year data (violent crimes down 8%, property crimes down 3% in the 2024 reporting cycle), lending credibility — but verify current figures at bellevuewa.gov/police before treating 2025 numbers as settled.
Looking to buy in Bellevue? Estimate your payment.
Enter your numbers to see an estimated monthly mortgage payment.
Estimate only. Excludes HOA fees and mortgage insurance. The interest rate above is a starting point, not a quoted rate — replace it with your own to see real numbers. Insurance is a flat placeholder, not a Bellevue quote.
What Newcomers Don't Expect — Honest Safety Friction Points
Car Break-Ins Near Transit Centers
The thing that surprises people after six months in Bellevue isn't violent crime — it's how routine car break-ins feel near the transit hubs and park-and-ride lots. If your commute involves leaving a car in a surface lot near the SR-520 or I-90 corridors, don't leave anything visible. This is the property crime number made concrete and personal, and it catches eastside newcomers off guard because the rest of daily life feels so orderly.
Bridle Trails: Expectations vs. Reality
Bridle Trails has an almost pastoral reputation — horse trails, wooded lots, the state park. People moving from outside Washington often assume a neighborhood with that character grades out near Somerset on the safety scale. It doesn't: CrimeGrade.org rates it C+ for 2025, in the 54th safety percentile, with a total crime rate of approximately 34.64 per 1,000 that mirrors the city average rather than beating it. The SR-520 interchange proximity and commercial activity along 116th Avenue NE keep the numbers from falling into the A-grade tier. It's still a safe neighborhood by most measures — safer than nearly half the country — but the gap between its physical character and its crime grade is real.
Why Some Families Move Out
The honest reason some families leave Bellevue after a few years has almost nothing to do with crime — safety is rarely the stated concern. The friction is usually cost: the combination of home prices and the general expense of maintaining a household here eventually drives some residents to Issaquah or Sammamish, where they find comparable safety grades at a lower price point. If you're doing your research and safety is the primary question, Bellevue answers it well. The harder question is whether the safety premium is worth it compared to neighboring cities with similarly strong profiles.
The Seasonal Retail Surge
Every November and December, property crime ticks upward in the Downtown and Crossroads corridors as holiday retail traffic surges. It's a predictable seasonal pattern — more cars, more packages, more opportunity. Residents who know this simply adjust: covered parking over surface lots, packages held at lockers rather than left on porches near the street. For anyone researching neighborhoods near major retail nodes, it's worth knowing the calendar matters.
How to Research Safety Before Choosing a Neighborhood
Start with the Right Geographic Unit
City-level crime statistics are the least useful tool for making a neighborhood decision. A 1-in-13 property victimization risk in Downtown Bellevue and a sub-1-percent violent crime rate in Somerset are both true, and they describe experiences that feel nothing alike. Before settling on an area, drill down to the census-tract or neighborhood level using NeighborhoodScout, CrimeGrade.org, or AreaVibes — all of which publish granular breakdowns for Bellevue's neighborhoods.
Use the City's Own Data
The Bellevue Police Department publishes crime mapping and incident data through the city's official portal at bellevuewa.gov/police. This is the primary-source alternative to third-party aggregators and lets you filter by crime type and date range for specific areas. It takes twenty minutes and tells you more than any static ranking.
Match Crime Type to Your Actual Risk Profile
If you work from home and rarely use park-and-ride lots, Bellevue's property crime rate is almost theoretical for your daily life. If you commute by car and park in a surface lot near Eastgate or Factoria, motor vehicle theft and break-ins are a direct operational concern. Sorting by crime type — violent crime, theft, vehicle crime — rather than the aggregate figure produces a much cleaner match between what the data shows and what you'll actually experience.
| Research Step | Tool | What You Learn |
|---|---|---|
| City-level context | NeighborhoodScout, AreaVibes | How Bellevue compares to state and national averages |
| Neighborhood-level grades | CrimeGrade.org, DoorProfit | Which specific areas grade A vs. C within Bellevue |
| Incident-level mapping | bellevuewa.gov/police | Where break-ins and thefts actually clustered, by month |
| Crime type filtering | Any of the above | Separates property risk from violent crime — critical for Bellevue |
| Year-over-year trend | AreaVibes, BPD annual reports | Whether a neighborhood is improving or trending the wrong way |
| Neighboring city comparison | NeighborhoodScout comparisons | How Redmond, Kirkland, Issaquah, and Sammamish compare |
Talk to People Who Live There
The Nextdoor communities for Somerset, Newport Hills, and West Bellevue are active and candid. What you'll find in those feeds is more granular than any crime database: a stretch of 150th Avenue SE where a string of car break-ins happened in March, a park where a group gathers regularly, a block where residents installed a coordinated Ring network. That's the ground-level layer that the data can't give you, and it's freely available before you commit to an area.
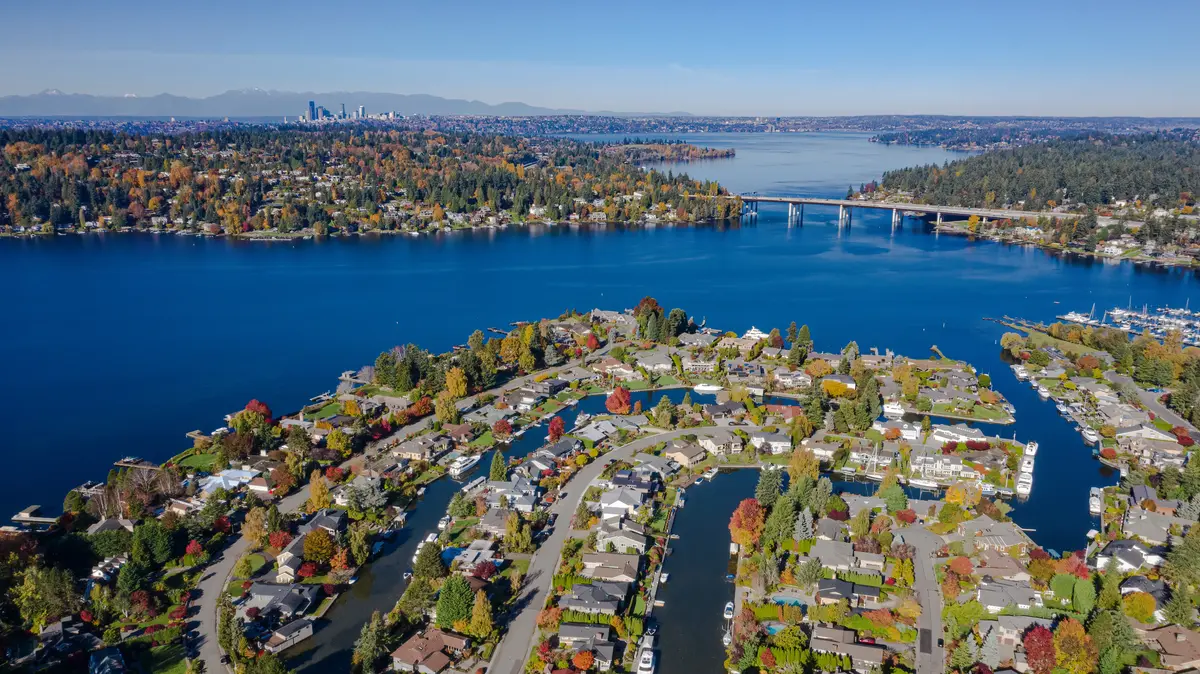
Local Expert Takeaway: Bellevue's violent crime rate — roughly 1 per 1,000 residents — is one of the lowest you'll find in any Washington city of this size, and about a quarter of the national average. The property crime figure of 34 per 1,000 is real but concentrated: it lives in the commercial corridors around Downtown Bellevue and Crossroads, not in the residential hillside neighborhoods of Somerset or Newport Hills. If you're choosing between the southeast quadrant and something closer to the I-90 interchange near Factoria or Eastgate, the safety gap between those areas is measurable. About 80% of Bellevue neighborhoods grade A for safety in current crime-map analysis — and the 2025 department data shows the trend moving sharply in the right direction.
Quick Takeaways & FAQs
✅ Bellevue's violent crime rate of approximately 1 per 1,000 residents is less than a third of Washington State's average and roughly a quarter of the national rate — making it one of the safest larger cities in the Pacific Northwest.
⚠️ The city's property crime rate of 34 per 1,000 is a real number, driven by commercial-corridor theft and motor vehicle theft near transit hubs and retail centers — not by conditions in most residential neighborhoods.
📍 Somerset grades A+ for safety with a property crime rate of approximately 771 per 100,000 — dramatically below the city average — while Downtown Bellevue carries the highest property crime concentration, roughly 1-in-13 annual victimization risk.
Is Bellevue safer than Seattle?
Which Bellevue neighborhoods have the lowest crime rates?
Why is Bellevue's property crime rate so high if it's considered safe?
Is crime in Bellevue getting better or worse?
Is Downtown Bellevue safe to live in?
Moving to Washington?
Tell us what you need help with and we'll connect you with local resources.
