Most people researching Baker City expect a remote Eastern Oregon town to have a complicated safety story. What the data actually shows is the opposite. With a population of 10,135 spread across a city that still functions at a genuinely human scale, Baker City posts crime numbers that would make most Oregon cities envious. That reality doesn't match the vague warnings that show up when you type the city into a crime-mapping site — and understanding why requires looking past the headline figures.
The city sits along I-84 in Baker County, about 45 minutes to La Grande to the northwest. Its economy runs on the Baker School District, Baker County government, the City of Baker City, the US Forest Service, and a regional health system. Historic tourism tied to the Oregon Trail corridor and the Victorian commercial district draws visitors year-round, and that foot traffic shapes where crime concentrates — not which neighborhoods are actually dangerous to live in.
Property crime is the main thing worth understanding here, not violent crime. Baker City carries a property crime rate of 12 per 1,000 residents — well below the state figure — while the violent crime picture is even quieter. The city's typical home price of $268,574 (Zillow Home Value Index, July 2026) reflects a market where people genuinely choose to stay, and long-term residents consistently describe the place as peaceful in ways that hold up when you check the numbers. For more on how costs fit together, see the cost of living breakdown.
Whether you're weighing a move to Baker City or trying to understand which neighborhoods suit your situation, the sections below work through the crime data, the spatial picture across Downtown, the Riverfront District, Grandview, North Baker City, Sunridge Estates, and the other neighborhoods, what the police department does in the community, and the honest safety questions worth asking before you settle on an area.

Baker City Crime Rates vs. Oregon and the Nation
The comparison that matters most is the simplest one: Baker City carries a violent crime rate of 1 per 1,000 residents — against a state violent crime rate of 3.3 per 1,000 and a national violent crime rate of 3.7 per 1,000. That is not a marginal difference. It puts Baker City at roughly a quarter of the state rate on the metric most people care about first.
The property crime picture is similarly encouraging. Baker City carries a property crime rate of 12 per 1,000 residents — less than half Oregon's state figure of 24.5 per 1,000, and meaningfully below the national figure of 18.4 per 1,000. Both figures come from Bureau of Justice Statistics, Crime Known to Law Enforcement, 2024 (tables 2 and 3), the same reporting series used for the state and national benchmarks, which matters: mixing reporting series makes gaps look larger or smaller than they actually are.
The engine renders a full comparison table below this section. What it won't show you is the texture behind those numbers — where the incidents actually happen and what's driving them. That picture is what the next section covers.
One honest caveat: Baker City is a city of 10,135 people. Small populations amplify statistical swings. A single unusual year can move the per-1,000 rate noticeably. The figures here reflect 2024 reporting, and the pattern across multiple years has been consistent — but no small-city crime number should be read as a guarantee of what any given street will feel like.
Where Crime Concentrates — and Why It's Not What You Think
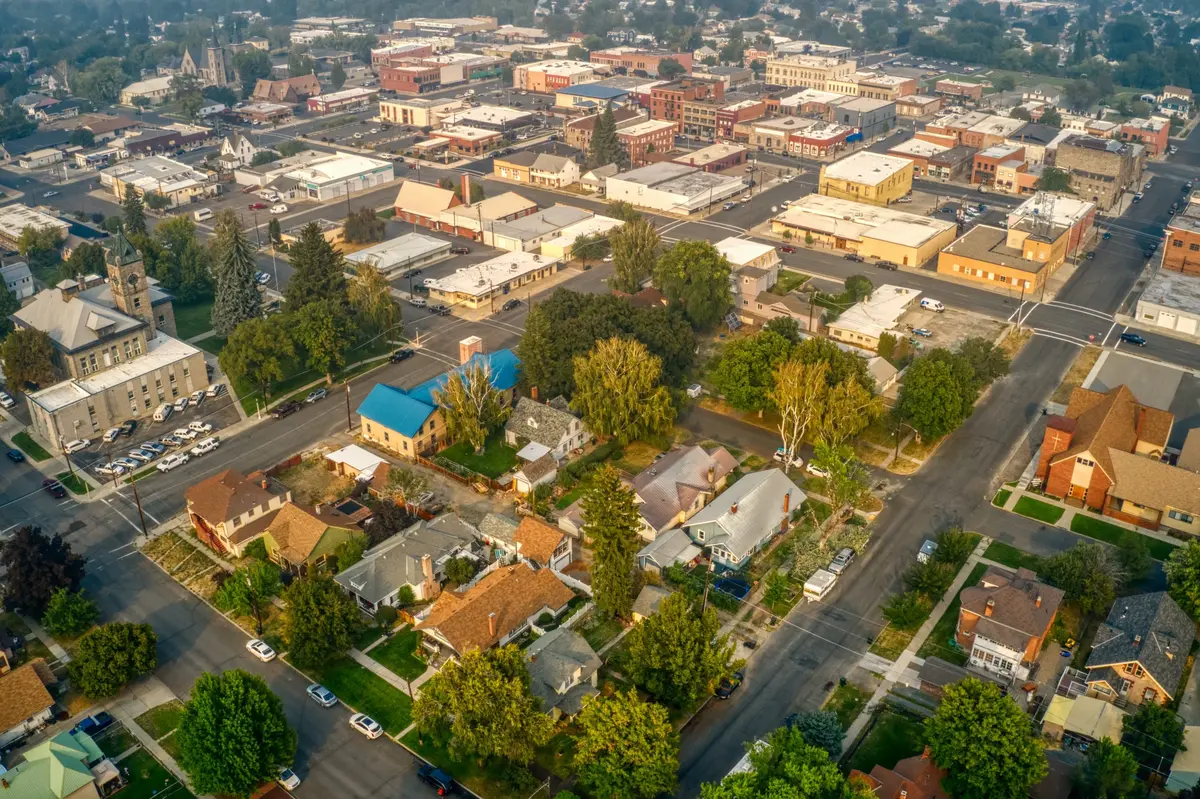
If you've ever pulled up a heat map for Baker City and seen red in the middle of town, the explanation is almost entirely about visitor traffic and retail density, not about the residential safety of those blocks. The downtown commercial corridor sees the highest incident concentration in the city, while the residential areas toward the southeast see comparatively few — a meaningful gap that reflects how crime follows foot traffic rather than how dangerous a neighborhood is to actually live in.
Tools like CrimeGrade.org make this interpretive point directly: a high-traffic commercial area reading as elevated does not mean the neighborhood is unsafe for residents, because incident rates are calculated per resident. Areas with heavy visitor traffic read high simply because crime follows crowds.
Downtown Baker City is one of the largest intact Victorian commercial districts in the Northwest. The Geiser Grand Hotel, Baker Tower, and St. Francis de Sales Cathedral anchor a corridor that draws festivals, gallery visitors, and Oregon Trail tourists throughout the year. That foot traffic is a genuine asset — it sustains a walkable historic core that most Eastern Oregon towns don't have. It also means that the commercial strip will always look busier on a crime map than the neighborhoods where Baker City families actually live.
Property-related theft is the most commonly cited concern for Baker City, and it skews toward the commercial corridor rather than residential streets. The city's theft rate runs meaningfully below the Oregon state average — which itself already runs above the national average — putting Baker City in a calmer position than most comparable Oregon cities on that metric.
What This Means When You're Researching a Neighborhood
The practical takeaway is to read spatial crime data at the right level of resolution. A neighborhood that abuts the downtown commercial zone — parts of the Central Neighborhood and the Riverfront District — will show more background incident noise on mapping tools than Grandview, North Baker City, or Sunridge Estates simply because of proximity to the tourist corridor. That doesn't make them unsafe to live in; it means you're reading visitor-traffic crime, not residential crime patterns.
Before settling on a specific area, look at the block-level distribution rather than a neighborhood-wide score. The difference between a street that faces the commercial strip and one that's two blocks into a residential pocket can be larger than the difference between two entirely separate neighborhoods.
Safety by Neighborhood: What the Spatial Picture Shows
Baker City's eight recognized neighborhoods sit within a genuinely small geographic footprint, which means no area is isolated from the rest of the city. The safety variation that exists is mostly about proximity to the downtown commercial core — not about distinct zones with meaningfully different resident-level risk.
| Neighborhood | Character | Safety Notes | Best For |
|---|---|---|---|
| Downtown Baker City | Victorian commercial core; walkable; high foot traffic from tourism and events | Highest incident concentration citywide — driven by retail density and visitors, not resident risk | Walkable |
| Central Neighborhood | Mixed residential adjacent to downtown; older housing stock | Moderate incident noise from proximity to commercial core; quieter on residential streets | First-Time Buyers |
| Riverfront District | Residential along the Powder River and Leo Adler Memorial Parkway | Quiet residential character; flood zone status is the due-diligence item, not crime | Nature Families |
| Grandview | Mid-century ranch homes near the parkway trail corridor; limited turnover | Among the quieter residential options in the city; low incident rates | Quiet Families |
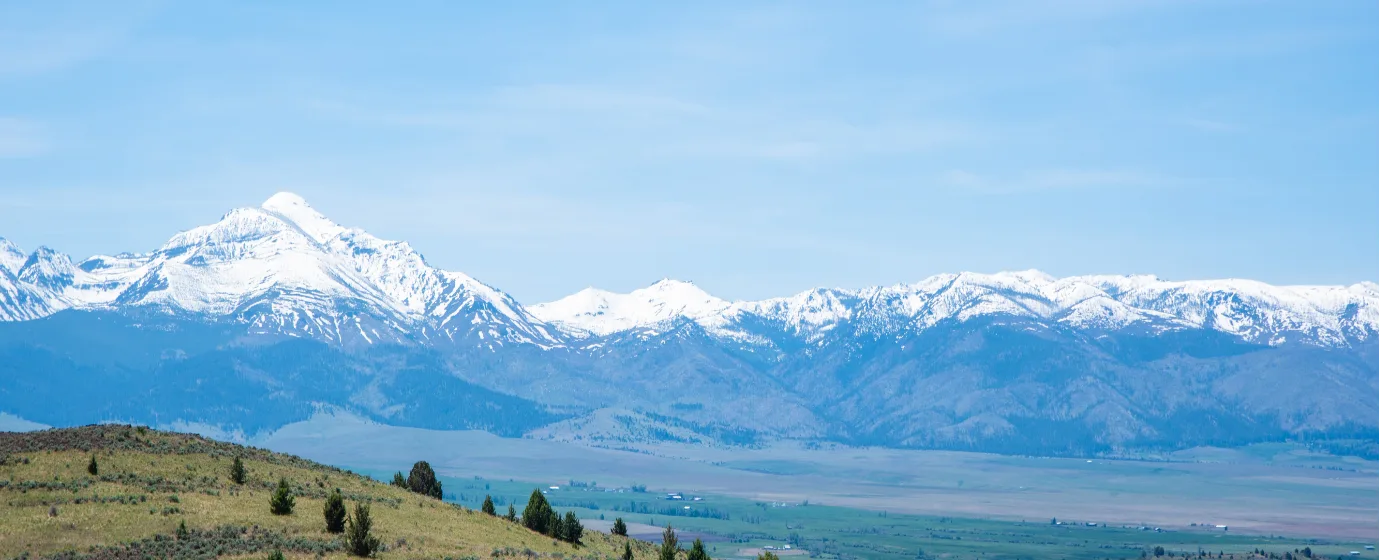
| North Baker City | Affordable residential with Elkhorn Mountain views; mix of families, retirees, outdoor enthusiasts | Rated the most affordable neighborhood locally; quiet and residential in character | Value Families |
| Sunridge Estates | Newer suburban-style construction; larger lots; updated homes | Low incident rates consistent with newer residential development away from commercial zones | Families Luxury |
| South Baker | Established residential; mix of housing ages and sizes | Residential character; lower incident exposure than downtown-adjacent blocks | First-Time Buyers |
| West End | Quieter residential on the western edge of the city | Limited commercial activity means low incident concentration; calm and settled | Quiet Privacy |
For a fuller picture of how these neighborhoods compare on housing character and who each one suits best, see the Baker City neighborhoods guide.
The Riverfront District: One Safety Note Worth Knowing
The Riverfront District's appeal centers on the 3-mile Leo Adler Memorial Parkway running alongside the Powder River. That proximity to the river is also the one environmental safety factor worth researching here: blocks immediately adjacent to the parkway may fall within a FEMA-designated flood zone. The City of Baker City maintains official Flood Insurance Rate Maps and requires a Floodplain Development Permit for construction within the 100-year floodplain. If you're considering a home close to the river, checking FEMA flood zone status is a meaningful part of the due-diligence picture — not because of crime, but because of what living next to an active river corridor requires over the long term.
Looking to buy in Baker City? Estimate your payment.
Enter your numbers to see an estimated monthly mortgage payment.
Estimate only. Excludes HOA fees and mortgage insurance. The interest rate above is a starting point, not a quoted rate — replace it with your own to see real numbers. Insurance is a flat placeholder, not a Baker City quote.
What Baker City's Police Department Actually Does in the Community
The Baker City Police Department frames its mission explicitly around partnership with residents: to work alongside community members to actively promote the safety and welfare of citizens. For a city of 10,135, that framing tends to be more than language — departments at this scale are genuinely embedded in the community in ways that larger urban departments aren't.
Community programs include neighborhood watch initiatives, youth engagement, and victim assistance services. The city's official website maintains a dedicated resource page for residents who want to start or grow a neighborhood watch program — an institutional signal that this isn't a passive posture toward community safety, but something the department actively supports rather than just acknowledging when asked.
Neighborhood Watch and What It Signals
A functioning neighborhood watch infrastructure matters more in a smaller city than in a metro area, because the informal social fabric of the neighborhood is the first line of awareness. When residents know their neighbors and are connected to a watch program, low-level property crime — the most common concern in Baker City — tends to stay low. The fact that the city has built the institutional scaffolding for this kind of participation is the relevant detail.
Long-time residents on community platforms consistently describe Baker City as a peaceful, family-oriented place where safe, quiet neighborhoods and a genuinely welcoming community are the baseline, not the exception. That tracks with the numbers, and it also reflects something about life in a smaller Eastern Oregon city where the social density that comes with a smaller population is itself a safety mechanism.
Six Months In: What Newcomers Sometimes Discover
People who move to Baker City from larger Oregon metros often underestimate how visible everyday life is in a city this size. In a town of 10,135, unfamiliar faces in a neighborhood are noticed — by neighbors, by regular dog-walkers along the Leo Adler Memorial Parkway, by the people who've lived on a block for twenty years. That social transparency works in favor of residential safety and can feel genuinely reassuring after living somewhere more anonymous. It also means there's less separation between public and private life than newcomers from Portland or Bend might expect.
Honest Safety Tradeoffs and What to Research Before Choosing an Area
Baker City's crime numbers are genuinely good — among the better profiles of any small city in Oregon. But "safe city" and "no considerations" are different things, and a few honest items are worth naming before you commit to a specific neighborhood.
Property Crime Is the Real Variable
Violent crime is not a meaningful everyday concern in Baker City at the city-wide level. Property crime — primarily theft — is the category that fluctuates and the one worth paying attention to when you're evaluating a specific block. The commercial downtown concentration means that proximity to Main Street and the historic corridor is the main factor. Neighborhoods like Grandview, North Baker City, Sunridge Estates, and the West End sit far enough from that activity that property crime exposure is low and consistent with a quiet residential setting.
The Seasonal Tourist Effect
Baker City draws Oregon Trail heritage visitors, history tourists coming for the National Historic Oregon Trail Interpretive Center, and recreation traffic headed toward the Elkhorn Mountains, Hells Canyon National Scenic Area, and Anthony Lakes Mountain Resort. Most of that visitor concentration flows through downtown and the commercial corridor — it doesn't penetrate deeply into residential neighborhoods. But during peak tourism months, the downtown-adjacent blocks carry a noticeably different energy than they do in January. If the commercial district is part of your daily routine, that seasonal rhythm is something to experience before you settle in rather than after.
Flood Zone Status in the Riverfront District
Already covered in the neighborhood section, but worth repeating plainly: if you're drawn to the Riverfront District for the parkway access and Powder River proximity, verifying FEMA flood zone status for any specific parcel is not optional. The city has the maps and the permit process; use them. This is the environmental safety question that matters in that neighborhood, and it's separate from crime entirely.
The Rural Context
Baker City is the county seat of Baker County and the largest city for a substantial stretch of I-84. Emergency response is professional, but the rural geography of Eastern Oregon means that in genuinely unusual situations, mutual aid from other jurisdictions involves distance. This is the nature of choosing a small city in a remote region, and most residents factor it into how they think about preparedness — not as a reason to avoid the city, but as context for why community networks matter here more than they would in a metro area.
For more on who Baker City tends to suit well and how the city's character fits different households, the living in Baker City overview covers the full picture.

Local Expert Takeaway: Baker City's crime numbers tell a genuinely reassuring story — a violent crime rate of 1 per 1,000 residents at roughly a quarter of the state average, and a property crime rate of 12 per 1,000 residents at less than half Oregon's figure. The practical thing to understand is where the incidents actually happen: the historic downtown commercial corridor, driven by retail foot traffic and visitors to the Geiser Grand Hotel and the Victorian district, not by residential crime. If you're considering Grandview, North Baker City, Sunridge Estates, or the West End, you're looking at neighborhoods that barely register on the crime maps that make people nervous. The Riverfront District is a different conversation — not because of crime, but because FEMA flood zone status along the Powder River is the real due-diligence item there.
Quick Takeaways & FAQs
✅ Baker City carries a violent crime rate of 1 per 1,000 residents — roughly one-quarter of Oregon's state average — a genuine strength that holds up across multiple years of data.
⚠️ Property crime concentrated in the downtown tourist corridor can make city-wide heat maps look worse than residential neighborhood reality; block-level research matters more than a city-wide score.
📍 The Riverfront District's main safety consideration isn't crime — it's FEMA flood zone status along the Powder River, which requires a separate permit check before any construction or renovation.
Is Baker City, Oregon a safe place to live?
Which neighborhoods in Baker City are the safest?
Why does Baker City's downtown look high-crime on mapping tools?
Is there anything specific to watch for in the Riverfront District?
How does Baker City's crime rate compare to other small Oregon cities?
Moving to Oregon?
Tell us what you need help with and we'll connect you with local resources.
