
You've probably seen North Bend's property crime rate and done a double-take. At 43.2 per 1,000 residents, it sits well above the national figure — and if you stop there, this city looks riskier than it is. The fuller picture tells a different story. North Bend sits at the eastern edge of King County, straddling I-90 at the foot of the Cascade Range, and every weekend it absorbs tens of thousands of visitors headed to the North Bend Premium Outlets, the Mount Si trailhead, and the trail corridor along the Snoqualmie Valley. That foot traffic inflates the raw crime count in ways that the per-resident rate doesn't automatically correct for.
The violent crime figure is the one that matters most for people deciding where to live, and here it's genuinely reassuring. At 0.89 per 1,000 residents, North Bend's violent crime rate is roughly one-quarter the national rate of 3.59 per 1,000 (FBI UCR 2024). For a city of 8,268 people with a median household income of $175,109 and strong community engagement with local governance, that low violent crime figure reflects something real about daily life here — not just a statistical fluke.
Context also matters at the state level. Washington ranked 3rd in the nation for property crime rate in 2024, at 2,467 offenses per 100,000 residents, so North Bend's elevated property crime number sits inside a state that is already a high-property-crime environment. The good news: the Washington Association of Sheriffs and Police Chiefs (WASPC) reported in July 2025 that Washington's overall crime rate dropped 14.1% between 2023 and 2024, with property crime specifically falling 13.4%. The trend is moving in the right direction.
This guide breaks down North Bend's crime numbers section by section — what they mean, where the risk is concentrated, how the city's policing structure changed in 2026, and what to watch for when researching specific neighborhoods before you decide where to put down roots.
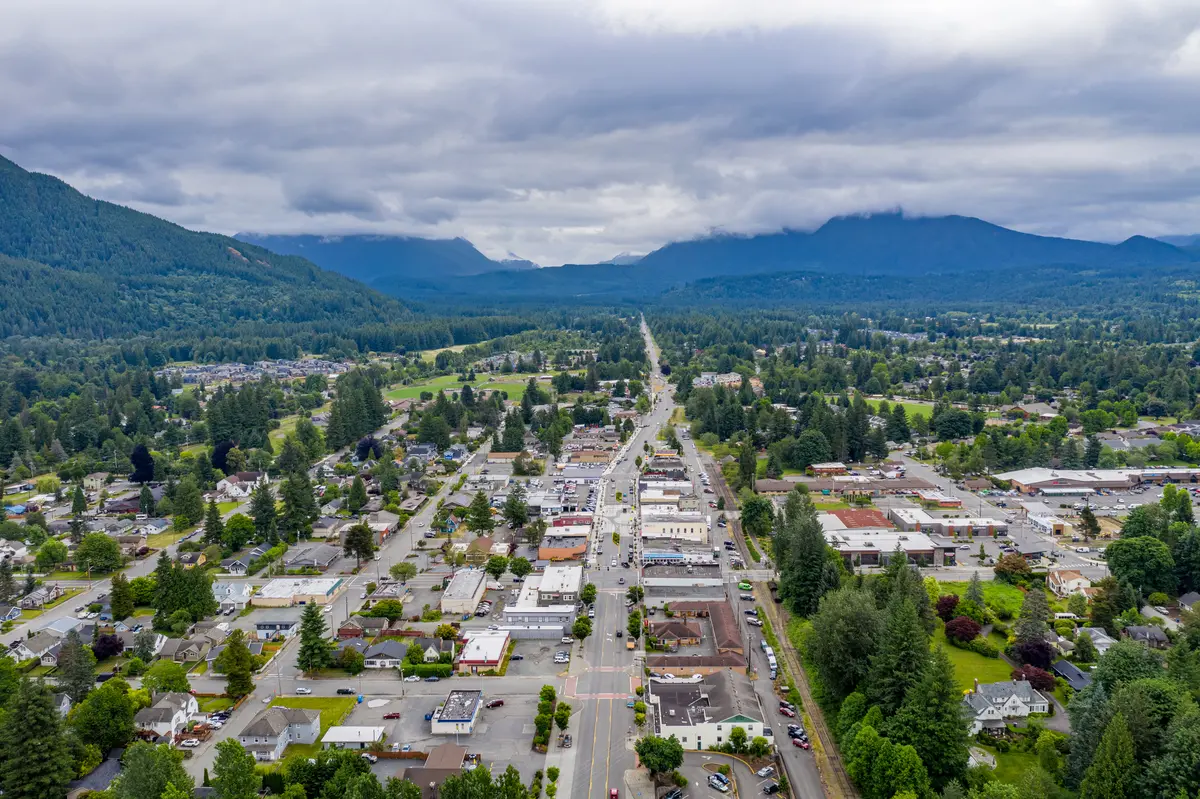
North Bend Crime at a Glance: The Numbers in Context
The single most important thing to understand about North Bend's crime data is that the two headline figures tell completely different stories.
| Crime Type | North Bend (per 1,000) | Washington State (per 1,000) | National (per 1,000) | North Bend vs. National |
|---|---|---|---|---|
| Violent Crime | 0.89 | ~3.29 | 3.59 | Dramatically lower |
| Property Crime | 43.2 | ~24.98 | 17.60 | Noticeably higher |
| Crime cost per resident/yr | $419 | ~$610 | ~$464 | Below both benchmarks |
| CrimeGrade.org safety grade | B- | — | — | 56th percentile nationally |
| Resident police satisfaction (2023 survey) | 74% | — | 51% (national avg) | 23 points above national |
The violent crime gap is striking. North Bend's 0.89 per 1,000 rate means a resident here faces roughly one-quarter the violent crime risk of the average American — and about one-third the risk of the average Washington state resident.
The property crime rate, at 43.2 per 1,000, is the number that warrants honest examination. It places North Bend above both the state and national figures — but understanding why that number is high is essential before drawing conclusions about residential safety.
The Visitor Effect
North Bend is not a typical small city of 8,268 people. The North Bend Premium Outlets alone draws visitors from across the Seattle metro region year-round. The Mount Si trailhead sees an estimated 60,000+ hiker visits annually. I-90 funnels through-traffic from Seattle all the way to eastern Washington.
Property crimes — primarily vehicle break-ins and theft — concentrate heavily at these high-traffic locations. A car left at the Mount Si trailhead parking area on a Saturday is in a fundamentally different risk environment than a car parked in a residential driveway on Tanner Road. The raw rate combines both.
CrimeGrade.org's estimated crime cost of $419 per North Bend resident per year is $45 below the national average and $191 below Washington's state average — a more holistic signal that the city's crime burden, when distributed across its residents, falls below both benchmarks.
Neighborhood-Level Safety: Where Risk Concentrates
North Bend doesn't have a uniform safety profile across its neighborhoods. Risk concentrates around commercial and high-traffic corridors, while residential areas away from those zones report very little incident activity.
Downtown North Bend
The stretch of North Bend Way through downtown — where independent cafes, local bars, and the main commercial strip operate — sees the highest density of incidents simply because it's the most active corridor. Most of what happens here is minor: shoplifting, occasional vehicle prowls in parking lots, intoxicated persons. Violent incidents are rare.
If you're researching a home within walking distance of downtown, the honest trade-off is proximity to services versus the background hum of a busy commercial strip. The feel at night, especially midweek, is quiet.
North Bend Premium Outlets Area
The Outlets off SE North Bend Way is the single biggest driver of North Bend's elevated property crime rate. Parking lot vehicle break-ins and retail theft pull this node's numbers up meaningfully. Residents who live near the outlet corridor report that the incidents are almost entirely concentrated in the commercial lots themselves — not spilling into adjacent streets.
Practical note: don't leave valuables visible in your car anywhere near the outlet parking areas. This applies equally to locals and visitors.
Riverbend and Si View
These established residential neighborhoods along the Snoqualmie River floodplain and the Si View Community Campus corridor are the most insulated from commercial traffic. Streets here dead-end or loop back on themselves, which naturally limits through traffic. Incident reports in these areas are sparse.
Best for: Families Quiet
Tanner and Tannerwood
Tanner Road and the Tannerwood subdivision to the north sit between the downtown core and the forested edge of the Cascade foothills. These areas have a semi-rural character — larger lots, fewer streetlights, and limited pedestrian traffic after dark. Incident rates here are low. The main safety consideration is wildlife (bear and cougar sightings are not unusual near the forest edge) rather than crime.
Best for: Privacy Nature
North Bend Uplands & Reserve and Cascade Canyon
These higher-elevation residential areas above the valley floor are among the least incident-prone in the city. Access roads are limited, the resident-to-visitor ratio is high, and the communities are tight-knit enough that unfamiliar vehicles tend to get noticed. If your priority is residential tranquility with essentially no exposure to the commercial crime patterns downtown, these neighborhoods deliver that.
Best for: Views Quiet
Forest Service / Mt. Si Corridor
The area around the Mount Si trailhead and the U.S. Forest Service Ranger Station is not a residential neighborhood in the traditional sense, but it borders several properties and is important context. Trailhead parking lots are targeted for vehicle break-ins on weekends and holidays. If you're previewing a property with road access near the trailhead, factor in that parking-adjacent crime pattern — it doesn't carry over to the residential streets themselves, but it's worth knowing.
For a fuller look at how these neighborhoods differ day-to-day — beyond the safety angle — see the North Bend neighborhoods guide.

Who Polices North Bend — and What Changed in 2026
On April 1, 2026, the King County Sheriff's Office (KCSO) became North Bend's official police services provider. This replaced an Interlocal Agreement with the Snoqualmie Police Department that had been in place since 2012 — a notable structural shift that anyone researching North Bend's safety picture right now should understand.
Why the Switch Happened
The City Council voted to approve the KCSO transition in May 2025 after evaluating long-term service and cost arrangements. The KCSO brings countywide resources, including specialized units and a larger officer pool, that a small contract arrangement with a neighboring city's department couldn't replicate.
Washington state ranks last in the nation for police officers per capita, with only 1.38 officers per 1,000 residents statewide versus a national average of 2.31 (WASPC, July 2025). That structural staffing reality affects response times across the state — including in North Bend. The KCSO transition doesn't fully resolve it, but it does give the city access to a larger countywide deployment framework than it had under the previous arrangement.
What Residents Think
A 2023 North Bend Community Survey found that 74% of residents were satisfied or very satisfied with police services at that time — 23 percentage points above the 51% national satisfaction average. That baseline of strong community confidence heading into the KCSO transition is a meaningful signal.
The city also launched a 2026 Community Police Academy in partnership with KCSO, with sessions running September through October 2026 and open to North Bend residents. Programs like this tend to reflect a community that is actively engaged with its public safety infrastructure rather than passive about it.
What to Watch Going Forward
The KCSO transition is recent enough that 2026 and 2027 crime data will be the first real test of how the new arrangement performs on the ground. If you're doing deep research on North Bend's safety trajectory, check the city's annual report data once the first full KCSO year is reported — it will be more informative than pre-transition figures for understanding the new baseline.
Looking to buy in North Bend? Estimate your payment.
Enter your numbers to see an estimated monthly mortgage payment.
Estimate only. Excludes HOA fees and mortgage insurance. The interest rate above is a starting point, not a quoted rate — replace it with your own to see real numbers. Insurance is a flat placeholder, not a North Bend quote.
The Property Crime Reality: Honest Perspective for Residents
Forty-three incidents per 1,000 residents sounds alarming until you understand what's being counted, where it's happening, and who it's actually happening to.
What 'Property Crime' Includes Here
Washington state uses a broad definition of property crime that includes retail theft, motor vehicle theft, burglary, and larceny. In a city with a major outlet mall and a nationally known trailhead, retail theft and parking lot larceny account for a disproportionate share of the total — incidents that affect businesses and visitors far more than residents in their homes.
Home burglary — the crime most directly relevant to residential safety — is a much smaller subset of that 43.2 figure. The residential streets of Riverbend, Tannerwood, and the Uplands report burglary rates that are consistent with low-incident suburban communities, not a city with an elevated aggregate property crime number.
The State-Level Backdrop
Washington ranked 3rd in the nation for property crime rate in 2024. That context is not an excuse — it's a calibration tool. If you're comparing North Bend to a city in a low-property-crime state, you're not making an apples-to-apples comparison. Compare it instead to other gateway cities along I-90 or similar high-traffic corridors in the Pacific Northwest, and the gap narrows considerably.
The WASPC July 2025 report also documented a 13.4% statewide decline in property crime between 2023 and 2024. North Bend's figure, once current-year data is published, will likely reflect some of that improvement.
What Residents Actually Experience
Six months in, newcomers to North Bend's residential neighborhoods consistently report the same surprise: how quiet the streets feel. The outlet traffic and trailhead crowds are real, but they stay concentrated on North Bend Way and the commercial corridors near the I-90 interchange. The residential blocks east toward Tanner Road and north toward the Uplands have the unhurried feel of a small mountain town — because, most evenings, that's exactly what they are.
The one thing locals know that visitors don't: always lock your car, never leave anything on the seat, and treat trailhead parking the same way you'd treat parking in a busy Seattle commercial district on a summer Saturday. That discipline, applied consistently, neutralizes most of the personal exposure to North Bend's elevated property crime rate.
How North Bend's Safety Profile Compares — and What to Research Before You Decide
Framing North Bend's safety relative to the places most people are moving from or considering helps put the numbers in working perspective.
| Geography | Violent Crime (per 1,000) | Property Crime (per 1,000) | Overall Safety Signal |
|---|---|---|---|
| North Bend, WA | 0.89 | 43.2 | Very low violent crime; elevated property crime driven by visitor traffic |
| Washington State avg. | ~3.29 | ~24.98 | High-property-crime state context |
| National avg. | 3.59 | 17.60 | Baseline for comparison |
| Snoqualmie (neighboring) | Similar small-city range | Lower visitor-driven footprint | Quieter commercial profile than North Bend |
| Issaquah (I-90 corridor) | Low range | Elevated; similar outlet/commercial dynamic | Comparable pattern to North Bend |
| Seattle (origin city for many) | Significantly higher | Significantly higher | North Bend is considerably safer on both measures |
For buyers relocating from Seattle or the Eastside, North Bend's violent crime figure will read as a substantial improvement. For buyers coming from lower-cost, lower-crime markets in other states, the property crime rate will be the adjustment.
What to Actually Look Into Before Choosing a Neighborhood
The King County Sheriff's Office publishes call-for-service data that you can filter by geographic area — it's more granular than city-level aggregate statistics and will let you compare incident volumes on specific streets or near specific intersections. That's the right tool for distinguishing between a home on a quiet Tannerwood cul-de-sac and a unit in a complex one block off North Bend Way.
Drive the neighborhood you're considering on a Saturday afternoon in summer. That's when trailhead and outlet traffic peaks, and you'll see exactly how far the commercial congestion actually reaches. Most residential blocks feel entirely removed from it — but seeing it firsthand is more useful than any crime map.
Washington state's sex offender registry (managed by the Washington State Patrol) is searchable by address and ZIP code. Running a search on any neighborhood you're seriously considering is straightforward and takes about five minutes.
A Seasonal Quirk Worth Knowing
Late October through early November brings one of the most intense visitor surges North Bend sees all year — the Snoqualmie Valley's harvest season and the Halloween period draw massive day-trip crowds along North Bend Way. Parking spills out of the outlet lots, foot traffic on the main commercial strip approaches summer-weekend levels, and vehicle prowl incidents historically tick up during this window. If you're visiting to assess a neighborhood during this period, account for the fact that you're seeing North Bend at its most compressed, not its daily baseline.

Local Expert Takeaway: North Bend's violent crime rate — 0.89 per 1,000 residents — is genuinely low, roughly one-quarter the national average, and it reflects daily life here accurately. The elevated property crime rate of 43.2 per 1,000 is real but almost entirely concentrated at the North Bend Premium Outlets parking areas and the Mount Si trailhead lots, not in the residential neighborhoods where people actually live. Lock your car at those locations every time, and your personal exposure to that figure drops sharply. The 2026 transition to King County Sheriff's Office policing is new enough that 2027 data will be worth watching — but the city's 74% resident satisfaction with police services, and the availability of a community police academy, suggest an engaged local relationship with public safety that holds across the transition.
Quick Takeaways & FAQs
✅ North Bend's violent crime rate of 0.89 per 1,000 is roughly one-quarter the national average — among the strongest safety statistics a small Seattle-area city can show.
⚠️ Property crime at 43.2 per 1,000 is elevated above state and national figures, but the bulk of incidents are concentrated at trailhead and outlet parking lots, not in residential streets.
📍 As of April 1, 2026, the King County Sheriff's Office replaced the Snoqualmie Police Department as North Bend's law enforcement provider — a structural change recent enough that it's worth monitoring as the first full-year data comes in.
Is North Bend, WA a safe place to live?
Why is North Bend's property crime rate so high compared to the national average?
Who provides police services in North Bend?
Which neighborhoods in North Bend have the lowest crime?
How does North Bend's safety compare to nearby cities like Snoqualmie or Issaquah?
Moving to Washington?
Tell us what you need help with and we'll connect you with local resources.
