
People who move to Edmonds from Seattle or from out of state often say the same thing around month three: it feels noticeably quieter than they expected from a Puget Sound city of 42,000. That intuition is backed by numbers. Edmonds's violent crime rate sits at approximately 3 per 1,000 residents — a figure that lands below both the Washington State average and the U.S. national rate. But safety in any city is more layered than a single rate, and Edmonds is no exception. Property crime is the more relevant day-to-day concern here, and understanding exactly where and what kind matters before you decide on a neighborhood.
Washington State carries one of the worst property crime rankings in the country — 3rd worst nationally per FBI Uniform Crime Report data for 2024 — which gives any city in the state a tougher baseline to beat. Edmonds's property crime rate of 30 per 1,000 is real and shouldn't be minimized, but it lands in a very different context than the same number would in, say, a low-property-crime state. The city benefits from an active Edmonds Police Department that publishes annual reports, maintains a publicly accessible Community Crime Map, and runs an organized Block Watch program across residential neighborhoods. Chief Loi Dawkins, appointed in July 2025, brought more than 23 years of law enforcement experience from King County Sheriff's Office, Metro Transit Police, and the Muckleshoot Tribal Police.
Day-to-day life in Edmonds feels safe in the way small waterfront cities do — the Edmonds Waterfront and Marina draw foot traffic, the downtown along 5th Avenue North and Main Street stays lively without the friction of a larger urban core, and residential blocks in areas like Meadowdale and North Edmonds are genuinely quiet. Property crime incidents cluster near commercial corridors and transit-adjacent areas, which is consistent with the broader Pacific Northwest pattern. Knowing which pockets carry higher risk — and which are among the quietest in Snohomish County — is what separates a well-informed neighborhood decision from a guess.
Whether you're narrowing down a neighborhood or just doing your homework before visiting, the sections below break down Edmonds's crime figures against state and national benchmarks, map the safety picture across specific neighborhoods, explain the property crime reality honestly, and walk through the tools the city gives residents to stay informed.
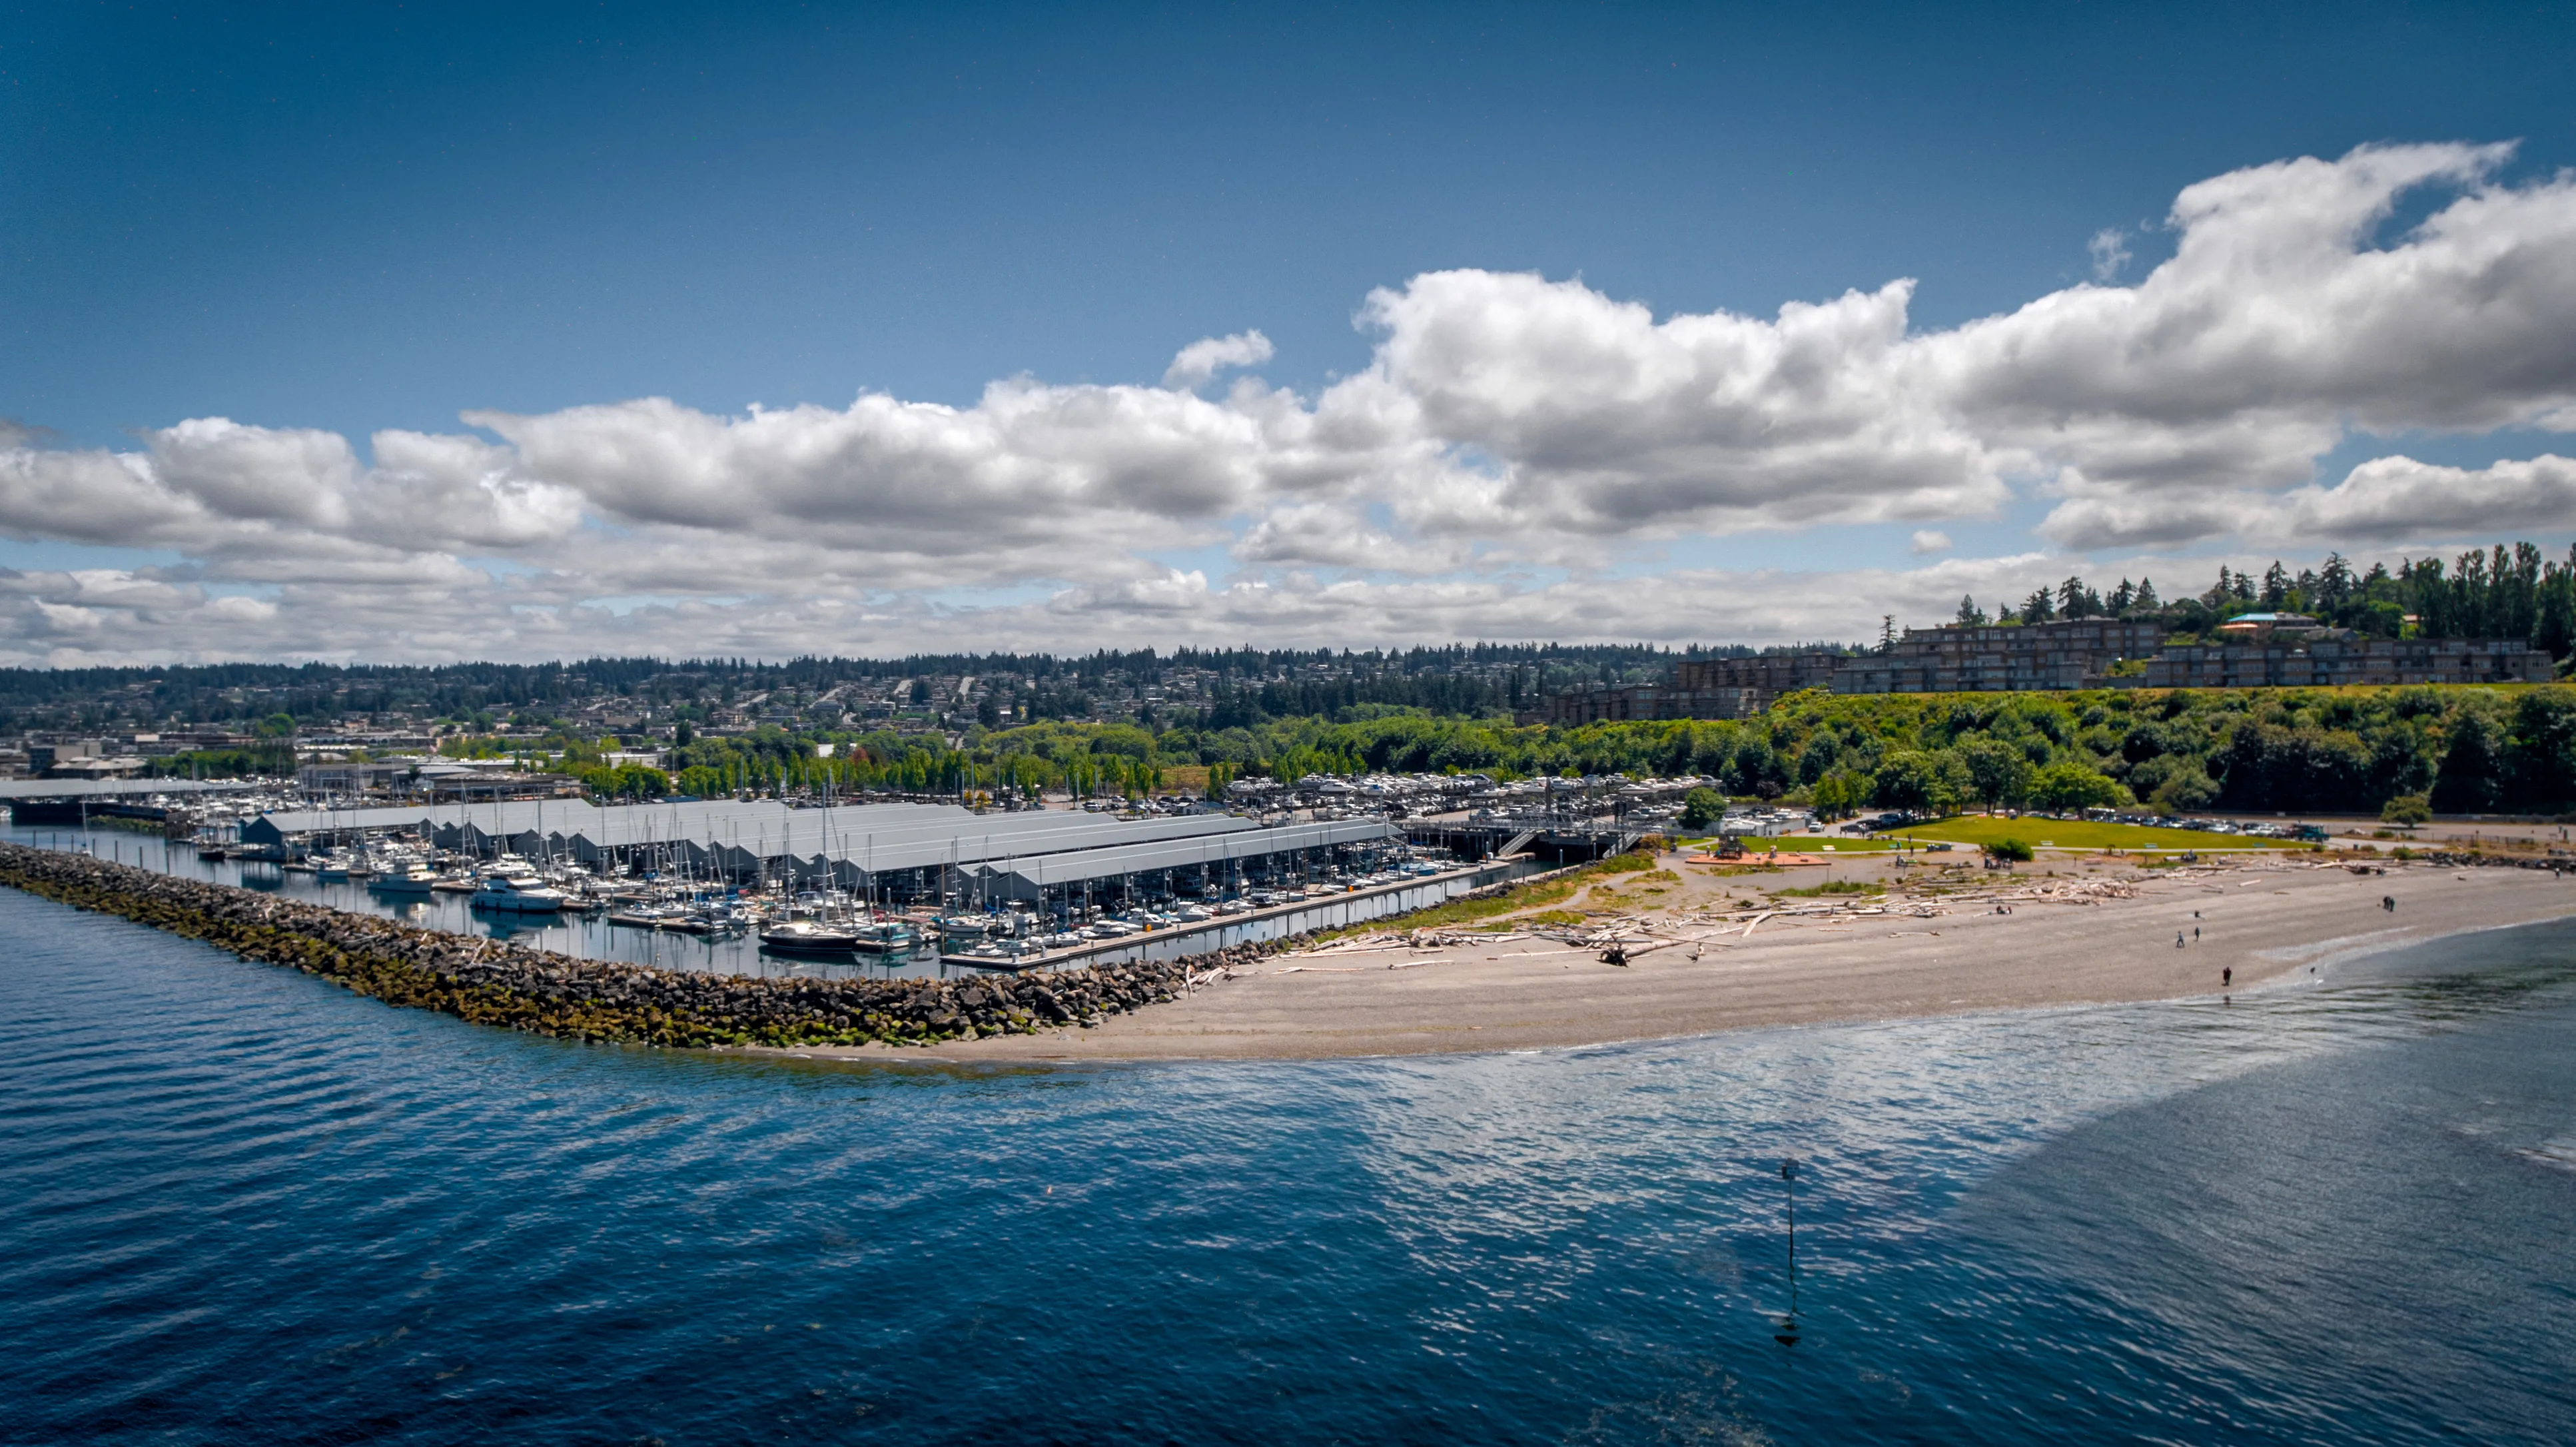
Edmonds Crime Rates vs. State and National Benchmarks
The headline figure is reassuring but deserves context. Edmonds's violent crime rate of approximately 3 per 1,000 residents sits below Washington State's 2024 rate of 326 per 100,000 (3.26 per 1,000) and below the U.S. national rate of 359 per 100,000 (3.59 per 1,000), per FBI Uniform Crime Report data. AreaVibes, drawing on the same 2024 FBI data released in September 2025, calculated Edmonds's violent crime rate at roughly 260 per 100,000 — approximately 27.5% below the national average.
That is a meaningful gap. For a city of 42,735 on the north edge of the Seattle metro, those numbers reflect something real about how the city functions — not just statistical noise.
| Geography | Violent Crime (per 1,000) | Property Crime (per 1,000) | vs. Edmonds Violent |
|---|---|---|---|
| Edmonds, WA | 3.0 | 30 | — |
| Washington State (2024) | 3.26 | 24.67 | Noticeably higher |
| U.S. National (2024) | 3.59 | ~19.5 est. | Higher |
| Lynnwood, WA | Higher than Edmonds* | Higher than Edmonds* | Higher |
| Shoreline, WA | Comparable range* | Comparable range* | Similar |
| Mukilteo, WA | Lower than state avg* | Lower than state avg* | Similar or lower |
* Neighboring city figures are qualitative comparisons based on regional crime reporting context; Edmonds figures are from the authoritative city fact sheet and FBI UCR 2024 data.
The state picture matters here. Washington ranked 3rd worst nationally for property crime in 2024, at 2,467 property offenses per 100,000. Edmonds's property crime rate of 30 per 1,000 (3,000 per 100,000) is elevated against that already-high state baseline — meaning this is an area where residents in every Washington city pay attention, and Edmonds is no exception.
The good news on trend lines: Washington's overall crime rate dropped 11.6% from 2023 to 2024, with violent crime specifically down 6.2% year-over-year, per FBI data compiled by CrimeByCIty.com. Nationally, violent crime fell 4.5% and property crime dropped 8.1% in 2024. Edmonds is moving with that current, not against it.
One important methodological note: some third-party sites like NeighborhoodScout and CrimeGrade publish higher composite crime scores for Edmonds. That's because they use NIBRS Group A offenses — a broader category that includes offenses not counted in the traditional FBI index crime figures. If you're comparing numbers across sites and seeing different totals, methodology is almost always the explanation.
Neighborhood-Level Safety Picture in Edmonds
Edmonds isn't uniform. The safety profile shifts meaningfully depending on where in the city you're looking, and the dividing line largely tracks the commercial versus residential character of each area. For the full neighborhood character breakdown, see the best neighborhoods in Edmonds guide — but from a crime-pattern standpoint, here's what the data reflects.
Downtown Edmonds / Edmonds Bowl
The downtown core — centered on 5th Avenue North and Main Street near the Edmonds-Kingston Ferry Terminal and Edmonds Waterfront — carries the highest concentration of property crime in the city. That's typical of any commercial district with high foot traffic, retail businesses, parked cars, and transit activity. The Edmonds Fishing Pier and Edmonds Underwater Park draw visitors year-round, which adds activity but also opportunity for opportunistic theft. Living in or near the Bowl means proximity to everything good about Edmonds — but your car and any valuables left visible in it are at higher risk than in residential neighborhoods further north.
North Edmonds
Residents and crime analytics data consistently identify the northwestern residential sections as among the quietest in the city. CrimeGrade's analysis of Edmonds specifically flags the northwest as the area residents consider safest — lower traffic volumes, established single-family blocks, and fewer commercial corridors mean fewer incidents of the opportunistic property crime that drives the city's aggregate number upward.
Meadowdale and Perrinville
These neighborhoods on the city's western and southwestern edges sit in a quieter corridor. Meadowdale's proximity to the beach and the bluff creates a somewhat self-contained residential feel, and crime reports in these areas tend to be sparse. Perrinville, which straddles the Edmonds-Lynnwood boundary, sees slightly more friction near arterial roads that connect to busier Lynnwood corridors — something worth checking on the city's Community Crime Map before settling on a specific block.
Lake Ballinger and Esperance
Lake Ballinger sits at the city's southeastern edge, adjacent to Mountlake Terrace. Esperance is technically an unincorporated Snohomish County area that sits within Edmonds's boundaries for practical purposes but is served by county sheriff rather than the Edmonds Police Department — an important distinction if you're researching crime response times or jurisdiction. Property crime incidents in the Lake Ballinger area tend to track closer to the citywide average than to the quieter northwest.
Seaview and Point Edwards
Seaview is an established residential neighborhood that runs along the western ridge above the ferry corridor. Point Edwards is a gated condominium community on the bluff above the Edmonds Waterfront, with a private road and controlled access — one of the more physically secured residential settings in the city. Neither area generates significant crime volume in city reports.
| Neighborhood | Crime Pattern | Primary Risk Type | Best For |
|---|---|---|---|
| Downtown / Edmonds Bowl | Highest in city | Property / vehicle | Walkable |
| North Edmonds | Among lowest in city | Minimal | Families Quiet |
| Meadowdale | Low | Minimal | Nature Quiet |
| Perrinville | Low to moderate | Near arterials | Families |
| Seaview | Low | Minimal | Views Quiet |
| Point Edwards | Very low (gated) | Minimal | Luxury Privacy |
| Lake Ballinger | Average for city | Property | Value |
| Esperance | County jurisdiction | Property | Value |

Property Crime: The Real Conversation in Edmonds
Violent crime in Edmonds is low enough that it's not the primary safety concern most residents carry day-to-day. Property crime is. At 30 per 1,000 residents, it's the figure that shapes what locals actually do — and don't do — with their cars, garages, and unlocked packages.
What This Looks Like in Practice
Vehicle break-ins are the most common complaint in the downtown commercial corridor and near the ferry terminal. Catalytic converter theft, package theft from porches, and opportunistic car burglaries are the incidents that show up most in the Edmonds Police Department's Community Crime Map and on neighborhood apps. Residents who move here from lower-crime-rate states sometimes underestimate how routine this vigilance becomes.
One friction point newcomers don't expect: the ferry terminal at the base of Main Street draws a steady rotation of vehicles — commuters, visitors, tourists — and that transient traffic creates a different dynamic than a typical quiet suburb. Leaving anything visible in a parked car near the terminal or Edmonds Waterfront is genuinely inadvisable, even for a short errand. Locals know this; newcomers learn it, usually once.
The Washington State Context
Washington's property crime ranking — 3rd worst nationally in 2024 per FBI Uniform Crime Report data — explains why even relatively safe cities in the state carry property crime rates that look elevated against a national chart. Edmonds at 30 per 1,000 outpaces the state's rate of 24.67 per 1,000, which means the city isn't simply riding the state average down. The commercial and transit activity in parts of Edmonds does push the citywide figure above the state number.
The Washington Association of Sheriffs and Police Chiefs (WASPC) noted in August 2025 that while both state and national property crime rates are falling, Washington's decline has been more modest than the national trend. Edmonds benefits from that improving trend, but residents are wise to treat property crime prevention as standard operating procedure rather than an occasional concern.
What Actually Reduces Your Risk
The practical steps that genuinely move the needle here are straightforward: enroll in the Edmonds Block Watch program (the Community Engagement Coordinator at (425) 771-0287 can connect you with neighborhood-level meetings), use the city's Community Crime Map to check specific blocks before committing to an area, and talk to neighbors — the Block Watch network means many blocks have an active resident point of contact who knows exactly what's been happening locally.
Looking to buy in Edmonds? Estimate your payment.
Enter your numbers to see an estimated monthly mortgage payment.
Estimate only. Excludes HOA fees and mortgage insurance. The interest rate above is a starting point, not a quoted rate — replace it with your own to see real numbers. Insurance is a flat placeholder, not a Edmonds quote.
How the Edmonds Police Department Approaches Community Safety
Edmonds operates its own full-service police department — not a contracted arrangement with the county sheriff — which means the city has direct control over staffing, programs, and community engagement priorities. That independence matters for response times and for the kind of neighborhood-level programming the department runs.
Leadership and Structure
Chief Loi Dawkins took command in July 2025, bringing more than 23 years of law enforcement experience spanning King County Sheriff's Office, Metro Transit Police, and the Muckleshoot Tribal Police. That background — particularly the transit policing experience — is relevant in a city where ferry terminal activity creates a distinct set of law enforcement challenges separate from residential patrol.
Community Engagement Programs
The department's Block Watch program is active and organized at the neighborhood level. It's not a passive sign-in-the-yard program — residents can contact the Community Engagement Coordinator directly to set up block-level meetings and build actual neighbor networks. In an era when many suburban police departments have let neighborhood watch programs atrophy, Edmonds has maintained this infrastructure.
The annual Police Open House (held in July 2026) and participation in National Night Out (August 4, 2026) give residents direct access to officers outside of an emergency context. These events are genuinely attended — the open house draws families curious about department operations and gives officers a face outside the patrol car. New residents often find National Night Out their first real introduction to their immediate neighbors.
Transparency Tools
The Edmonds Police Department publishes annual reports and maintains a publicly accessible Community Crime Map through a third-party platform. Before you settle on a specific street or block, pulling up that map and filtering for the past 12 months is one of the most useful 10 minutes you can spend. It shows incident type, location, and date — giving you a real picture rather than a citywide average that might not reflect your particular corner of town.
Washington State's violent crime trajectory is moving in the right direction: murders statewide fell nearly 19% from 2023, per reporting by My Edmonds News on FBI and WASPC data from July 2025. That downward trend at the state level is meaningful context for Edmonds's own numbers.
What to Research Before Choosing a Neighborhood in Edmonds
Citywide crime figures tell you roughly how Edmonds compares to other cities. They don't tell you whether the specific block you're considering is quiet or not. Those are different questions, and both matter.
Use the Community Crime Map First
The Edmonds Police Department's publicly accessible Community Crime Map lets you filter by offense type and date range for specific areas. Pull up the map, drop a pin on the neighborhood you're evaluating, and look at the past 12 months. If you see repeated vehicle break-in incidents on a specific street near the ferry staging area, that's useful information. If a residential block in North Edmonds or Meadowdale shows minimal activity over a year, that's equally informative.
Ask About Esperance Before You Assume
If a listing sits in the Esperance area, confirm whether it falls within Edmonds city limits or in unincorporated Snohomish County. The distinction affects which law enforcement agency responds — city police versus county sheriff — and can affect response times and the specific Block Watch resources available to you. This is one of the more common research gaps for people new to the area.
Check the Block Watch Coverage
Call the Edmonds Police Community Engagement Coordinator at (425) 771-0287 and ask whether the block you're considering has an active Block Watch group. An active group means organized neighbors, established communication channels, and usually a faster informal response to anything suspicious. It's a proxy for neighborhood cohesion that no crime map can fully capture.
Talk to the Neighbors
The community at Rusty Pelican Cafe on 5th Avenue North or the after-dinner crowd at Salt and Iron on Main Street will tell you more about what's actually happening in specific pockets of the city than any database. Edmonds is small enough that locals are specific — they'll name the intersection, describe the pattern, and tell you which blocks they'd avoid and which they'd choose without hesitation. That kind of ground-level intelligence is what separates a confident neighborhood decision from one made purely on spreadsheets.
Weight Violent vs. Property Crime Differently
For most Edmonds neighborhoods, violent crime is a low-probability concern. Property crime — particularly vehicle-related incidents near commercial and transit corridors — is a moderate and manageable one. Calibrate your research accordingly: a neighborhood near the waterfront or the ferry terminal warrants closer property crime scrutiny, while a residential block in North Edmonds or Seaview warrants almost none. They are genuinely different environments within the same city.

Local Expert Takeaway: Edmonds sits in a relatively safe position for a Puget Sound city — violent crime is below both the Washington State and national averages, and most residential neighborhoods away from the downtown core and ferry terminal are genuinely quiet. The honest caveat is property crime: Washington State's elevated baseline means no city in the region gets a free pass, and Edmonds is no exception. The practical move before deciding on a neighborhood is spending time with the Edmonds Police Department's Community Crime Map, filtered to your specific target block over the past 12 months, then calling the Block Watch coordinator to find out whether that block has organized neighbors. The northwest residential sections — North Edmonds, Meadowdale, Seaview — consistently draw the best safety feedback from residents. The downtown Bowl and ferry corridor are where you pay attention to what you leave in your car.
Quick Takeaways & FAQs
✅ Edmonds's violent crime rate of approximately 3 per 1,000 residents falls below both the Washington State average and the U.S. national rate, making it among the safer cities in Snohomish County.
⚠️ Property crime at 30 per 1,000 is the real day-to-day concern, particularly near the ferry terminal and downtown commercial corridor — Washington ranks 3rd worst nationally for property crime, and Edmonds reflects that state reality.
📍 The Edmonds Police Department's publicly accessible Community Crime Map lets you search incident data by neighborhood and date range before committing to a specific block — use it.
Is Edmonds, WA a safe place to live?
What is the property crime rate in Edmonds?
Which Edmonds neighborhoods are the safest?
How does Edmonds compare to nearby cities like Lynnwood for safety?
Does Edmonds have a neighborhood watch program?
Moving to Washington?
Tell us what you need help with and we'll connect you with local resources.
