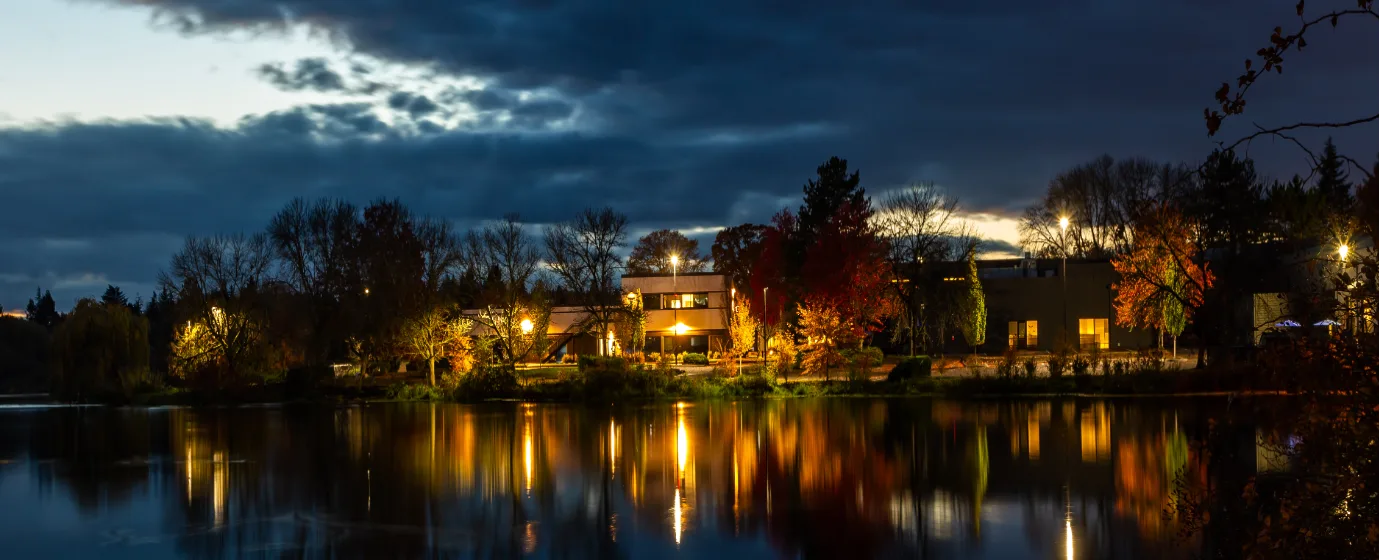
Move to Beaverton from somewhere with higher crime, and the city will feel genuinely calm. Move from a quieter suburb and you might be surprised that the citywide numbers look higher than expected. Both reactions are correct — and both miss the same thing. Beaverton's crime picture is almost entirely a story about where crime happens inside the city, not a uniform condition that applies equally to every street. Understanding that geography is the most useful thing you can do before choosing a neighborhood here.
Beaverton is a city of 97,812 people — the 7th-largest incorporated city in Oregon — and it contains enormous variation. The dense commercial corridor running through the eastern side of the city, anchored by the MAX light-rail transit center and high-traffic retail, generates most of the property crime incidents that push the citywide rate up. The quieter, higher-ownership-rate neighborhoods in the west and southwest barely register by comparison. The aggregate figures are accurate; they just describe the city unevenly.
What the numbers actually show is a city that compares reasonably well against statewide and national benchmarks, has a long-term downward trend on both crime categories, and rewards buyers who take the time to look at neighborhood-level patterns rather than stopping at the headline rate. The Beaverton Police Department has also made meaningful investments in community engagement — from a voluntary security camera registry to a free nine-week Community Academy — that give residents real tools for staying connected to local safety efforts.
This guide breaks down Beaverton's violent and property crime rates against Oregon and national figures, explains the east-west divide that shapes the neighborhood safety picture, walks through which specific areas carry the lowest risk, and covers what the police department is doing at the community level — so you can make a well-grounded decision about where in the city to focus your search.
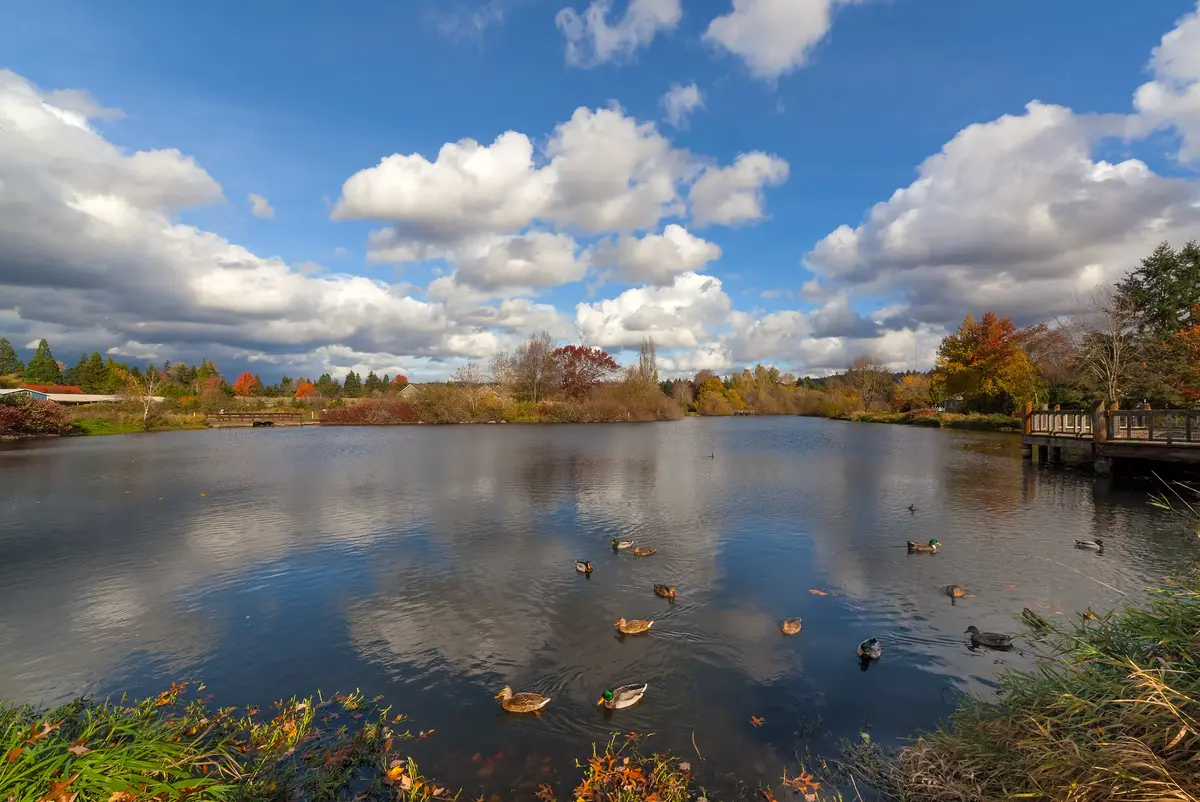
Beaverton Crime Rates vs. Oregon and the Nation
Beaverton carries a violent crime rate of 4 per 1,000 residents and a property crime rate of 26 per 1,000 residents, based on Bureau of Justice Statistics, Crime Known to Law Enforcement, 2024 (tables 2 and 3). Those are the figures that matter for an apples-to-apples comparison — and the comparison is useful context.
Oregon's statewide violent crime rate runs at 3.3 per 1,000 and the national rate sits at 3.7 per 1,000. Beaverton's violent crime rate runs modestly above both those benchmarks — not dramatically, but it is not below them either. On property crime, the statewide figure is 24.5 per 1,000 and the national figure is 18.4 per 1,000. With a property crime rate of 26 per 1,000 residents, Beaverton tracks close to the Oregon average while sitting notably above the national one.
One honest caveat before reading too much into those numbers: different crime-aggregator platforms produce wildly different safety scores for Beaverton, not because of data errors, but because of methodology differences in how raw FBI figures are normalized. Stick with the Bureau of Justice Statistics series for meaningful comparisons — mixing methodologies can make gaps look real when they are really just definitional.
The longer-term trajectory is more encouraging than the snapshot. Local police data indicates both violent and property crime have been declining from their peaks, with 2025 continuing a downward trend from 2019 levels. A city's direction matters as much as its current position.
Finally, context matters across city lines too. Beaverton is generally safer than neighboring Portland, which has historically carried significantly higher violent and property crime rates. That comparison comes up constantly among buyers weighing the two cities, and it is grounded in the same data series — see the full breakdown on the Living in Beaverton page.
The East-West Divide: Where Crime Actually Concentrates
The Geographic Reality
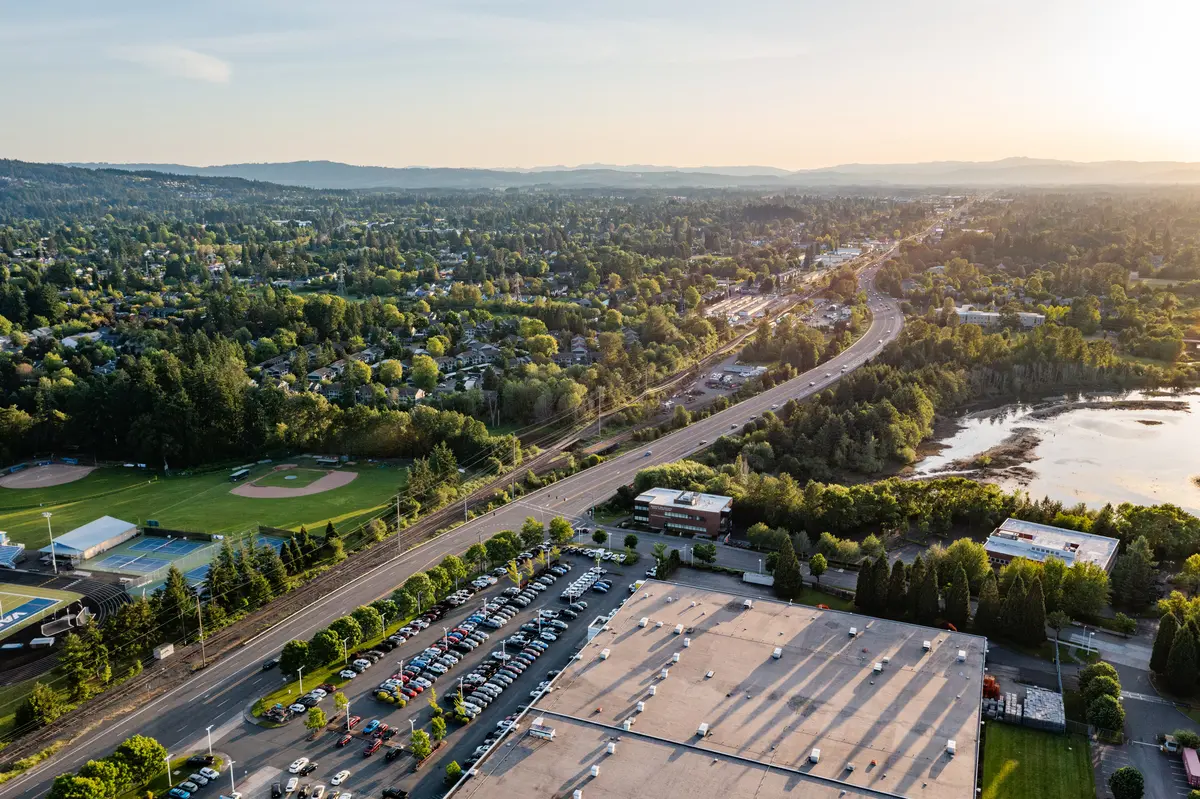
The single most useful thing to understand about safety in Beaverton is that the city is not one place. Crime risk varies sharply by quadrant, and the divide runs roughly along an east-west axis. The retail corridors and transit infrastructure on the eastern side of the city see the most incidents; the residential southwest sees few. That is not a small difference — it is a fundamentally different risk environment within the same city limits.
What drives the east side's numbers is not residential crime — it is the commercial environment. Shoplifting and car break-ins concentrated in high-traffic retail corridors, including the area around the MAX transit center and the denser downtown commercial strip, are the primary source of incidents that push the citywide property crime total upward. Those corridors generate incidents, not the surrounding neighborhoods.
What This Means in Practice
Property crime is the dominant concern in Beaverton, and most of it is opportunistic rather than predatory — vehicle break-ins in busy parking areas, retail theft in commercial zones. Residential neighborhoods well removed from those corridors carry a meaningfully different risk profile than the aggregate suggests.
The practical implication: if you are evaluating a neighborhood, look at its proximity to heavy retail and transit infrastructure as a rough guide. The farther you sit from those corridors, the more the citywide rate overstates your actual exposure. For a deeper look at how neighborhoods differ in character and geography, the best neighborhoods guide covers the full picture.
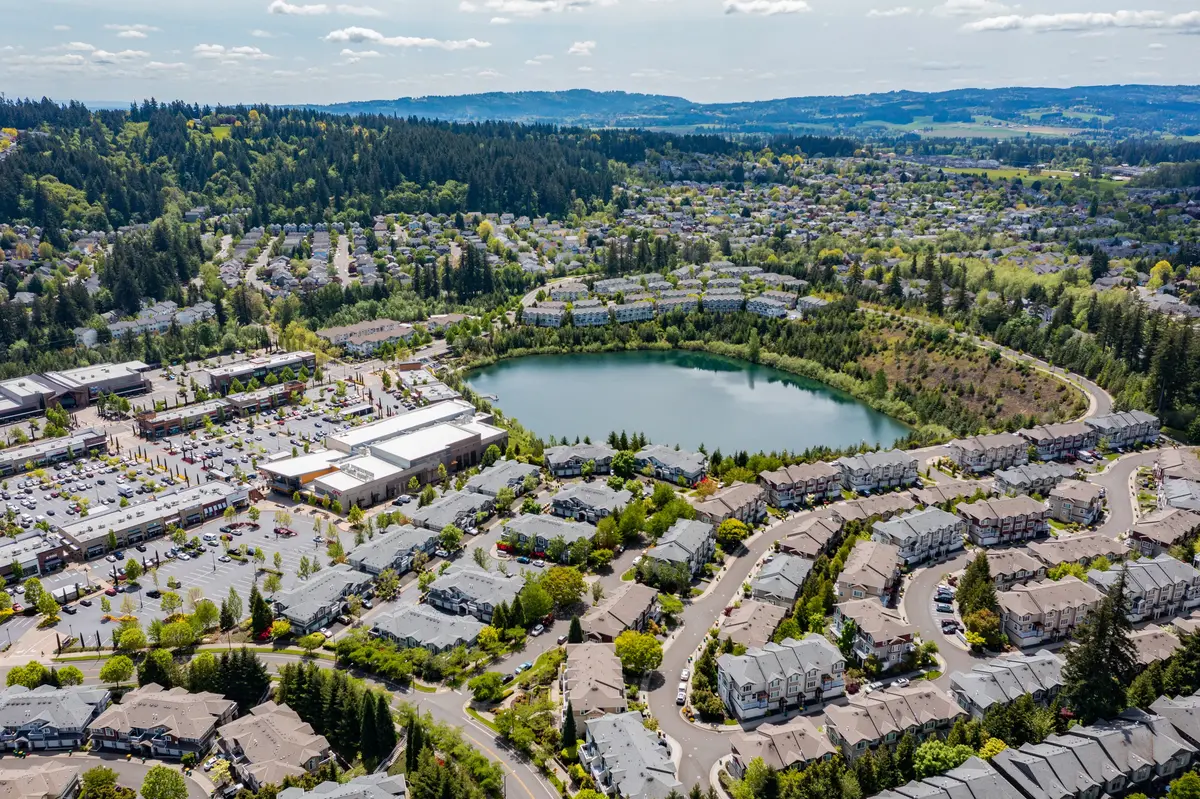
Safest Neighborhoods in Beaverton
Among Beaverton's canonical neighborhoods, the safety picture sorts fairly clearly once you account for the east-west dynamic described above.
| Neighborhood | Safety Profile | Best For |
|---|---|---|
| Cedar Hills | Among the lowest crime rates in the city; established residential streets with low commercial density | Families Quiet |
| Sexton Mountain | Southwest quadrant; fundamentally lower-risk profile than the citywide aggregate; higher ownership rates | Families Privacy |
| Murrayhill | Planned community in the southwest; residential in character; minimal commercial crime generators nearby | Families Quiet |
| Progress Ridge | Mixed-use development but more self-contained retail; lower exposure to the transit-corridor crime pattern | Families Value |
| West Beaverton | Lower incident volume on the west side generally; quieter than the eastern commercial corridor | Families School |
| Five Oaks | More mixed; benefits from the west-side pattern but closer to higher-traffic zones than Cedar Hills | First-Time Buyers Commuters |
| Central Beaverton / Downtown | Highest commercial density; property crime rates here drive much of the citywide aggregate; resident sentiment on walkability is still positive | Walkable Transit |
Cedar Hills and the southwest-quadrant neighborhoods — Sexton Mountain, Murrayhill — represent the clearest gap between what the citywide rate suggests and what residents actually experience. Resident feedback from platforms like Nextdoor consistently cites safety as a defining quality of neighborhoods in the Greenway and South Beaverton areas too, which suggests that even the more urban parts of the city feel safer day-to-day than the aggregate property crime rate might imply.
The point is not that Central Beaverton is dangerous — it is that buyers who want the lowest possible exposure to property crime will find it in the west and southwest, while those who prioritize walkability and access to amenities will make a different compromise in the downtown core.
Looking to buy in Beaverton? Estimate your payment.
Enter your numbers to see an estimated monthly mortgage payment.
Estimate only. Excludes HOA fees and mortgage insurance. The interest rate above is a starting point, not a quoted rate — replace it with your own to see real numbers. Insurance is a flat placeholder, not a Beaverton quote.
What the Beaverton Police Department Is Doing
Reporting and Transparency
The Beaverton Police Department has transitioned crime reporting to the National Incident-Based Reporting System (NIBRS), which captures richer detail per incident than the older Uniform Crime Report summary tallies — including location, time of day, and victim-offender relationships. That transition matters for residents who want to dig into neighborhood-level patterns rather than citywide totals; the BPD publishes crime information by neighborhood on its official website.
Community Programs Worth Knowing
The department runs a voluntary Community Watch Security Camera Registry Program. Residents and businesses register the location of their security cameras, which are mapped for law enforcement use only; officers and detectives may then request video evidence to assist investigations. It is a genuinely practical tool — the kind of community infrastructure that works quietly in the background until someone needs it.
The Community Services Division offers a free Community Academy, a nine-week program that covers how the police department operates — patrol, investigations, dispatch, and community engagement. It is the kind of program that turns skeptical newcomers into informed neighbors, and it tends to shift how people think about the city's safety picture once they understand what the department is actually doing.
The BPD Cadet Program engages young adults ages 15 to 20 in police operations, covering criminal law, traffic law, criminal investigations, and crime prevention. It is both a youth development program and a signal about the department's investment in building community relationships over time, not just responding to incidents after the fact.
A Friction Moment New Residents Don't Expect
What surprises a lot of newcomers after six months in Beaverton is how frequently vehicle break-ins come up in neighborhood conversation — not because they've experienced one, but because someone nearby has, almost always in a parking area adjacent to retail or a transit stop. It is the kind of crime that feels alarming when you hear about it and largely preventable when you understand the pattern: visible valuables in parked cars near commercial centers are the target. Move the bag. The residential streets of Cedar Hills or Sexton Mountain are a different world from the transit-center parking structure.
How to Research Safety Before Choosing a Neighborhood
Use Primary Sources, Not Aggregators
The most common mistake prospective residents make is running a city name through a crime-score aggregator and treating the result as authoritative. Different platforms produce wildly different scores for Beaverton because of methodological differences in how they normalize raw data — not because of disagreements about the underlying facts. The Bureau of Justice Statistics series used throughout this guide is the right baseline for comparing Beaverton against other cities.
For neighborhood-level detail, the BPD's own crime mapping by neighborhood is the right starting point. It gives you actual incident data at a geographic level that city-level rates simply cannot.
What to Actually Look For
When you are evaluating a specific street or block, the most useful filters are proximity to high-traffic commercial corridors, proximity to transit infrastructure, and whether the surrounding blocks are predominantly residential or mixed-use. Those three factors explain the east-west divide in Beaverton better than any neighborhood label does.
Drive the neighborhood at different times of day. Beaverton's busiest retail zones feel noticeably different on a Wednesday evening than on a Saturday afternoon, and that texture tells you something the crime maps can't. The Tualatin Hills Nature Park and Cooper Mountain Nature Park anchor the western and southwestern residential character in ways that are visible on the ground — these are neighborhoods built around parks and quiet streets, not commercial density, and that built environment shapes what daily life feels like in a way that complements the safety data.
What Locals Know
Long-time residents will tell you that Beaverton's reputation for being unsafe is almost entirely a function of how the city's commercial core gets reported — and that most people living in the established residential neighborhoods west of the commercial spine feel no meaningful connection to those numbers. That gap between perception and lived experience is real, and it is worth factoring in when you read a citywide figure and wonder whether it applies to the specific block you are considering.
For a full look at how the neighborhoods compare on character, price, and fit, see the Beaverton neighborhoods guide.
Local Expert Takeaway: Beaverton's property crime rate is real but heavily concentrated in the commercial corridors around the eastern transit center and downtown retail — not in the residential neighborhoods where most families actually live. Cedar Hills and the southwest quadrant, including Sexton Mountain and Murrayhill, consistently post the city's lowest incident counts. If safety is your primary filter, those are the areas to prioritize; the Tualatin Hills Nature Park and Cooper Mountain corridors sit at the heart of exactly the residential character you are looking for.
Quick Takeaways & FAQs
✅ Cedar Hills and the Sexton Mountain area carry some of the lowest crime incident counts in the city, offering a residential experience that looks very different from the citywide aggregate.
⚠️ Beaverton carries a property crime rate of 26 per 1,000 residents — a figure driven largely by retail and transit-corridor incidents rather than residential neighborhoods, which tend to see far fewer.
📍 The Beaverton Police Department publishes crime data by neighborhood on its official website, giving prospective residents a far more granular picture than any citywide rate can provide.
Is Beaverton safe compared to Portland?
Which parts of Beaverton have the lowest crime rates?
What type of crime is most common in Beaverton?
Why do different websites show such different crime scores for Beaverton?
What is the Beaverton Police Department doing to engage the community on safety?
Moving to Oregon?
Tell us what you need help with and we'll connect you with local resources.
