
If you've been researching the North Puget Sound area and Stanwood keeps coming up, the safety question usually follows within a few clicks. Washington State has a reputation — deserved in some cities, overstated in others — for elevated property crime, and that reputation can distort how people perceive smaller towns that simply don't share the same dynamics as Tacoma or parts of Seattle. Stanwood sits about 29 miles north of Everett on Highway 532, flanked by farmland, Puget Sound tideflats, and the bridge to Camano Island. Its 8,373 residents are largely owner-occupants, and that community character shows up clearly in the crime data.
The short answer is yes, Stanwood is safe by virtually any benchmark you apply. FBI data analyzed by NeighborhoodScout puts the city's violent crime rate at 2 per 1,000 residents — a figure that is 79% below the national average. The property crime rate of 13 per 1,000 sits well below both the U.S. norm and, notably, Washington State's own elevated statewide figure. Zero murders were recorded in the most recently reported year. Those aren't marketing numbers; they come from the same federal crime reporting data used by law enforcement agencies and academic researchers nationwide.
Context matters here, because Washington State is genuinely a high-property-crime state compared to the national average. When you hear that property crime is common in Washington, that's a real pattern — concentrated heavily in urban corridors. Stanwood largely sidesteps it. The city's median household income of $90,242 and its predominantly owner-occupant makeup are structural factors that correlate with lower crime rates in peer research, and the numbers bear that out.
This guide breaks down Stanwood's crime figures against national and state benchmarks, looks at how safety varies across the city's distinct neighborhoods, examines the trend line for the region, and gives you the practical tools to research specific streets before you decide on an area.
Stanwood Crime Rates vs. National and State Averages
The Numbers, in Plain Terms
Stanwood's violent crime rate of 2 per 1,000 residents comes from NeighborhoodScout's analysis of FBI 2023 crime data. The national violent crime rate that same year was approximately 3.9 per 1,000, meaning Stanwood runs at roughly half the national rate — and that's before accounting for the fact that Washington State's own violent crime rate of 3.26 per 1,000 in 2024 already sits below the U.S. average.
Property crime is where Washington State earns its reputation, and it's worth being direct about that. The state's 2024 property crime rate of approximately 24.7 per 1,000 is meaningfully higher than the U.S. norm of around 17.6 per 1,000. Stanwood's figure of 13 per 1,000 is well below both — which makes it an outlier in a favorable direction, not a cautionary tale.
| Metric | Stanwood | Washington State (2024) | U.S. Average (2024) |
|---|---|---|---|
| Violent crime rate (per 1,000) | 2.0 | 3.26 | 3.59 |
| Property crime rate (per 1,000) | 13.0 | 24.7 | 17.6 |
| Murders (most recent year) | 0 | — | — |
| Overall crime vs. U.S. average | ~39% lower | Near average | Baseline |
| Violent crime vs. U.S. average | ~79% lower | ~9% lower | Baseline |
| Property crime vs. U.S. average | ~31% lower | ~40% higher | Baseline |
* Sources: NeighborhoodScout / FBI 2023 data (Stanwood city figures); USAFacts / FBI 2024 data (state and national figures). City and state figures draw from different reporting years; use for directional context, not precision comparison.
What Drives the Property Crime That Does Exist
Property crime — theft, vehicle break-ins, burglary — is the primary driver of Stanwood's overall crime picture, not violent incidents. This is true of most small Pacific Northwest towns: the category is real but it's dominated by opportunistic, low-violence events rather than anything that changes the fundamental character of daily life. Leaving valuables visible in a parked car anywhere in the county is the most commonly cited contributor to these numbers, and it's a practice that inflates statistics in otherwise quiet communities.
The Washington State Property Crime Context You Need to Know
Why the State's Reputation Follows Small Towns Unfairly
Washington State's property crime rate is genuinely elevated — roughly 40% above the national average as of 2024 FBI data. That pattern is driven significantly by urban corridors and transit-adjacent commercial zones, not by towns like Stanwood, which sits 29 miles north of Everett with no major interstate running through its downtown core.
The good news embedded in that state-level picture: the trend is improving. The Washington Association of Sheriffs and Police Chiefs 2024 annual report documented a 14.1% drop in overall crime statewide between 2023 and 2024, with property crimes falling 13.4% and violent crimes dropping 7.6%. That's a meaningful year-over-year shift, not a rounding error.
For Stanwood specifically, this matters because the city was already performing well before the statewide improvement. Starting from a lower baseline and moving in the same downward direction puts it in a strong position relative to Washington peers.
What This Means If You're Comparing to Seattle or Everett
If you're weighing Stanwood against a neighborhood in Everett or the north end of Seattle, the gap in property crime exposure is real and substantial. Stanwood's 13 per 1,000 property crime rate is not in the same category as what you'd encounter in commercial or transit-heavy parts of those cities. The comparison isn't even close.
If you're coming from a low-crime suburb in another state — say, a quiet subdivision outside Portland or a small town in Idaho — Stanwood's numbers will feel familiar and reassuring. The profile is that of a stable, owner-occupied small city where the crime that exists is largely minor and property-focused.

How Safety Varies Across Stanwood's Neighborhoods
Stanwood's neighborhoods have distinct characters, and the full neighborhood breakdown covers those differences in detail. From a safety perspective, a few patterns are worth noting up front.
Downtown Stanwood and the Historic Core
The historic brick-road downtown district — centered along 270th Street NW — is the city's commercial and civic heart. Like most small-town downtowns, it sees the most foot traffic and, by extension, the highest concentration of minor property incidents. This isn't a reason to avoid it; it's simply where parked cars are most visible and where opportunistic theft is most likely to occur. The area around Heritage Park and Old Stanwood train depot stays active during daytime hours and feels genuinely walkable.
East Stanwood and Cedarhome
East Stanwood sits along Highway 532 and has a more suburban, spread-out character than the historic west side. Cedarhome, just to the southeast, blends into rural Snohomish County and is characterized by larger parcels and fewer commercial nodes. Both areas tend toward quieter residential patterns, with property crime rates that feel more consistent with what you'd expect from a low-density neighborhood — infrequent and largely isolated to vehicle break-ins when they do occur.
Lake Goodwin, McKees Beach, and Warm Beach
These waterfront and near-waterfront communities sit at the edges of Stanwood's boundaries, blending into unincorporated Snohomish County. Their semi-rural character — larger lots, less through-traffic, neighbors who tend to know each other by name — creates conditions that correlate with lower property crime exposure. Seasonal recreational activity around Lake Goodwin picks up noticeably in summer, which brings more unfamiliar traffic through the area, but locals report it rarely translates into safety concerns.
Pioneer Hills and Jasper Junction
Pioneer Hills is one of Stanwood's more established residential areas, with consistent single-family housing and a neighborhood feel that longtime residents describe as stable and predictable. Jasper Junction, a newer development area, attracts families who want access to Stanwood's community without the older housing stock of the downtown core. Both neighborhoods sit within the same low-incident pattern that characterizes most of Stanwood's residential footprint.
| Neighborhood | General Character | Primary Safety Note | Best For |
|---|---|---|---|
| Downtown Stanwood (West) | Historic commercial core, walkable streets | Highest foot traffic; minor property incidents most likely here | Walkable |
| East Stanwood | Suburban, Highway 532 corridor | Quiet residential; vehicle break-ins occasional | Commuter |
| Cedarhome | Semi-rural, larger parcels | Low density, infrequent incidents | Privacy |
| Pioneer Hills | Established single-family residential | Stable, predictable crime pattern | Families |
| Jasper Junction | Newer development, family-oriented | Low incident history, active neighborhood culture | Families First-Time |
| Lake Goodwin | Waterfront / near-waterfront | Seasonal traffic increase in summer; generally quiet | Nature Quiet |
| McKees Beach | Waterfront, semi-rural | Low through-traffic; neighbor familiarity high | Views Quiet |
| Warm Beach | Coastal, lower density | Rural character; incidents rare and isolated | Nature |
Looking to buy in Stanwood? Estimate your payment.
Enter your numbers to see an estimated monthly mortgage payment.
Estimate only. Excludes HOA fees and mortgage insurance. The interest rate above is a starting point, not a quoted rate — replace it with your own to see real numbers. Insurance is a flat placeholder, not a Stanwood quote.
What Locals Know About Day-to-Day Safety in Stanwood
The Real Texture of Living Here
Six months in, newcomers to Stanwood often notice the same thing: the absence of the low-grade urban vigilance they carried over from wherever they moved from. You stop checking your car twice before walking away from it downtown. You leave a kayak paddle in the bed of your truck overnight without a second thought. Nobody warned them to expect that.
That's not naivety — it's what the numbers actually describe. A violent crime rate of 2 per 1,000 in a city of 8,373 people translates to roughly 16 to 17 violent incidents per year across the entire city. Most residents go years without any direct experience of crime in their immediate neighborhood.
Where the Community Actually Gathers
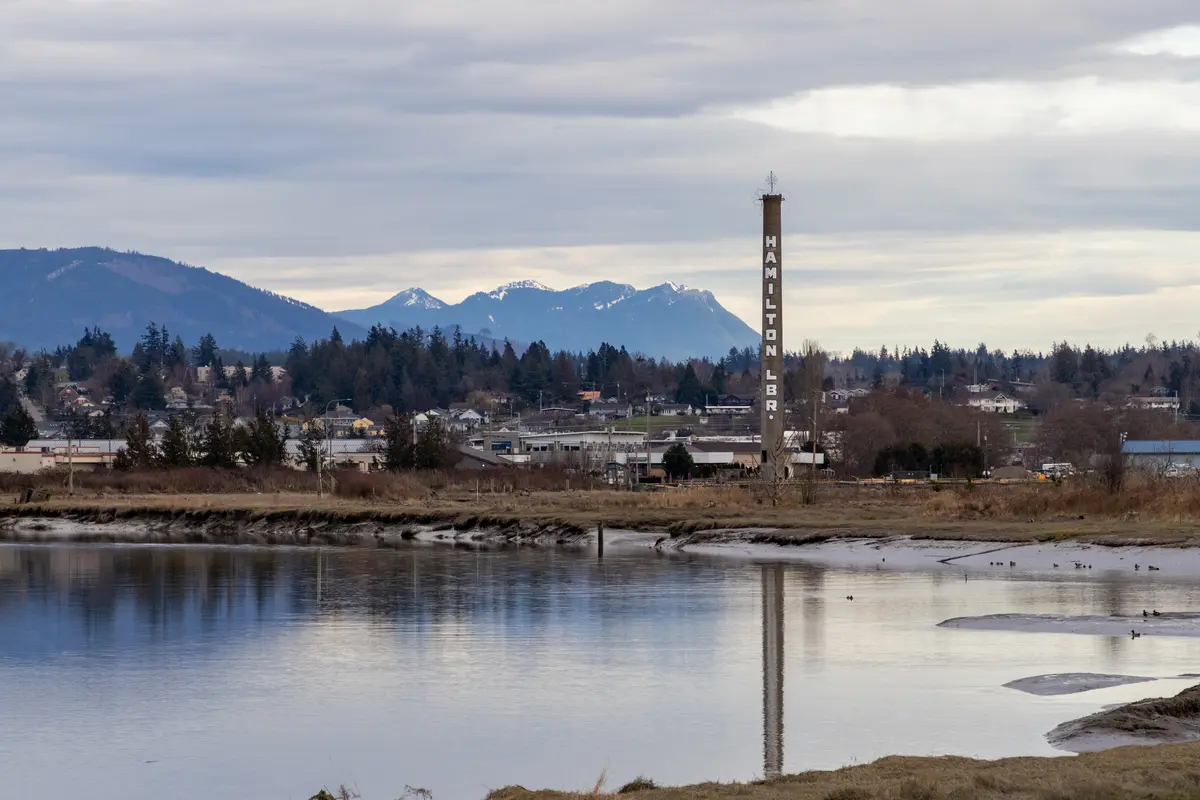
Stanwood's informal social infrastructure is part of what sustains its safety profile. The kind of breakfast spot where regulars know each other and new faces get introduced — along 72nd Ave NW — embodies a community that hasn't lost its small-town connective tissue. Dinner spots on 102nd Ave NW draw the after-work crowd from surrounding neighborhoods and create the kind of informal accountability that makes a place feel watched over, in the best sense. Hamilton Landing Park, where locals walk dogs and kids do what kids do, operates as an informal neighborhood anchor on the water's edge.
The Seasonal Reality
Warm Beach and Lake Goodwin see a distinct personality shift every summer. Vacation rentals fill, boat trailers clog the access roads on weekends, and the overall density of unfamiliar faces increases noticeably from Memorial Day through Labor Day. Local residents generally regard this as a minor inconvenience rather than a safety concern, but it's worth knowing if you're evaluating those specific areas. The off-season — October through April — restores the quiet that most year-round residents moved there for in the first place.
Why People Move Out — The Honest Version
People who leave Stanwood rarely cite safety as the reason. The friction points that push families out tend to be the distance to major retail (no Trader Joe's or Costco within the city limits — you're driving to Marysville or Mount Vernon for that), the limited professional job base directly in town, and the stretch of Highway 532 that becomes genuinely congested during peak hours. Safety is almost never in the conversation.
How to Research Safety Before Choosing a Specific Street
Go Beyond the City-Level Number
City-wide crime rates tell you the average, not the specific. Stanwood's figures are favorable across the board, but if you're weighing two different streets — one closer to the Highway 532 commercial corridor, one in an established residential pocket — the micro-level picture matters. A few tools give you that granularity without requiring a law enforcement contact.
The Snohomish County Sheriff's Office publishes incident-level data and maintains a community crime mapping tool. Because parts of the Stanwood area, particularly toward Lake Goodwin and Warm Beach, sit in unincorporated county territory rather than within Stanwood's city limits, the sheriff's data is often more relevant than the city-level figures for those locations specifically.
Tools Worth Bookmarking
- NeighborhoodScout — the source for the FBI 2023 figures cited throughout this guide. Allows city-to-city comparison and gives a breakdown of crime categories.
- AreaVibes — uses the FBI 2024 dataset (slightly different methodology than NeighborhoodScout) and provides a livability score that incorporates crime alongside other quality-of-life factors.
- Snohomish County Sheriff's Office crime mapping — incident-level data searchable by address and date range. Most useful for unincorporated areas near Stanwood's edges.
- Washington Association of Sheriffs and Police Chiefs (WASPC) — publishes the annual statewide Crime in Washington report, which gives you the state trend line for context.
What to Look for When You Visit
Drive the specific streets you're considering at different times of day. The difference between a Wednesday afternoon and a Friday evening near the Highway 532 corridor is real. Notice the maintenance level of neighboring properties — deferred maintenance on multiple adjacent parcels is a more reliable ground-level signal than any aggregate statistic. Talk to the people you encounter at a downtown breakfast spot or at Heritage Park; Stanwood is small enough that those conversations are genuine information, not small talk.
Pay attention to how long homes sit on the market in the specific area you're evaluating, too. In neighborhoods where residents feel settled and secure, turnover is lower — and that stability itself is a safety signal. The best neighborhoods guide for Stanwood covers each area's character in detail if you want to dig deeper before narrowing your search.
One Thing Worth Knowing About the Data
Small cities produce small sample sizes. A violent crime rate of 2 per 1,000 in a city of 8,373 people means the underlying incident count is small enough that a single unusual year can move the rate meaningfully in either direction. This cuts both ways: don't panic if a single year's figures tick up slightly, and don't assume a single good year means a structural improvement. The multi-year trend and the comparison to peer communities is a more reliable signal than any single year's number.

Local Expert Takeaway: Stanwood's violent crime rate of 2 per 1,000 — 79% below the national average — isn't a marketing figure; it comes directly from FBI crime data and it reflects a real, structural reality about this community. Property crime exists, as it does everywhere in the Pacific Northwest, but Stanwood's rate of 13 per 1,000 sits well below both the U.S. norm and Washington State's own elevated benchmark. The neighborhoods farthest from the Highway 532 commercial strip — Pioneer Hills, Lake Goodwin, Warm Beach — tend to produce the quietest day-to-day experience. If you want to ground-truth any of this before deciding on a specific area, an hour at a downtown breakfast counter or an evening at Hamilton Landing Park will tell you more about the community's character than any spreadsheet can.
Quick Takeaways & FAQs
✅ Stanwood's violent crime rate runs 79% below the national average, placing it among the safer small cities in the Pacific Northwest by FBI data.
⚠️ Property crime is the primary driver of Stanwood's overall crime picture — not violent incidents — and even that figure sits well below Washington State's own elevated statewide rate.
📍 The waterfront and rural-edge neighborhoods (Warm Beach, Lake Goodwin, McKees Beach) see a notable seasonal uptick in unfamiliar traffic each summer; the off-season quiet that year-round residents value most returns reliably every October.
What is Stanwood, WA's crime rate compared to the national average?
Is property crime a real concern in Stanwood?
How does Stanwood's safety compare to nearby cities like Marysville or Arlington?
Which Stanwood neighborhoods are considered the safest?
Is Washington State's high property crime rate a reason to be cautious about moving to Stanwood?
Moving to Washington?
Tell us what you need help with and we'll connect you with local resources.
