
Washington State has a property crime problem. In 2024, the state ranked 3rd worst nationally for property crime — a fact that gives anyone researching Pacific Northwest towns legitimate pause. Duvall sits inside that same state and yet posts numbers that look like they belong to a different conversation entirely. A violent crime rate of 1 per 1,000 residents and a property crime rate of 5.58 per 1,000 are not just good for Washington — they are well below what most American cities of any size can claim. That contrast is the first thing you need to understand before reading anything else on this page.
Duvall is a small city of roughly 9,176 people tucked into the Snoqualmie Valley along the SR-203 corridor, about 35 minutes northeast of Redmond. It has grown nearly 99% since 2000, driven largely by tech-sector workers at Microsoft and Amazon who want acreage and a slower pace without abandoning the commute entirely. That growth brought investment in the Main Street NE corridor, added density to areas like McCormick Park and Legacy Ridge, and pushed the police department to expand community programming — all without the crime spike that typically accompanies rapid population growth.
The safety picture here matters in a specific way: Duvall's low crime rate is not just a statistic to feel good about. It is one of the most concrete reasons people choose this city over comparably priced towns closer to Seattle, and it shapes everything from how residents use Depot Park in the evenings to whether people leave their garage doors open on a Sunday morning. Understanding where those numbers come from — and what they do and don't tell you about specific parts of town — is the purpose of this guide.
The sections below break down Duvall's violent and property crime figures against state and national benchmarks, explain what the trend line looks like over recent years, walk through how the police department operates at the community level, and show you how to do your own street-level research before settling on a neighborhood.
Duvall's Crime Numbers vs. State and National Averages
The single most useful frame for Duvall's safety data is the Washington State comparison, not the national one — because Washington is where the real contrast lives.
The state's 2024 property crime rate of 24.67 per 1,000 ranked 3rd worst in the country (USAFacts / FBI data, updated June 2026). Duvall's rate of 5.58 per 1,000 sits far below that figure. For violent crime, Washington came in at approximately 3.26–3.31 per 1,000 in 2024; Duvall's rate of 1 per 1,000 is well below the state average.
At a Glance: Duvall vs. Benchmarks
| Geography | Violent Crime (per 1,000) | Property Crime (per 1,000) | Relative to Duvall |
|---|---|---|---|
| Duvall, WA | 1.00 | 5.58 | — |
| Washington State (2024) | 3.26–3.31 | 24.67 | Much higher |
| U.S. National (2024) | 3.59 | 17.60 | Higher |
| King County (suburban avg.) | Varies by city | Varies by city | Generally higher |
| Monroe, WA (nearby) | Higher than Duvall | Higher than Duvall | Noticeably higher |
| Woodinville, WA (nearby) | Comparable range | Comparable range | Similar tier |
NeighborhoodScout, using 2024 FBI crime data released in October 2025, rates Duvall as safer than 69% of U.S. cities and towns, and safer than 83% of Washington communities specifically.
That last figure — 83% of Washington communities — is the one worth holding onto. It means that within the state where you're most exposed to elevated property crime, Duvall is a clear outlier on the safer end.
The combined odds of being a crime victim here are approximately 1 in 218, compared to a national average of 1 in 47. Put differently: living in Duvall puts your statistical risk at roughly one-fifth the national baseline.
What the Numbers Look Like in Raw Terms
Statistics per 1,000 residents can feel abstract for a city this size. The raw counts make the picture more concrete.
In 2023 — the most recent full calendar year with FBI-verified figures — Areavibes recorded 5 total violent crimes in Duvall. Five. For a city of more than 9,000 people, that is a count, not a rate. Property crimes for the same year came to 49 incidents total, translating to 558 per 100,000 residents, or 84.6% and 71.4% below national averages respectively (Areavibes / FBI UCR, released September 2024).
City-Data.com's analysis of the same period produced a crime index of 32 for Duvall — described as 7.6 times smaller than the U.S. average. That same source notes a five-year trend of decreasing violent crime and declining property crime in the city (City-Data.com, updated February 2025).
Trend Direction Matters as Much as the Snapshot
A low rate that is rising deserves more concern than a moderate rate that is falling. Duvall's trajectory runs in the right direction on both counts. Washington State overall saw its crime rate drop 11.6% from 2023 to 2024, with violent crime specifically falling 6.2% year-over-year — and Duvall's own five-year trend mirrors that downward arc rather than bucking it.
The takeaway: these are not numbers that spiked down one year. They reflect a multi-year pattern in a community that has been growing rapidly, which makes the stability more meaningful than it would be in a static, shrinking town.
What Crime Looks Like Day-to-Day in Duvall
Most newcomers arrive expecting Duvall to feel like a small town and are surprised to discover it actually does. That experience has a data explanation.
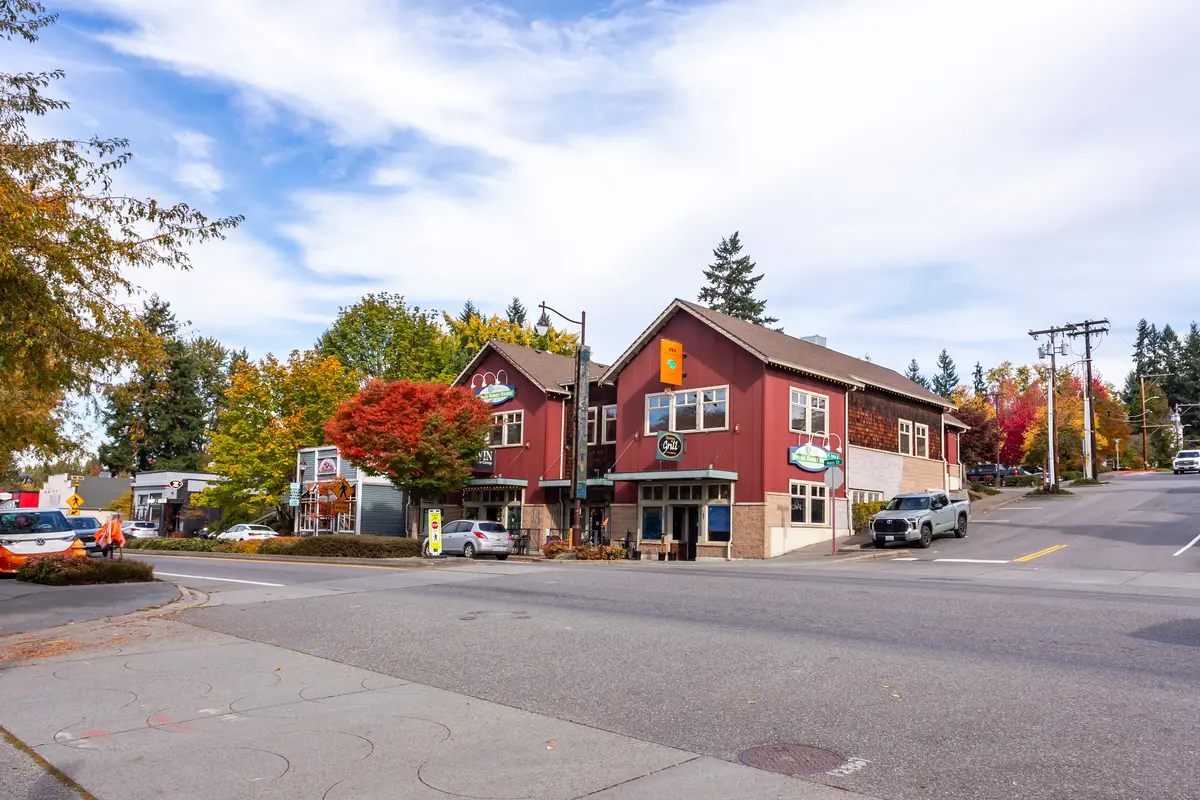
With only 49 property crimes recorded across an entire year, the most common incidents are things like package theft from doorsteps and the occasional vehicle break-in near the Main Street NE commercial strip. Crimes of opportunity tied to visible valuables in parked cars show up in the Duvall Police Department's CrimeMapping.com data more reliably than anything involving confrontation or forced entry into homes.
Where to Check Before Settling on a Neighborhood
The police department maintains a public interactive crime mapping tool through CrimeMapping.com, accessible directly from the city's website at duvallwa.gov. You can filter by date range, crime type, and distance from any specific address — which means you can pull a six-month picture of the block you're considering in any of Duvall's neighborhoods, from the downtown core along Main Street NE to Taylor's Landing to Riverbend, before you decide on an area.
That tool is genuinely useful and underused by people researching the city from outside. Running it for the downtown area along Main Street NE will typically show the highest concentration of incidents simply because that corridor has the most foot traffic, parked vehicles, and commercial activity. The McCormick Park area and established residential pockets like Cherry Valley and Legacy Ridge tend to be quieter by comparison — though the raw numbers across all areas are low enough that the differences are often a matter of a handful of incidents.
What Six Months Here Teaches You
People who move to Duvall from denser suburbs closer to Seattle often share the same observation around month three: they stop locking their car in the driveway. Not because Duvall is crime-free — it isn't — but because the daily friction of urban-adjacent threat fatigue simply isn't present here. That psychological shift is real, and the data backs it up. The catch that surprises some residents is that package theft has followed e-commerce growth even to small towns, so visible deliveries on a porch in any neighborhood are worth managing, particularly during the holiday season when the CrimeMapping tool tends to show a small seasonal uptick.
Looking to buy in Duvall? Estimate your payment.
Enter your numbers to see an estimated monthly mortgage payment.
Estimate only. Excludes HOA fees and mortgage insurance. The interest rate above is a starting point, not a quoted rate — replace it with your own to see real numbers. Insurance is a flat placeholder, not a Duvall quote.
How the Duvall Police Department Operates
For a city under 10,000 people, Duvall's police department runs a notably community-forward model — one that is worth understanding because it shapes how safety actually functions here, not just how it's measured.
The department offers free home security checks, a proactive service where an officer assesses your property's vulnerabilities and makes recommendations before anything happens. That is not standard in similarly sized cities. Victim follow-up is also built into their operating model rather than treated as optional, which matters for property crime resolution even when that resolution is primarily about documentation and insurance.
Community Programs Worth Knowing
National Night Out in Duvall falls on the first Tuesday of every August and draws a strong turnout for a city this size — it's one of the cleaner ways to get a read on how neighbors interact and how visible the department is in different parts of town. The event effectively maps community cohesion as much as it does police presence.
The department also offers R.A.D. (Rape Aggression Defense) training for women at no cost. It is a practical self-defense and awareness curriculum, and its availability through the police department rather than a third-party provider reflects the kind of direct community service orientation that tends to correlate with lower crime environments — not as cause and effect, but as a common indicator of how seriously a small-city department takes prevention over response.
The Small-City Dynamic
Departments this size know the community in a way that larger agencies structurally cannot. Officers regularly interact with residents at local cafés and coffee spots along Main Street NE — the familiarity is not a talking point, it's a function of geography. The downside is equally real: response times for lower-priority calls can stretch longer than residents accustomed to dense suburban coverage expect, and specialty units that larger agencies maintain don't exist here at the same depth.
How to Research Safety for a Specific Street or Area
City-wide averages tell you the broad story. Street-level research tells you whether the specific block you're considering matches that story or is an exception to it.
The most direct tool is the Duvall Police Department's CrimeMapping.com portal, linked from duvallwa.gov. Set a radius of a quarter mile around any address and pull the last six months of data. Filter for property crime specifically — that is where virtually all of Duvall's incident volume lives — and look at the pattern by incident type rather than total count. Clusters near a specific parking area or a commercial loading zone mean something different than isolated incidents scattered across a residential grid.
Secondary Research Layers
NeighborhoodScout's city profile for Duvall breaks down crime risk by neighborhood segment within the city. It is not a substitute for the live CrimeMapping tool, but it provides a useful baseline orientation before you dig into address-level detail. Areavibes and City-Data.com offer additional historical context, particularly for trend comparison across years.
One thing none of these tools captures well: the social environment of a specific street. Whether neighbors know each other, whether there's ambient activity in the evenings, whether the block has strong or weak informal surveillance — these are things you learn by visiting at different times of day. Depot Park and the Snoqualmie Valley Trail corridor draw consistent foot traffic that keeps the area naturally active, which tends to suppress opportunistic crime. Quieter cul-de-sacs in the newer subdivisions on the west side of the city can feel more isolated after dark even if their raw crime numbers are just as low.
The Honest Limitation
Duvall's numbers are genuinely good. But they reflect reported crime in a small city where some incidents — particularly minor property theft — go unreported because residents calculate that the process isn't worth it for a small loss. That's not a Duvall-specific problem; it's a universal feature of small-city crime data. The practical implication is that the actual experience of petty property crime may be modestly higher than reported figures suggest, while the violent crime picture is almost certainly accurately represented by the data.
Local Expert Takeaway: Duvall is one of the safer places you can live within commuting range of Seattle or Redmond — not by a small margin, but by a wide one. The violent crime rate of 1 per 1,000 is well below both the Washington State and national averages, and a five-year downward trend on both violent and property crime holds even as the city has nearly doubled its population since 2000. The practical experience matches the numbers: residents walk to Depot Park in the evening without hesitation, and the police department's proactive home security checks and active community programs reflect a department that takes prevention seriously. The one area to stay realistic about is petty property crime — package theft and car break-ins near the Main Street NE corridor are the incidents that actually show up in the data — and the CrimeMapping.com tool the city hosts publicly is the fastest way to check any specific address before you commit to a neighborhood.
Quick Takeaways & FAQs
✅ Duvall's violent crime rate of 1 per 1,000 residents places it safer than 83% of Washington communities — a meaningful outlier in a state that ranks among the worst nationally for property crime.
⚠️ Property crime along the Main Street NE commercial corridor sees the city's highest concentration of incidents, primarily package theft and vehicle break-ins; it's the one area where locking your car still matters.
📍 The Duvall Police Department's public CrimeMapping.com portal lets you pull up to six months of incident data filtered by address and crime type — use it to check any specific street before settling on a neighborhood.
What is Duvall WA's violent crime rate?
How does Duvall's crime rate compare to the rest of Washington State?
What types of crime are most common in Duvall?
Is crime in Duvall getting better or worse?
How can I check crime data for a specific street or neighborhood in Duvall?
Moving to Washington?
Tell us what you need help with and we'll connect you with local resources.
