People who move to Allen from larger Texas cities — Dallas, Fort Worth, even Plano — often say the same thing after a few months: it feels noticeably quieter than they expected for a city of 113,447 people. That instinct is backed by the numbers. Allen carries a violent crime rate of 1.1 per 1,000 residents, which is a fraction of both the Texas state rate of 4 per 1,000 and the national rate of 3.7 per 1,000. That gap is not rounding error. It reflects something structural about how the city was built, how it is policed, and who has chosen to live here.
Allen sits in Collin County, northeast of Dallas, served by US-75 and the Sam Rayburn Tollway. It is the 38th-largest incorporated city in Texas, and its growth over the past two decades has been driven by families drawn to the Allen Independent School District — which holds an A rating, according to the Texas Education Agency — and to the kind of master-planned, suburban infrastructure that keeps streets organized and neighborhoods coherent. The median household income of $130,901 reflects a community that skews toward dual-income professional households, and that income level correlates strongly with lower crime rates in cities across the country.
The property crime picture is also well below the norm. Allen carries a property crime rate of 8.8 per 1,000 residents, compared to the Texas state figure of 20.7 per 1,000 and the national figure of 18.4 per 1,000 — meaning property crime here runs at less than half the state average. No city is crime-free, and Allen's retail corridors near Allen Premium Outlets and the Sam Rayburn Tollway see the bulk of what does occur. But the residential neighborhoods, on the whole, are among the calmer in the Dallas-Fort Worth metroplex. For a full picture of what life here actually looks like day to day — neighborhoods, commute, costs — the sections below cover Allen's safety data, neighborhood-level character, how the police department operates, and what residents who live here say about it in practice.
Allen Crime Rates vs. Texas and the Nation
The table below places Allen's crime rates against Texas state averages and national benchmarks. The gap is wide enough that it warrants some explanation, not just a table.
Allen carries a violent crime rate of 1.1 per 1,000 residents — less than a third of the state rate and well below the national figure. Allen carries a property crime rate of 8.8 per 1,000 residents, running at roughly 43% of the Texas average. Those are meaningful differences, not statistical noise driven by reporting quirks.
Why the Numbers Look the Way They Do
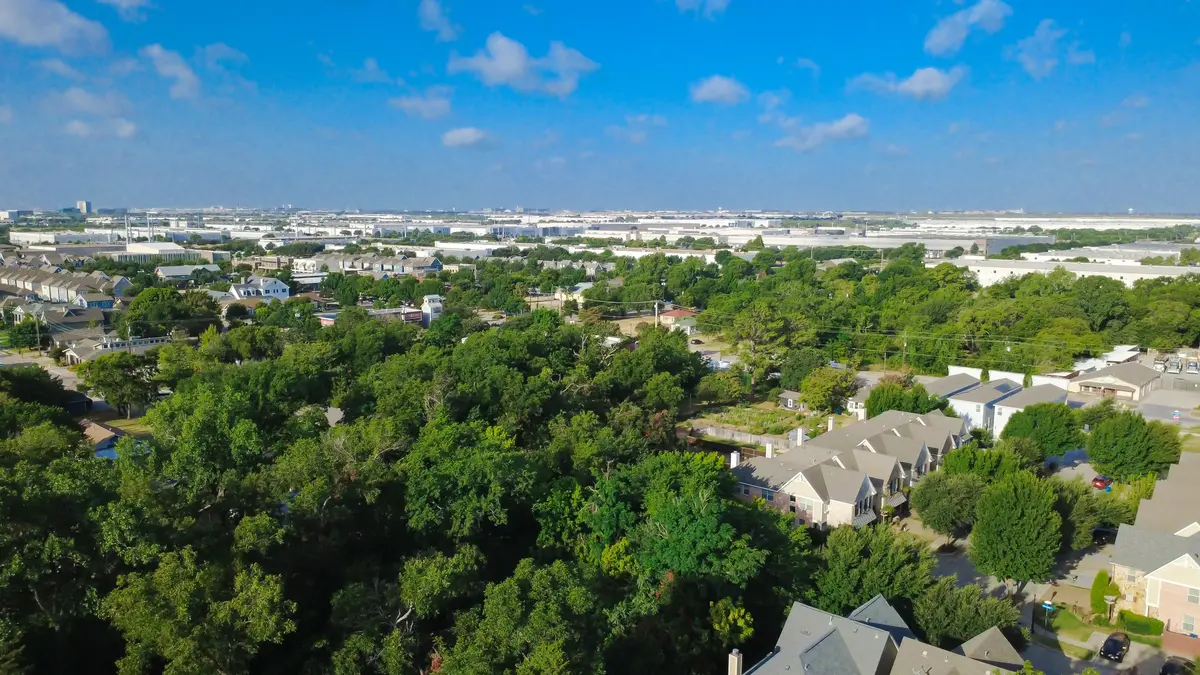
Part of the answer is demographic: a high-income, high-homeownership suburban city with good schools tends to have lower crime rates almost everywhere in the country. Part of it is structural: Allen's neighborhoods are largely composed of planned subdivisions with defined street networks that limit cut-through traffic, which reduces opportunistic property crime.
The Allen Police Department reported that total crime dropped 22.6% in 2025 — giving the city the lowest crime rate per capita, at 7.59 offenses per 1,000 residents, among Texas municipalities with populations over 80,000, according to Police Chief Steve Dye's report to Allen City Council. That improvement was not accidental. The department credits targeted patrol strategies, evidence-based policing site visits in retail centers, and data-driven resource deployment. Violent crime specifically declined 36.4% in 2025, with notable reductions in aggravated assault and sexual assault cases.
Motor vehicle theft dropped 59% in the same period — a particularly sharp decline in a category that had been climbing nationally. Burglary fell 17.1%.
One Incident Worth Naming
Any honest safety guide for Allen has to acknowledge the May 2023 mass shooting at Allen Premium Outlets, which killed eight people and injured several others. It was a tragedy that shook the city and drew national attention. It was also, statistically, an outlier in a city where violent crime is rare. The Outlets have since reopened, the city has continued to attract new residents at a steady pace, and the crime data for subsequent years reflects no lasting spike. That does not diminish what happened — it is simply the factual record.
Neighborhood Safety Character Across Allen
City-wide averages only tell part of the story. In Allen's case, the neighborhood-level picture is unusually consistent — which is itself worth knowing.
The residential southwest and mid-city neighborhoods see very few incidents. The retail corridors in the northern part of the city, particularly around Allen Premium Outlets and the Sam Rayburn Tollway commercial strip, account for the majority of what does occur. That geographic concentration matters more than the city-wide average when you are choosing a specific street.
| Neighborhood | Character | Safety Notes | Best For |
|---|---|---|---|
| Twin Creeks | Established golf-course community, mature trees, winding streets | Low through-traffic; active community association; residential calm consistent with the city's best-performing areas | Families Quiet |
| Watters Crossing | Planned community near Watters Creek; limited entry points, looping interior streets | Street layout structurally reduces external traffic; among the calmer residential pockets in the city | Families Walkable |
| Starcreek | Newer construction, HOA-managed, near the Sam Rayburn Tollway | Well-lit streets, active HOA; consistent with the city's low residential crime profile | Families Commuter |
| Montgomery Farm / Park at Montgomery Farm | Mixed residential and retail adjacency near Watters Creek at Montgomery Farm | Generally calm residential streets; retail proximity means occasional property crime nearby | Walkable Commuter |
| Suncreek | Mid-city location, established subdivision feel | Consistent with city-wide low crime profile; well-established neighborhood watch culture | Families Value |
| Shaddock Park | Newer development, quiet cul-de-sac streets | Planned street layout limits cut-through traffic; low incident history | Families Quiet |
| Lost Creek Ranch | More affordable entry into Allen; slightly more mixed street exposure | Consistent with city average; sits below the city's typical home price | First-Time Value |
| Ridgeview Crossing | Established neighborhood with good school proximity | Aligns with the broader Allen safety profile; strong community engagement | Families School |
The consistent finding across neighborhoods is that Allen's residential areas — regardless of price tier — share the same basic safety profile. For more on how these neighborhoods compare on character and housing stock, see the Allen neighborhoods guide.
Where Crime Is Most Concentrated
Property crime in Allen clusters near commercial corridors — particularly around Allen Premium Outlets and the retail concentration along the Sam Rayburn Tollway. Shoplifting, vehicle break-ins in parking lots, and occasional retail theft drive the bulk of what the department handles. If you are choosing between neighborhoods and one sits closer to a major retail strip, that proximity matters slightly more for property crime than for anything else — though even there, the rates remain well below the state average.

How Allen Polices Its Streets
The Allen Police Department has grown steadily over the past decade, tracking the city's population growth rather than lagging behind it. That staffing trajectory is part of why response times and patrol coverage have remained consistent even as the city expanded.
A New Headquarters
Allen broke ground in February 2025 on a $97.1 million police headquarters near City Hall. The 103,000-square-foot, three-story facility was funded by a 2023 voter-approved bond and federal grants and was under construction as of mid-2025, designed to house administration, investigations, training, emergency dispatch, a community room, an expanded crime scene lab, and an officer wellness center. That voters passed a nearly $100 million bond for police infrastructure says something about the community's commitment to maintaining what it already has.
Traffic Enforcement as a Safety Tool
Officers conducted 49,622 traffic stops in 2025, up from 35,444 the prior year. That increase is intentional — the department views traffic enforcement as a direct tool for reducing dangerous driving behaviors, which is one of the more under-discussed dimensions of suburban safety. Fast roads and distracted driving cause more harm in communities like Allen than the crime statistics alone would suggest.
Volunteer Infrastructure
The department's Citizens on Patrol program has run for 25 years, logging 96,000 volunteer hours in that time. Those programs put trained community members on neighborhood streets and in civilian support roles, extending the department's reach without requiring full officer deployment. In practice, it also means residents in most Allen neighborhoods know someone connected to the program, which changes how the community relates to public safety.
Looking to buy in Allen? Estimate your payment.
Enter your numbers to see an estimated monthly mortgage payment.
Estimate only. Excludes HOA fees and mortgage insurance. The interest rate above is a starting point, not a quoted rate — replace it with your own to see real numbers. Insurance is a flat placeholder, not a Allen quote.
What Residents Experience Day to Day
Allen has placed among the top small cities nationally in safety-focused quality-of-life studies, and that aligns with what residents typically report: Allen feels safe in the way that becomes background noise after a few months — you stop thinking about it because there is rarely a reason to.
The Friction Point Nobody Mentions Before You Move
What surprises some newcomers is how much the perception of safety is tied to which part of Allen you are in. The residential neighborhoods — Twin Creeks, Watters Crossing, Starcreek, Suncreek — are genuinely calm. The stretch near Allen Premium Outlets and the commercial concentration along the Sam Rayburn Tollway is a different environment, not unsafe in any alarming sense, but busier and more exposed to the opportunistic property crime that comes with high retail traffic. Buyers who research crime statistics without understanding this geographic distinction sometimes end up surprised.
Watters Crossing is a useful example of how street layout affects the feel of a place. Its limited main entrances and looping interior streets do not connect directly to external traffic, which keeps non-residents from cutting through. That is a structural choice that reduces exposure, and it is one reason the neighborhood consistently earns strong safety reviews independent of the city-wide data.
Parks as Safe Civic Space
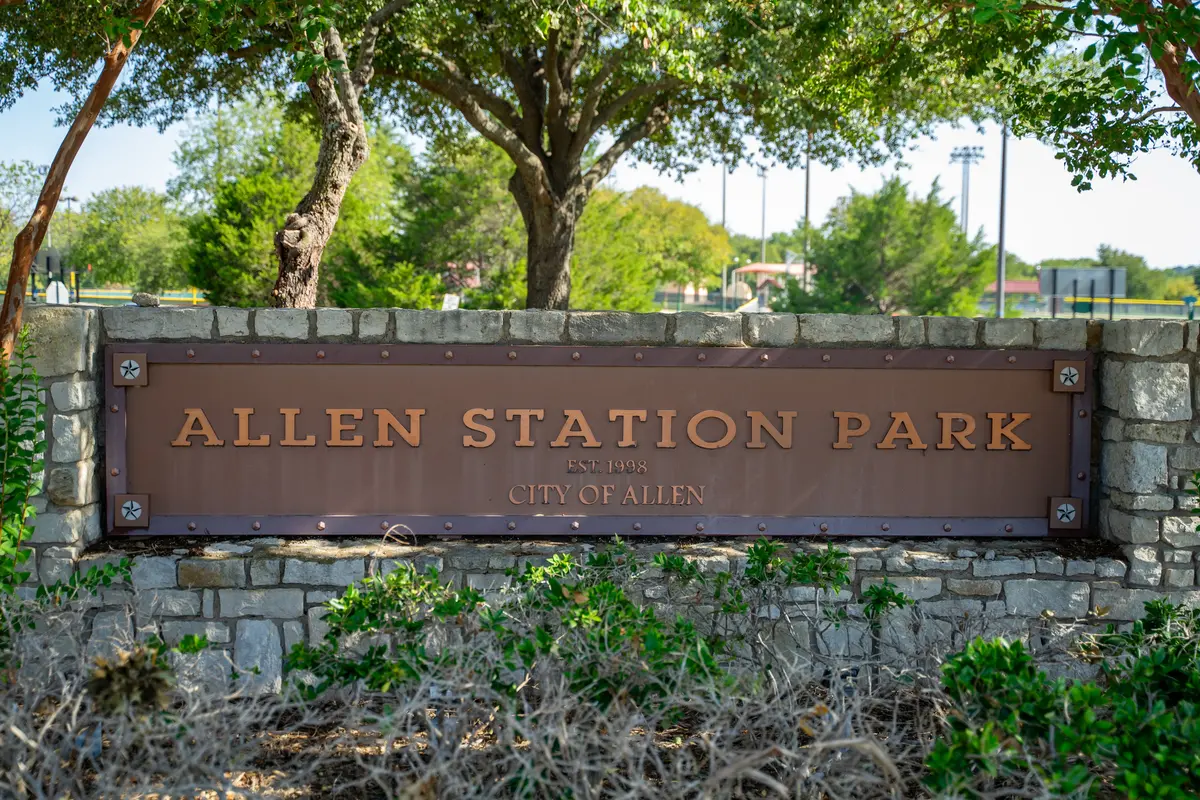
Allen maintains more than 1,100 acres of parkland and over 75 miles of hike-and-bike trails. Celebration Park, Bethany Lakes Park, and Allen Station Park are the anchors of that system. Well-maintained green space at this scale matters for safety in a practical sense: it gives families and kids a range of off-street places to be, and it keeps parks active enough that they remain safe in their own right. A park nobody uses is a different safety environment than one that draws families on any given afternoon. For a fuller look at Allen's parks and trails, see the parks and recreation guide.
A Note on Schools and Kids
Safety for families with school-age children is not only about neighborhood crime rates. Allen ISD's campuses are well-resourced and closely connected to the surrounding communities. The district holds an A rating, according to the Texas Education Agency. Full details on schools, boundaries, and what to look for when choosing a neighborhood based on school access are in the Allen schools guide.
How to Research Safety Before Choosing a Neighborhood
City-wide statistics are a starting point, not a conclusion. Before you decide on a specific neighborhood in Allen, there are a few things worth doing that the numbers alone will not tell you.
Look at the Street Layout, Not Just the Zip Code
Allen's calmest residential neighborhoods share a common feature: controlled access. Neighborhoods with limited entry points, looping interior streets, and little reason for non-residents to drive through tend to generate fewer incidents than those bisected by arterials or adjacent to commercial strips. Look at the street map of any neighborhood you are seriously considering. If it connects directly to a busy commercial road without any buffer, that is worth factoring in.
Use Multiple Aggregators, but Understand Their Limits
Different safety aggregators — CrimeGrade, NeighborhoodScout, AreaVibes — produce noticeably different overall grades for Allen depending on the methodology used. The figures in this guide — a violent crime rate of 1.1 per 1,000 residents and a property crime rate of 8.8 per 1,000 residents — come from the city's own reporting through federal crime data series. That is the most consistent baseline for comparing Allen against state and national figures from the same reporting system. Aggregator scores are useful for looking up a specific address but should not be treated as precise rankings against other cities.
Check the Allen Police Department's Annual Report
The department publishes a detailed annual crime report, including breakdowns by category and geographic concentration. It is publicly available and more granular than anything a third-party aggregator produces. Reading it takes twenty minutes and tells you where the 885 total crimes recorded in 2025 actually occurred — which is genuinely useful information when you are weighing one side of town against another.
Talk to the Neighborhood
Neighborhood apps and HOA listservs for Allen's planned communities are unusually active. Residents report incidents, discuss concerns, and flag anything out of the ordinary. Spending a week reading those channels for any neighborhood you are seriously considering will give you a more current picture than any annual statistic. The Citizens on Patrol program also means that many neighborhoods have an accessible point of contact — someone who does regular patrols and can tell you what, if anything, they have observed.
For context on what Allen's neighborhoods look like at the street level — housing stock, community character, and how they compare to one another — the neighborhoods guide is the place to start.
Local Expert Takeaway: Allen's crime numbers are not marketing spin — they hold up under scrutiny. A violent crime rate of 1.1 per 1,000 residents is among the lowest you will find in any Texas city above 100,000 people, and the 2025 data shows the trajectory is still improving. The practical reality is that residential Allen — Twin Creeks, Watters Crossing, Starcreek, Suncreek, and the other planned neighborhoods that make up most of the city — is about as calm as suburban Texas gets. The areas near the major retail corridors along the Sam Rayburn Tollway account for the bulk of property crime, and understanding that geography before you choose a neighborhood is the most useful thing this guide can give you.
Quick Takeaways & FAQs
✅ Allen carries a violent crime rate of 1.1 per 1,000 residents — less than a third of the Texas state average, making it one of the safest large suburbs in the Dallas-Fort Worth area.
⚠️ Property crime is concentrated near commercial retail corridors along the Sam Rayburn Tollway and Allen Premium Outlets — residential neighborhoods sit well below the city-wide average.
📍 The Allen Police Department reported a 22.6% total crime drop in 2025, with violent crime down 36.4% and motor vehicle theft down 59% — the department attributes this to targeted, data-driven patrol strategies.
What is Allen, Texas's violent crime rate?
Is Allen, TX safer than other Dallas suburbs?
Which Allen neighborhoods are the safest?
What kind of crime does Allen actually see?
How has Allen's crime rate changed in recent years?
Moving to Texas?
Tell us what you need help with and we'll connect you with local resources.
