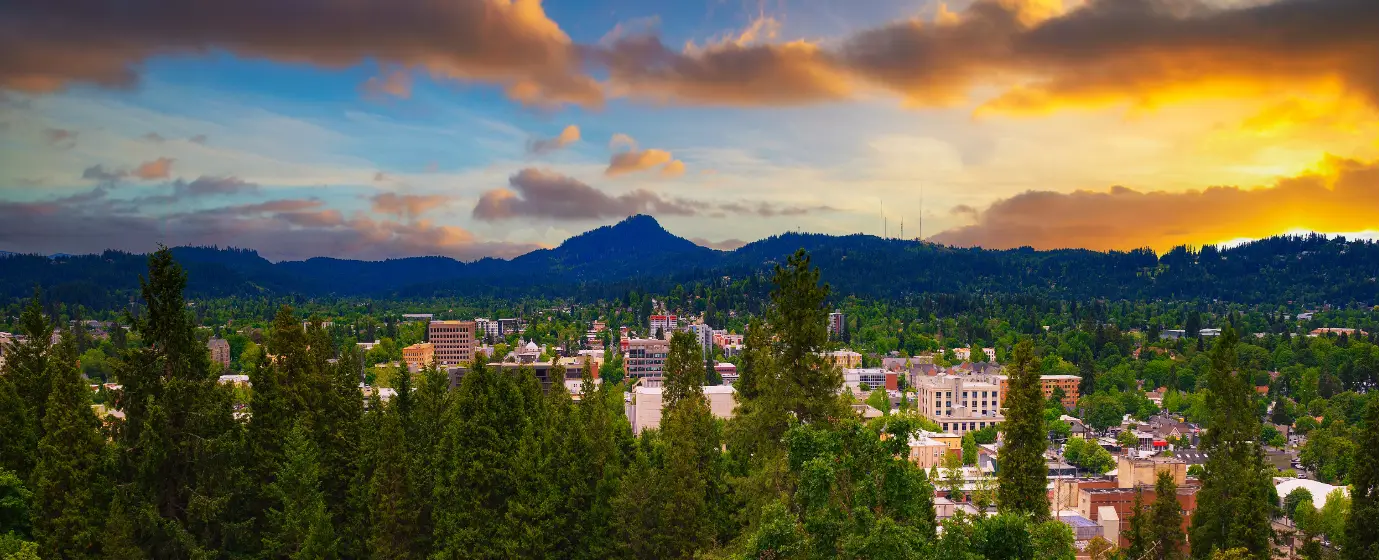
Eugene gets a reputation that doesn't quite fit the data — and doesn't quite exonerate it either. People moving from smaller Oregon towns hear the crime warnings and picture something close to Portland's toughest corridors. People moving from California or the Bay Area look at the numbers and shrug. The truth is specific: Eugene's violent crime sits close to both state and national averages, while its property crime runs noticeably above both. That gap between those two facts shapes almost everything about how safety works here, and which neighborhoods you'd be wise to research more carefully before committing to one.
Eugene is the 3rd-largest incorporated city in Oregon, with a population of 178,618 spread across a varied landscape — from the quiet, tree-canopied streets of Fairmount and Cal Young to the denser, more eclectic blocks of the Whiteaker and downtown core. The University of Oregon anchors the southeastern side of the city, drawing students, researchers, and a transient population that concentrates both foot traffic and certain categories of theft. Understanding that geography is the first step to reading the crime numbers honestly.
The headline figures: Eugene carries a violent crime rate of 3 per 1,000 residents and a property crime rate of 33 per 1,000 residents. Put alongside the state's violent crime rate of 3.3 per 1,000 and the national violent crime rate of 3.7 per 1,000, Eugene's violent crime profile is actually below both benchmarks. The property crime rate tells a different story — Oregon's statewide figure is 24.5 per 1,000 and the national rate is 18.4 per 1,000, both noticeably lower than Eugene's figure. That divergence is the honest starting point for any safety conversation here.
Whether you're deciding between Eugene and nearby Springfield, scoping neighborhoods for a move, or trying to understand what the crime maps actually mean, this guide breaks down the numbers by area, explains the trends pushing them in either direction, and tells you what long-time residents actually say about day-to-day safety in Eugene.

How Eugene's Crime Rate Compares — Context First
| Measure | Eugene | Oregon | National | vs. national |
|---|---|---|---|---|
| Violent crime (per 1,000) | 3 | 3.3 | 3.7 | 19% lower |
| Property crime (per 1,000) | 33 | 24.5 | 18.4 | 79% higher |
State and national figures — Bureau of Justice Statistics, Crime Known to Law Enforcement, 2024 (tables 2 and 3). City figures — NeighborhoodScout. City rates come from a different reporting series than the state and national benchmarks, so read the comparison as a direction, not a precise multiple.
The single most important thing to understand about Eugene's crime numbers is the split between violent and property crime. Violent crime here — assaults, robbery, rape, homicide — lands below the Oregon state average and below the national average. That is not spin; those are Bureau of Justice Statistics figures from 2024.
Property crime is where Eugene genuinely diverges. A property crime rate of 33 per 1,000 residents is substantially above the state's 24.5 per 1,000 and well above the national 18.4 per 1,000. What drives that gap? Larceny, bike theft, vehicle break-ins, and shoplifting — not burglary into occupied homes. Auto theft is a specific concern; Eugene's vehicle theft rate ranks among the higher figures nationally for cities its size.
The practical implication: what you're much more likely to experience here is a broken car window or a stolen bike than anything involving direct physical threat. That's a meaningful distinction for someone relocating, even if neither category is ideal.
There is also a clear trend worth noting. FBI data for the 2024 calendar year shows a 7% overall decline in Eugene's crime rate compared to 2023. Violent crime fell by roughly a fifth over that same period, and property crime dropped as well. Five years of consecutive declines in both categories don't make Eugene crime-free, but they do say something about the direction of travel.
The 2025 City of Eugene Community Survey adds a useful street-level check: 89% of residents said they feel safe walking in their neighborhood during the day, and 72% said they feel safe visiting the park nearest their home. The same survey found that residents named homelessness, public harassment, erratic behavior, drug use, and property theft as the five issues most affecting their sense of safety. Both the reassuring numbers and the honest concerns live in the same document.
Neighborhood-by-Neighborhood Safety Picture
Eugene's safety story is not uniform across its neighborhoods. A city-wide average blurs differences that matter enormously when you're deciding where to live. Here's what the data and local pattern of incidents actually show for each area.
Cal Young and Fairmount — Consistently at the Top
Cal Young carries one of the lowest incident profiles in Eugene. It sits on the northern edge of the campus area, composed largely of established single-family homes and long-term residents, and sees few of the property crime incidents that elevate the city's overall rate. If you want to look up a specific address, tools like CrimeGrade or NeighborhoodScout can give you a block-level picture — but the neighborhood's overall pattern is consistently among the city's quietest.
Fairmount, tucked into the hillside east of the university, carries a similarly strong safety record — low incident levels, a quiet residential character, and the kind of tree-canopied streets where the pace slows noticeably. Both neighborhoods run above the city median in price, and their safety profiles are part of why.
Best for: Families Quiet
Santa Clara — Safe and Underrated
Santa Clara appeared consistently on Eugene's safest-neighborhoods lists in 2025 and sees incident rates well below the city average. It sits north of downtown, more removed from the university's orbit, with a suburban character that keeps foot traffic — and its associated property crime — relatively low. Homes here run at the city median price.
Best for: Families Value
River Road — Solid Middle Ground
River Road sits in the middle of Eugene's safety spectrum — meaningfully quieter than the downtown core and the Whiteaker, but not as settled as Cal Young or Santa Clara. Its working-class corridor character means more foot traffic than the purely residential neighborhoods, and with that comes a higher rate of vehicle-related incidents. Still, it's well below the city's most incident-heavy areas and sits below the city median in price.
Best for: First-Time Buyers Commuters
Bethel / Danebo — Lower Prices, Higher Awareness Required
Bethel / Danebo sits on the west side and carries a more varied safety record than the neighborhoods above. Its prices are below the city median, which draws buyers priced out elsewhere — but it's worth spending time in the specific blocks you're considering before settling on one. The neighborhood is large and internally inconsistent; pockets of it are quiet and stable, while others see more incident activity.
Best for: Value Renters
Friendly Area (South University / Amazon) — Campus Adjacent
The Friendly Area sits immediately south of the University of Oregon and carries the predictable mix that comes with proximity to a large campus: active street life, some concentration of bike theft and vehicle break-ins, but also genuine neighborhood cohesion among the long-term residents who anchor it. Its price runs at the city median. Think of it as a neighborhood that rewards knowing the specific streets.
Best for: Walkable Students & Faculty
Whiteaker — The Honest Assessment
Whiteaker has a devoted following — it's Eugene's most culturally distinct neighborhood, with independent businesses, live music, and a community identity that's genuinely its own. It also carries the city's most challenging property crime profile. Theft and vehicle break-ins are the dominant offense types, and the overall incident density here is the highest of any residential neighborhood in the city. Tools like CrimeGrade can show you the block-level picture if you're seriously considering a specific address.
Residents who know it well tend to draw a clear line: the northwest portion of Whiteaker is generally considered its most settled section. If Whiteaker appeals to you, that's where to focus your neighborhood research. Prices run below the city median, which factors into a lot of people's calculus here.
Best for: Renters Walkable
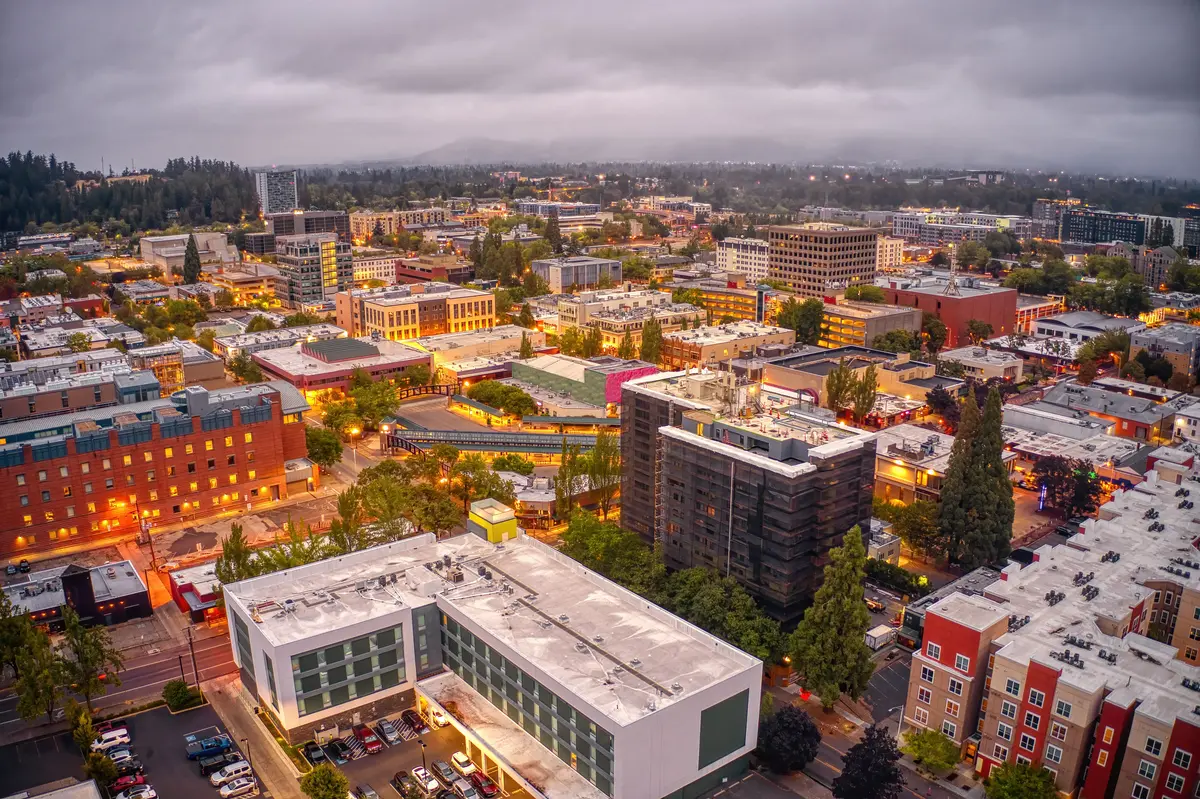
Downtown Eugene: The Most Watched Block in the City
Downtown Eugene is where the safety conversation gets loudest — and where the numbers are most actively moving. It remains the part of the city with the highest total incident counts, concentrated by retail density, foot traffic, and the social-service infrastructure that draws people in acute need.
But the trend line matters here more than almost anywhere else in the city. A targeted enforcement strategy launched by the Eugene Police Department in 2024 produced documented results in the first half of 2025: robberies dropped from 16 to 5, overdose calls declined by 40%, and warrant arrests more than doubled as part of a focused deterrence effort.
The department also embedded a Lane County Behavioral Health professional with officers for mental health-related calls downtown — a co-responder model funded in part by a federal grant — beginning in 2024. The practical effect is that calls that would previously have defaulted entirely to sworn officers now have a specialist on the response. That shift matters both for outcomes and for how the department is perceived.
None of this makes downtown Eugene a place to walk at 2 a.m. without awareness of your surroundings. But it's also not static. The question for someone relocating is less "is downtown safe?" and more "is downtown improving?" — and the honest answer to the second question is yes, measurably, over the past two years.
One useful reframe: the central parts of Eugene record the highest raw incident counts in part because that's where the most retail activity, transit infrastructure, and visitor foot traffic are concentrated. High counts in a commercial core don't translate directly to residential risk. The neighborhoods immediately surrounding downtown — particularly to the south and east — have their own distinct profiles.
Looking to buy in Eugene? Estimate your payment.
Enter your numbers to see an estimated monthly mortgage payment.
Estimate only. Excludes HOA fees and mortgage insurance. The interest rate above is a starting point, not a quoted rate — replace it with your own to see real numbers. Insurance is a flat placeholder, not a Eugene quote.
What's Behind the Numbers: Property Crime, Drug Policy, and Policing
Understanding why Eugene's property crime rate runs elevated requires a short detour through recent Oregon policy history. In 2020, Oregon voters passed Measure 110, which decriminalized possession of small amounts of controlled substances. The years that followed saw visible increases in public drug use in several cities, Eugene among them, with downstream effects on petty crime and street-level disorder.
In 2024, the Oregon Legislature passed HB 4002, re-establishing misdemeanor criminal penalties for small-quantity drug possession, effective September 2024. The law also created deflection pathways that allow people to access treatment instead of traditional prosecution. Whether that policy shift produces measurable reductions in Eugene's property crime numbers over the next few years is genuinely an open question — but it represents the most significant change to the legal environment in this category in five years.
Vehicle theft deserves a separate paragraph because it's the category that surprises most newcomers. Eugene's auto theft rate is elevated relative to cities of comparable size nationally. This isn't random: the combination of a large student population, a transient presence in certain corridors, and the region's proximity to the interstate as a throughway all factor in. Locking your car isn't enough; leaving anything visible inside it is an invitation in parts of this city that it wouldn't be in a quieter metro.
The EPD's structure is worth knowing. The department responds to approximately 240 calls per day and runs proactive community programs — a Citizen's Police Academy, a Safety Town program aimed at young children, National Night Out, and a Community Engagement Team that works directly with businesses and residents. In 2024, EPD volunteers logged over 13,000 hours of service. That's the operational picture of a department that's trying to move beyond pure reactive policing, even if the resource constraints of a mid-sized Oregon city are real.
Oregon's broader drug policy shift and the EPD's co-responder model are both less than two years old. Anyone evaluating Eugene's safety trajectory needs to sit with some uncertainty about whether the current declines are durable — but the direction of the data, for now, points the right way.
Practical Advice: How to Evaluate Safety Before Choosing a Neighborhood
Crime maps are useful and also systematically misleading in one specific way: they measure incident density, not resident risk. A block that sees frequent theft because it sits next to a busy retail corridor may feel perfectly calm to someone who lives there and keeps their car in a garage. A quieter residential street with fewer recorded incidents might see one violent incident that skews its rate for a year. Use the maps as a starting point, not a verdict.
The most reliable on-the-ground check is still the one that sounds obvious: spend time in the neighborhood at different times. Eugene's community character shifts noticeably between morning and evening in areas near downtown, the Whiteaker, and the university. What a block feels like at 10 a.m. on a Tuesday and what it feels like at 9 p.m. on a Friday are different data points, and both matter.
For families with school-age children, safety perception tends to center on two things: the walk to school and the park nearest the house. The 2025 Community Survey's figure — 72% of Eugene residents feel safe at the park nearest their home — is worth holding alongside your neighborhood research rather than treating as universal. Cal Young, Fairmount, and Santa Clara all deliver that feeling reliably. Whiteaker and parts of the Bethel corridor require more neighborhood-specific investigation. For a fuller picture of how these neighborhoods compare across other dimensions, the Eugene neighborhoods guide covers character, housing stock, and who each area tends to suit.
One thing most newcomers don't expect: bike theft in Eugene is serious and organized, not opportunistic. If cycling is part of your daily routine — and in a university city with an extensive trail network it very well might be — plan your storage and locking setup before you arrive, not after your first bike disappears. The Ridgeline Trail System and Alton Baker Park attract cyclists from across the metro, and the trailhead parking areas near both see their share of vehicle break-ins.
The bottom line for someone relocating: Eugene is not a dangerous city in the violent-crime sense, and it's getting measurably safer on that measure. Its property crime challenge is real but concentrated, predictable in its geography, and largely avoidable with practical habits. The neighborhoods that consistently deliver low incident rates — Cal Young, Fairmount, Santa Clara — are the ones to start with if safety is your primary criterion. The ones that require more nuance — Whiteaker, parts of Bethel — reward research rather than assumptions in either direction.
Local Expert Takeaway: Eugene's safety profile is genuinely split: a violent crime rate of 3 per 1,000 residents sits below both state and national averages, while a property crime rate of 33 per 1,000 residents — driven by vehicle theft, bike theft, and break-ins — runs well above both. The gap between those two facts explains most of the disagreements you'll find in online forums about whether Eugene is safe. Cal Young, Fairmount, and Santa Clara deliver the lowest incident profiles and the strongest community safety survey responses. Downtown is the most watched spot in the city, and its trajectory is measurably improving. If property crime is your concern, the practical answers are neighborhood-specific research, realistic habits around vehicles and bikes, and an understanding that a red spot on a crime map often marks a retail corridor, not a residential one.
Quick Takeaways & FAQs
✅ Eugene carries a violent crime rate of 3 per 1,000 residents — below both Oregon's and the national averages — and that figure fell roughly a fifth in a single year according to 2024 FBI data.
⚠️ Eugene carries a property crime rate of 33 per 1,000 residents, substantially above state and national benchmarks, driven primarily by vehicle theft, bike theft, and break-ins rather than burglary.
📍 Cal Young, Fairmount, and Santa Clara consistently show the lowest incident profiles in the city across multiple crime-tracking services — start your neighborhood research there if safety is your primary criterion.
Is Eugene, Oregon a safe place to live?
Which Eugene neighborhoods are the safest?
What type of crime is most common in Eugene?
Is downtown Eugene safe to walk around?
How does Eugene's crime rate compare to other Oregon cities?
Moving to Oregon?
Tell us what you need help with and we'll connect you with local resources.
