
Everyone who moves to Seattle from out of state hears the same warning in the first week: "It's not what it used to be." The reality, once you actually look at the data, is more complicated than either the alarm or the dismissal. Seattle's 2024 crime figures — a violent crime rate of 7.75 per 1,000 residents and a property crime rate of 50.1 per 1,000, drawn from FBI Uniform Crime Report data — are genuinely elevated relative to national benchmarks. The city ranked 4th worst for total crime among the 30 largest U.S. cities in 2024. That's a real number and it belongs in any honest conversation about living here.
But the trajectory matters as much as the snapshot. The Seattle Police Department's February 2026 year-in-review reported an 18% overall reduction in crime citywide in 2025 compared to 2024. Homicides dropped 36% to 37 — the lowest count since before the COVID-19 pandemic. Stolen vehicle incidents fell 24%. These aren't small statistical blips; they represent thousands of fewer victims. The city that shows up in headlines and the city that shows up in SPD's precinct-level data are increasingly different places, and understanding both is the only way to make a clear-eyed decision about a neighborhood.
Seattle is also a city of sharp geographic contrasts. The blocks around Pioneer Square and Belltown feel categorically different from the residential streets of Queen Anne or Green Lake, yet they all carry the same city-wide crime average in a headline. Property crime — larceny-theft, vehicle break-ins, and burglary — is the dominant driver, not the violent crime that most people imagine when they hear a city called dangerous. That distinction changes how you think about daily life here, and it changes which neighborhoods actually warrant concern versus which ones carry unearned reputations.
Whether you're weighing a move to Capitol Hill, comparing Ballard against Wallingford, or just trying to understand whether the Seattle you've read about matches the Seattle you'd actually live in, the sections below break down the city's crime picture by category, by neighborhood, and by what's actually changing on the ground in 2025 and 2026.
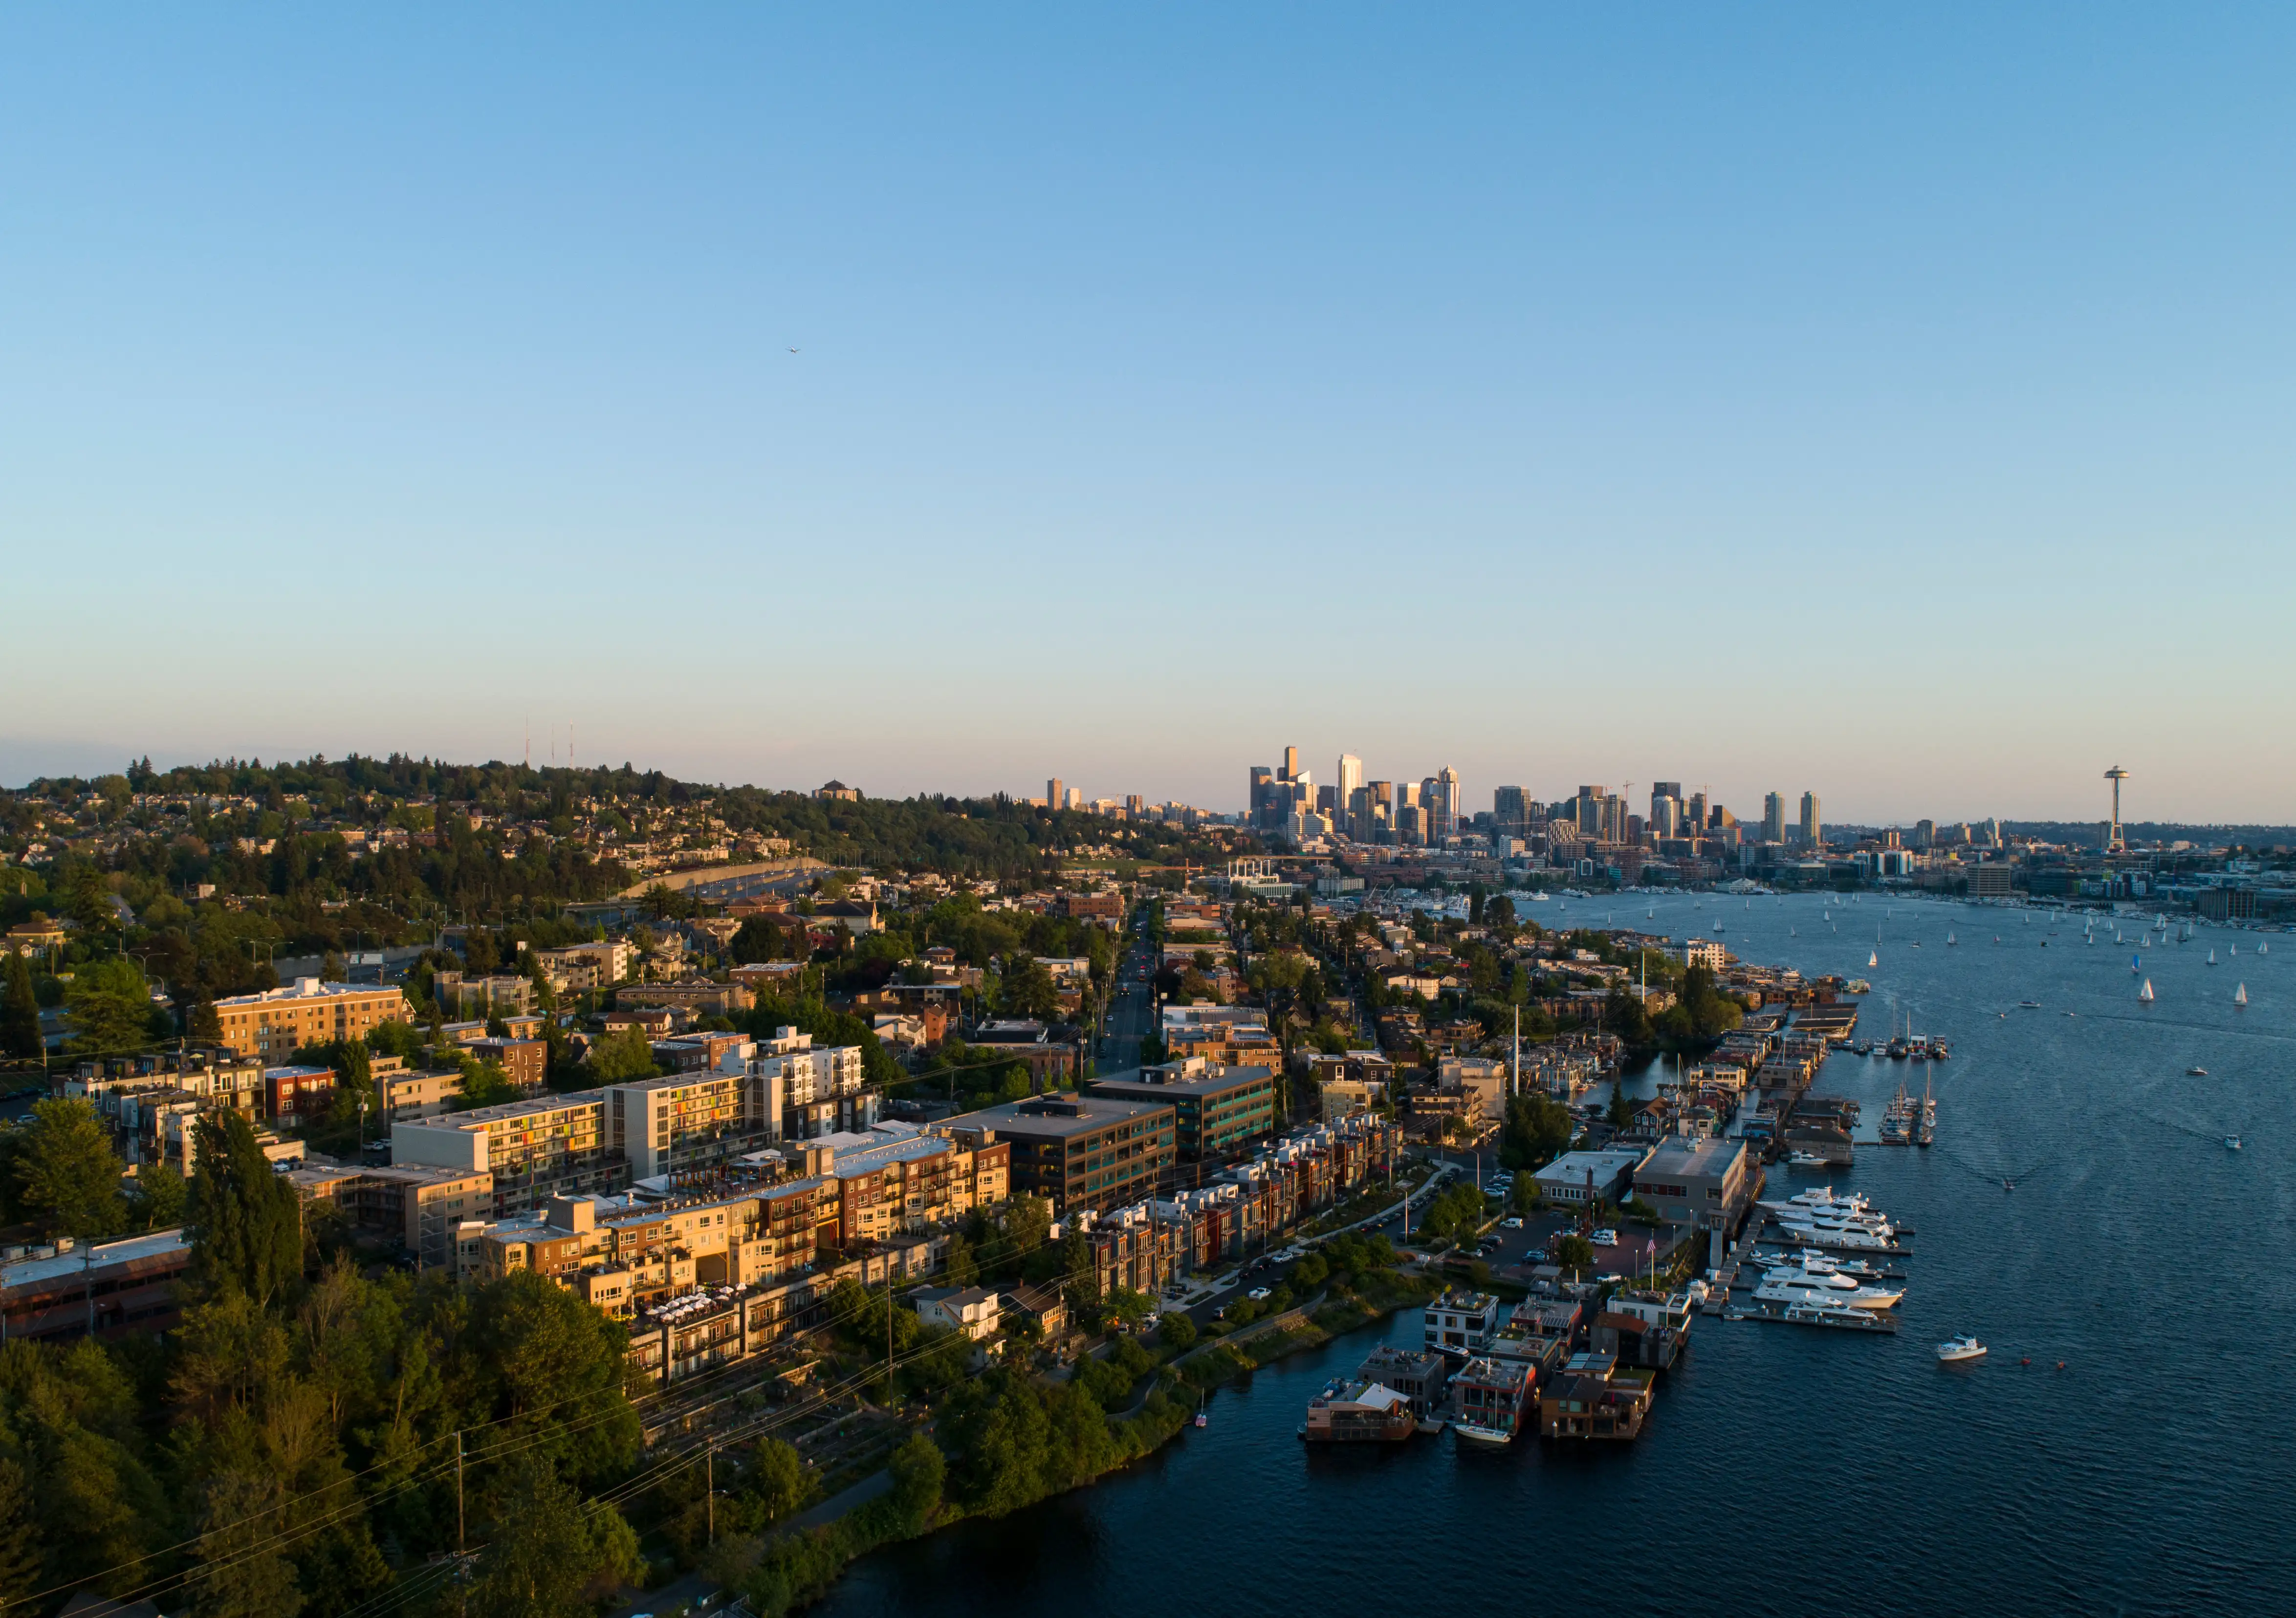
The Numbers in Context: How Seattle Compares
Seattle's violent crime rate of 7.75 per 1,000 residents is approximately 120% above the national average and 135% above the Washington state average, based on 2024 FBI Uniform Crime Report data. That sounds alarming in isolation, and it's not nothing.
What the rate doesn't show is where Seattle lands on violent crime specifically. Among the 30 largest U.S. cities, Seattle did not rank in the top 10 for violent crime. Memphis reported a total crime rate of 9,400.3 per 100,000 in 2024; Portland came in at 6,246.4 per 100,000. Seattle's 2024 figure of 5,782.7 per 100,000 is elevated, but it is not in the same tier as the cities that dominate national violent-crime discussions.
What the Crime Categories Actually Tell You
Property crime is Seattle's primary driver, not violent crime. The 2024 breakdown shows larceny-theft at 21,905 incidents, burglary at 8,756, and motor vehicle theft at 7,400. On the violent crime side, the dominant category was aggravated assault at 3,810 incidents, followed by robbery at 1,677. Homicide, at 52 in 2024, represents a fraction of the total violent crime count.
The statistical per-capita risk of being named in a violent crime report in any given year works out to roughly 1-in-129, based on the 2024 figures. UCR counts reflect offenses reported to law enforcement — unreported incidents mean the real rate is higher — but the 1-in-129 figure gives a useful sense of scale for daily life.
| Crime Category | 2024 Incidents | Rate per 1,000 | National Context |
|---|---|---|---|
| Larceny-Theft | 21,905 | ~27.9 | Significantly above average |
| Motor Vehicle Theft | 7,400 | ~9.4 | Well above average |
| Burglary | 8,756 | ~11.2 | Well above average |
| Aggravated Assault | 3,810 | ~4.9 | Above average |
| Robbery | 1,677 | ~2.1 | Above average |
| Rape | 352 | ~0.45 | Near national average |
| Homicide | 52 | ~0.07 | Elevated for a major city |
| Arson | 153 | ~0.19 | Above average |
The national picture provides useful backdrop: violent crime dropped 4% nationally in 2024 and property crime fell 8% year-over-year — the steepest auto-theft decline in more than four decades. Seattle's figures exist against a backdrop of broadly improving national trends, and the city's own 2025 trajectory is moving in the same direction.
What Changed in 2025: The Trend Lines That Matter
The most significant Seattle safety story of the past two years isn't the 2024 ranking. It's what happened in 2025. SPD Chief Shon Barnes's February 2026 year-in-review reported an 18% overall crime reduction citywide — a figure that spans every major category.
Homicides fell from 58 to 37, a 36% drop and the lowest count since before the pandemic. Aggravated assaults produced 320 fewer victims. Stolen vehicle incidents dropped by 1,821 — a 24% decrease. Burglaries fell 18%, translating to 1,571 fewer incidents. SPD also added a net 94 officers in 2025, reversing a staffing decline that had been a persistent issue for several years.
The Real-Time Crime Center Effect
One of the more concrete explanations for the improvement is SPD's Real-Time Crime Center, which launched and assisted in 45% of homicide cases within months of going operational. The homicide clearance rate jumped from 57% in 2024 to 86% in 2025, well above the 61% national average. A higher clearance rate matters to residents in a direct way: unsolved homicides cluster in communities and generate ongoing fear; solved cases don't.
Six months after arriving in Seattle, many residents are surprised to find that the city they're actually living in — grabbing a meal at Spice Waala on 15th Avenue East, stopping into Stoup Brewing on Capitol Hill's Broadway — feels meaningfully calmer than the city described in the news alerts they were reading before they moved. The 2025 data is one reason why. The gap between perception and lived experience is real here, and it's been widening in the city's favor.
None of this means the issues are resolved. The 2024 FBI figures are still the baseline, and a single year of improvement — even a strong one — doesn't erase a structural pattern. But anyone making a neighborhood decision based on 2021 or 2022 coverage is working with a badly outdated map.
Neighborhood Safety: Where Seattle's Crime Concentrates
The city-wide crime rate is a blunt instrument. What actually matters for daily life is where crime concentrates — and in Seattle, the geographic pattern is fairly consistent. See the full neighborhood breakdown here for character and lifestyle context; this section focuses on the safety picture specifically.
Higher-Exposure Areas
Downtown, Pioneer Square, Belltown, and the southern end of Capitol Hill — particularly around transit hubs and nightlife corridors — consistently report the highest concentrations of theft, vehicle break-ins, and street-level crime. These are high-foot-traffic zones, and property crime follows foot traffic. Pioneer Square is one of Seattle's most historically significant landmarks and is worth visiting; it is also one of the areas where keeping close tabs on your belongings is genuinely practical advice.
Capitol Hill's overall crime rate is approximately 81.36 per 1,000 residents annually — well above the city average. The concentration is heaviest in its southwest blocks, particularly around Broadway and Pike/Pine. The northeast portion of Capitol Hill, by contrast, records noticeably fewer incidents. The main risk in Capitol Hill is petty theft; violent crime in the neighborhood runs lower than the aggregate rate implies. Stoup Brewing on Broadway sits in a busier corridor; walking a few blocks northeast puts you in a quieter residential register entirely.
Lower-Exposure Residential Areas
Queen Anne and Green Lake are consistently identified in neighborhood safety analyses as among the city's lower-crime residential zones. Both have stable homeowner presence, family-oriented streets, and relatively lower rates of both theft and assault. These aren't gated enclaves — they're walkable city neighborhoods — but they operate in a materially different safety environment than Pioneer Square does.
Ballard presents a mixed picture that's worth understanding clearly. The residential blocks north of Market Street are quieter and community-oriented. The commercial corridor along Ballard Avenue and the stretches near transit stops carry more of the property crime exposure typical of busy retail areas. The city's neighborhood safety programs have directed dedicated outreach to Ballard specifically, connecting residents, businesses, and city departments around safety concerns.
| Neighborhood | Safety Profile | Primary Risk Type | Best For |
|---|---|---|---|
| Queen Anne | Lower crime, residential | Occasional property theft | Families Quiet |
| Green Lake | Lower crime, family-oriented | Occasional property theft | Families Nature |
| Ballard (residential) | Moderate, improving | Vehicle break-ins near commercial blocks | Commuter Value |
| Wallingford | Moderate-low | Occasional property theft | Families Walkable |
| Fremont | Moderate | Property crime near commercial strip | Transit Walkable |
| West Seattle | Moderate-low | Vehicle theft, occasional burglary | Families Views |
| Capitol Hill (NE) | Moderate, varies by block | Petty theft dominant | Renter Walkable |
| Columbia City | Moderate | Property crime, some street-level incidents | First-Time Transit |
The single most important research habit for any Seattle neighborhood is checking the block-level pattern, not just the neighborhood average. Two streets in Capitol Hill can have very different incident histories, and that distinction is visible in SPD's public data portal before you ever visit in person.
Looking to buy in Seattle? Estimate your payment.
Enter your numbers to see an estimated monthly mortgage payment.
Estimate only. Excludes HOA fees and mortgage insurance. The interest rate above is a starting point, not a quoted rate — replace it with your own to see real numbers. Insurance is a flat placeholder, not a Seattle quote.
Property Crime: The Real Day-to-Day Risk
If you're moving to Seattle and you're focused on violent crime as your primary concern, you're tracking the wrong line item. Property crime — at 50.1 per 1,000 residents in 2024 — is what shapes the practical texture of daily life here far more than the violent crime rate does.
Vehicle Break-Ins and Motor Vehicle Theft
Motor vehicle theft is the category that catches most newcomers off guard. Seattle recorded 7,400 motor vehicle thefts in 2024 — a significant number for a city of just under 785,000 people. The 2025 improvement was real: stolen vehicle incidents dropped 24%, erasing 1,821 cases year-over-year. But "real improvement" and "not a concern" are different things. Leaving valuables visible in a parked car, anywhere in the city, is reliably a bad idea. This isn't alarmism — it's the adjustment most Seattle residents make within the first month and stop thinking about after that.
Vehicle break-ins cluster around the same high-foot-traffic corridors as other property crime: the blocks around Pike Place Market, the south end of Capitol Hill, and anywhere near light rail stations. Parking in a garage rather than on the street in these zones reduces exposure meaningfully. Residents in Queen Anne, Green Lake, and residential Ballard report a noticeably different experience with this than residents in Belltown do.
Burglary Patterns
Burglaries fell 18% in 2025, representing 1,571 fewer incidents. The improvement is real, but the baseline was high: 8,756 burglaries in 2024. Seattle's older housing stock, with aging window locks and detached garages, is part of the structural exposure. Homes in denser residential neighborhoods with strong block-level community ties — think the residential streets of Wallingford or upper Queen Anne — tend to report fewer incidents than mixed-use corridors do. A security system and reinforced door hardware are standard practice here in a way they simply aren't in Bellevue or Kirkland.
One thing that surprises people after six months in Seattle: the property crime is real, but it rarely feels threatening in the way that the statistics might imply. Most of it is opportunistic. The adjustment is largely behavioral — lock the car, don't leave the laptop bag visible, know your block — rather than a fundamental recalibration of personal safety.
How to Research Safety Before Choosing a Neighborhood
The city-wide figures are the starting point, not the destination. Seattle's SPD publishes a public crime dashboard that maps incidents by type, date, and precinct — it's searchable by address and neighborhood, and it's updated regularly. Running a specific address or intersection through that tool before settling on an area tells you far more than any aggregate ranking.
What to Actually Look For
Focus on the ratio of property crime to violent crime in a specific zone. A block with high larceny-theft but low assault and robbery is a different kind of exposure than a block with the reverse pattern. For most residential neighborhoods in Seattle, property crime will dominate — and that's a solvable, behavioral problem in a way that violent crime is not.
Capitol Hill is the neighborhood that most consistently surprises people who research it carefully. The aggregate rate of approximately 81.36 per 1,000 residents makes it sound like one of the city's most dangerous areas. The block-level map tells a different story: the southwest corner near Pike/Pine and Broadway carries most of that weight. The residential streets in the northeast quadrant — near 19th and Mercer, for instance — are quieter and record the fewest incidents in the neighborhood. Knowing that distinction changes how you evaluate an apartment or a home on a specific street.
Community Safety Programs Worth Knowing
The Seattle Department of Neighborhoods coordinates dedicated outreach staff paired with specific neighborhoods to connect residents, businesses, and city departments around safety concerns. Ballard received dedicated coordination in 2024; Capitol Hill followed in 2025. If you're considering either neighborhood, those neighborhood-level contacts are a direct resource for understanding what's actually being addressed at the street level — not just the aggregate statistics.
The honest summary: Seattle's crime picture is real, above national averages, and worst in specific high-foot-traffic corridors. It is also improving at a pace that the 2024 FBI figures don't yet capture, and it varies by neighborhood in ways that make a block-level research approach far more useful than any city-wide ranking. The people who feel most at ease here are the ones who understand the geographic pattern and made a deliberate choice about where within it they want to live.

Local Expert Takeaway: Seattle's elevated crime figures are real — particularly for property crime — but they are concentrated in specific corridors around Pioneer Square, Belltown, and the south end of Capitol Hill, not spread evenly across the city. The 18% overall crime reduction SPD reported for 2025, with homicides at their lowest level since before the pandemic and stolen vehicle incidents down 24%, represents genuine momentum. If you're researching a neighborhood, pull the SPD crime dashboard for the specific blocks you're considering, not just the neighborhood average — the northeast corner of Capitol Hill and the residential streets of Queen Anne or Green Lake operate in a materially different environment than the transit corridors and nightlife strips that dominate the city-wide statistics.
Quick Takeaways & FAQs
✅ Seattle's 2025 crime trend is moving sharply in the right direction — an 18% overall reduction citywide, with homicides hitting their lowest level since before the COVID-19 pandemic.
⚠️ Property crime, not violent crime, is Seattle's dominant issue: motor vehicle theft, larceny, and burglary collectively drive the city's above-average statistics, and they concentrate heavily in specific commercial corridors rather than residential neighborhoods.
📍 Queen Anne and Green Lake consistently rank among the city's lower-crime residential areas, while the southwest blocks of Capitol Hill near Pike/Pine carry the heaviest incident load in that otherwise popular neighborhood.
Is Seattle safe to live in?
What type of crime is most common in Seattle?
Which Seattle neighborhoods are safest?
Is Seattle's crime getting better or worse?
How does Seattle's crime rate compare to other major cities?
Moving to Washington?
Tell us what you need help with and we'll connect you with local resources.
