The number that stops people cold is 34.35 property crimes per 1,000 residents. That figure lands in the top quartile of Washington cities by property crime rate, and if you're researching Olympia for the first time, it can feel disqualifying. But Olympia's raw crime rate contains a structural distortion that affects almost every state capital city in the country — and understanding it changes the picture considerably before you dismiss the city outright.
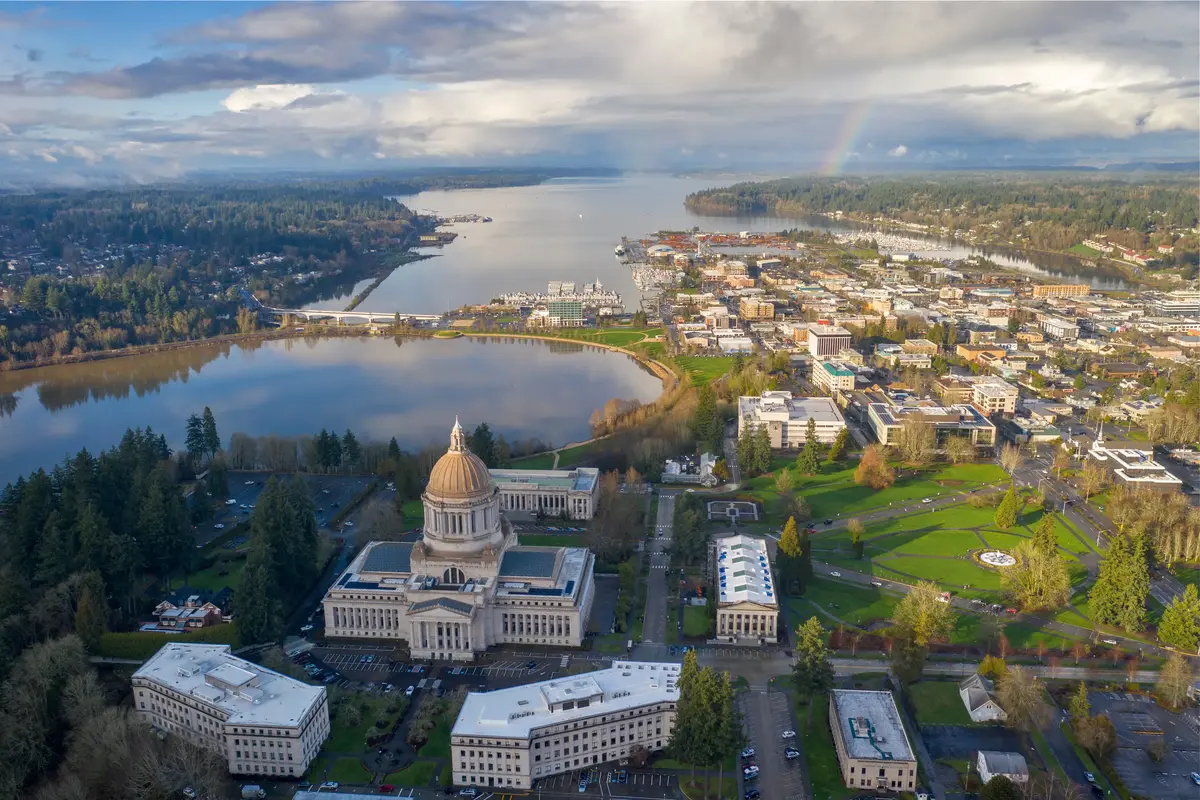
Olympia is Washington's seat of government, which means the downtown core hosts the State Capitol campus, concentrated social services, transit corridors, and one of the region's most visible unhoused populations, all packed into a compact geography. Those blocks generate a disproportionate share of reported incidents relative to the number of people who actually live there. The residential neighborhoods that spread north, east, and southeast of downtown — places like Northeast Olympia, Bigelow Highlands, and Southeast Olympia — operate in a measurably different environment than what the citywide headline suggests.
On the positive side of the ledger: the 2024 crime total fell roughly 5% from 2023, motor vehicle theft dropped sharply, and Washington state as a whole posted a 14.1% crime reduction between 2023 and 2024 — well ahead of the national average decline. The city has also invested in non-traditional public safety infrastructure, including a Crisis Response Unit that fielded more than 3,000 calls in a single year without an armed officer. None of that makes Olympia crime-free, but it does make the trajectory more optimistic than a single snapshot suggests.
This guide works through Olympia's FBI UCR 2024 data in detail — breaking down crime by type, explaining the downtown concentration effect, comparing the city to its Thurston County neighbors, mapping the safety picture across Olympia's eight neighborhoods, and describing what the city is actively doing about public safety — so you can make a well-informed decision about where in the South Puget Sound area makes sense for you.
Olympia's 2024 Crime Numbers in Context
Start with the raw counts: Olympia recorded 315 violent crimes and 1,916 property crimes in 2024, per FBI UCR data. That translates to a violent crime rate of 5.65 per 1,000 residents and a property crime rate of 34.35 per 1,000 residents.
Washington state's 2024 violent crime rate was 3.29 per 1,000 — Olympia's rate runs noticeably above that benchmark. The state figure itself sat roughly in line with the U.S. national average, which means Olympia's violent crime rate is meaningfully elevated not just against Washington but against the country as a whole.
That's the honest read. The context matters just as much.
The Daytime Population Effect
Olympia's resident population is approximately 55,951. But on a typical weekday, the Capitol campus and downtown office corridors absorb thousands of state workers, lobbyists, visitors to Percival Landing, and Capitol Theater patrons who are counted in reported incidents but not in the residential denominator used to calculate the per-capita rate. This is the same inflation effect that distorts safety data for state capitals like Lansing, Montpelier, and Olympia's West Coast counterpart, Sacramento.
The practical implication: the "34.35 per 1,000" figure is a city-wide average that over-weights the downtown corridor and under-represents what life is actually like in Olympia's residential neighborhoods.
The Trend Is Moving in the Right Direction
Citywide crime fell approximately 5% in 2024 compared to 2023. Motor vehicle theft dropped from roughly 303 cases to 215 — a decline of approximately 29% — though it remains elevated relative to national norms. Washington state's overall crime dropped 14.1% in the same period, nearly double the national average decline, giving Olympia's improvement a strong tailwind.
| Metric | Olympia (2024) | Washington State (2024) | U.S. National (2024) |
|---|---|---|---|
| Violent crime rate (per 1,000) | 5.65 | 3.29 | ~3.59 |
| Property crime rate (per 1,000) | 34.35 | N/A (varies by source) | N/A |
| Year-over-year change (2023–2024) | −5% | −14.1% | −8.4% |
| Motor vehicle theft (raw count) | 215 (down from 303) | — | — |
| Larceny-theft share of all crime | ~62% | — | — |
| Violent crime count (raw) | 315 | — | — |
The most common crime in Olympia is larceny-theft, which accounts for roughly 62% of all reported offenses. It concentrates in commercial areas, downtown parking zones, and transit-adjacent corridors — not spread evenly across residential blocks.
Neighborhood-by-Neighborhood Safety Picture
The eight neighborhoods that make up Olympia are not equally exposed to the crime patterns visible in citywide data. Distance from the downtown core is the single most reliable predictor of a quieter safety environment — though it's not the only factor worth understanding.
For a full profile of each neighborhood's character, see the Olympia neighborhoods guide. What follows is the safety-specific read on each area.
Downtown Olympia
This is where citywide averages are made and broken. The blocks immediately surrounding Capitol Lake, the State Capitol Campus, and the Olympia Farmers Market corridor concentrate a significant share of the city's reported larceny-theft, disorder calls, and visible unhoused activity. Percival Landing and the waterfront dining stretch see steady foot traffic that keeps the immediate area reasonably active during daylight hours, but parking lots near the downtown transit center and the overnight environment near the shelter corridor are a different story. Downtown is not a war zone, but it's the area where being alert to your surroundings genuinely matters.
Best for: People who work downtown and want a short commute; less suited to those who prioritize the quietest residential environments.
South Capitol
South Capitol sits directly adjacent to the Capitol campus but feels meaningfully different from the commercial downtown core. The tree-lined streets, older craftsman housing stock, and proximity to Capitol Lake give it a neighborhood identity that the immediate downtown blocks lack. Foot traffic here is largely legislative and professional rather than transit-adjacent. Among the central neighborhoods, this one carries a calmer day-to-day feel.
Best for: Walkable professionals who want proximity to the Capitol without the density of downtown.
Eastside
The Eastside is one of Olympia's more established residential areas, sitting east of downtown with a mix of mid-century homes and newer infill. Crime exposure here is noticeably lower than in the downtown core. The neighborhood's proximity to arterials connecting to Lacey means some commercial corridor activity, but the interior residential blocks are quiet by Olympia standards.
Best for: Families Value buyers who want proximity to downtown without the downtown crime environment.
Northeast Olympia
Northeast Olympia is frequently cited as one of the city's calmer residential zones. The farther north you go from downtown, the thinner the density of reported incidents becomes. Streets in this corridor tend toward quieter traffic patterns, and the distance from the social services corridor matters in real terms. This is where many longtime Olympia residents who have specifically sought out a lower-crime environment have landed.
Best for: Quiet Families residents prioritizing residential calm.
Southeast Olympia
Southeast Olympia includes some of the city's newer residential development, with subdivisions extending toward the Lacey boundary. The crime environment here reflects less of the downtown concentration effect and more of a standard Pacific Northwest suburban pattern. The trade-off is distance from walkable amenities, but on safety metrics this area consistently performs better than the citywide average suggests.
Best for: Families Commuter households willing to drive in exchange for a quieter environment.
South Westside
The South Westside sits west of Interstate 5 — and that freeway creates a genuine psychological and practical divide. The commercial corridors along the westside arterials bring some property crime exposure, particularly vehicle-related. Interior residential pockets are calmer, but the mix of commercial strip and residential here means doing block-by-block research rather than relying on neighborhood-level generalizations.
Best for: Value buyers who don't mind doing specific street-level research before committing to an area.
Northwest Olympia
Northwest Olympia is one of the city's established quieter residential corridors. The Hands On Children's Museum draws families to the area, and the neighborhood's layout keeps it relatively insulated from the commercial corridor activity that drives property crime elsewhere. Among the neighborhoods that aren't at significant geographic distance from downtown, this one typically sees a more favorable crime environment.
Best for: Families School households who want proximity to central Olympia amenities with a calmer residential feel.
Bigelow Highlands
Bigelow Highlands sits at the northern edge of the city, with larger lots and significant separation from the downtown corridor. It's the neighborhood that consistently surprises newcomers who arrived expecting citywide crime averages to apply here — they don't. The elevation and layout mean less cut-through traffic, fewer commercial nodes, and a crime environment that tracks closer to Lacey or Tumwater than to downtown Olympia.
Best for: Privacy Views buyers who want Olympia's amenities accessible but not at their doorstep.

How Olympia Compares to Lacey and Tumwater
If you're weighing the South Puget Sound area broadly, the comparison to Olympia's immediate neighbors is the most useful benchmark available — not a comparison to distant Seattle or a national average that papers over regional variation.
Lacey and Tumwater both record lower crime rates than Olympia across violent and property categories. That gap is meaningful and consistent across data sources, and it's the primary reason some prospective residents — especially those doing safety-first research — end up choosing one of those two cities over Olympia proper.
What That Comparison Actually Means for You
Lacey, immediately east of Olympia along I-5, has grown significantly over the past decade and carries a more suburban crime profile. Tumwater, directly to the south, is smaller and posts similarly lower figures. Neither city carries the downtown-capital-campus distortion that inflates Olympia's per-capita numbers.
The honest read: if raw crime rate is your primary filter, Lacey and Tumwater clear a lower bar than Olympia. If you're willing to look at neighborhood-level patterns within Olympia — specifically Northeast Olympia, Bigelow Highlands, and Southeast Olympia — the gap between those specific areas and Lacey or Tumwater narrows considerably.
What you give up by choosing Lacey or Tumwater is walkable access to the Capitol Theater, Percival Landing, the Olympia Farmers Market, and the other landmarks that make Olympia feel like a real city rather than an I-5 corridor suburb. That's a genuine trade-off, not a solvable problem.
| City | Violent Crime vs. Olympia | Property Crime vs. Olympia | Downtown Core Effect | Feel |
|---|---|---|---|---|
| Olympia | 5.65 / 1,000 (baseline) | 34.35 / 1,000 (baseline) | Significant inflation | Urban capital city |
| Lacey | Noticeably lower | Noticeably lower | Minimal | Suburban |
| Tumwater | Noticeably lower | Noticeably lower | Minimal | Small city / suburban |
| Yelm | Lower overall | Lower overall | None | Small town / rural adjacent |
| DuPont | Substantially lower | Substantially lower | None | Planned community |
| Shelton | Comparable or higher | Comparable or higher | Moderate | Small city, more isolated |
DuPont, farther north toward Tacoma along I-5, posts among the lowest crime figures in the region — but the commute structure and community character there are entirely different from what draws people to Olympia in the first place.
Looking to buy in Olympia? Estimate your payment.
Enter your numbers to see an estimated monthly mortgage payment.
Estimate only. Excludes HOA fees and mortgage insurance. The interest rate above is a starting point, not a quoted rate — replace it with your own to see real numbers. Insurance is a flat placeholder, not a Olympia quote.
What Olympia Is Doing About Public Safety
Olympia has made some genuinely unusual investments in public safety infrastructure that are worth understanding — both because they reflect the city's specific challenges and because they affect what day-to-day public safety response looks like here.
The Crisis Response Unit
The Olympia Police Department operates a Crisis Response Unit — known locally as the CRU — of 12 non-commissioned, non-armed first responders, funded by the city's 2017 public safety levy. The mobile unit operates seven days a week from 6:20 AM to 3 PM, responding to calls triaged through Thurston County 911. In 2023, the mobile team handled 3,212 calls for service.
A downtown walking unit was added in January 2024 and handled 934 calls for service in its first six months alone. That unit operates Tuesday through Saturday, 11 AM to 7 PM — specifically designed to address the visible disorder that concentrates in the Capitol campus and Percival Landing corridor without defaulting to armed law enforcement for every interaction.
This model won't be familiar to people moving from cities with more traditional policing structures. It reflects Olympia's particular mix of population and political culture — and by the numbers, it's handling a significant volume of calls that would otherwise fall to sworn officers.
Neighborhood Watch and Transparency Tools
The Olympia Police Department runs an active neighborhood watch program, connecting residents directly with OPD communication channels and encouraging localized crime reporting. In May 2025, OPD launched a public performance-tracking dashboard at olympiawa.gov, publishing regular crime and response data that any prospective or current resident can monitor directly.
That dashboard is worth bookmarking before you decide on a neighborhood. Seeing which blocks generate repeat calls versus which areas are genuinely quiet is more useful than any single annual crime rate figure.
A Human Friction Moment: What Six Months Reveals
Residents who move to neighborhoods near the downtown core — particularly the blocks between the downtown transit center and the social services corridor — frequently report that the visible unhoused population is more concentrated than they anticipated. It's not random or spread across the city. It's specifically the four or five blocks radiating from the downtown transit center and the shelter facilities on State Avenue. People who move to Northeast Olympia or Bigelow Highlands without visiting downtown first are sometimes genuinely surprised when they come downtown to the Farmers Market and see an environment that reads quite differently from their own street. That contrast is real, and understanding it before you choose a neighborhood matters more than the citywide rate does.
Practical Safety Research: What to Actually Look At Before Choosing an Area
Citywide crime rates are a starting point, not a conclusion. Here's how to do meaningful safety research specific to Olympia's actual patterns.
Use the City's Public Safety Dashboard
The Olympia Police Department's performance dashboard, launched in May 2025 at olympiawa.gov, publishes crime and response metrics on a regular cadence. Pull the call-for-service data by area and look at which specific corridors generate the highest volumes. You want to see the granular block-level patterns, not just the citywide total.
Understand the Larceny-Theft Concentration
Roughly 62% of all reported crime in Olympia is larceny-theft, and that category concentrates in commercial zones, downtown parking structures, and transit-adjacent blocks. If you're evaluating a residential street in Northeast Olympia or Bigelow Highlands, the citywide property crime rate is almost entirely irrelevant to your daily life on that street. What matters is whether the specific block you're considering has direct adjacency to those commercial corridors.
This is the single most common mistake prospective residents make: treating the 34.35 property crime rate as if it applies evenly to every address in the city. It does not.
Check Neighborhood Watch Coverage
The Olympia Police Department's neighborhood watch program lists active groups through the city website. A block with an established neighborhood watch and engaged neighbors tends to see faster incident reporting and higher clearance rates for the kind of property crime — package theft, vehicle prowl — that affects residential areas. It's a low-friction signal about how organized and connected a specific block is.
Visit at Different Times
Downtown Olympia on a Saturday morning at the Farmers Market and downtown Olympia on a Tuesday evening near the downtown transit center are materially different environments. If you're considering any address within a half-mile of the Capitol Campus or the State Avenue corridor, visiting at multiple times of day before committing to an area will tell you more than any data set. The daytime energy around Percival Landing, Capitol Lake, and the Capitol Theater corridor is genuinely appealing. The overnight environment in certain adjacent blocks is more challenging.
Compare Specific Streets, Not Neighborhoods
Olympia's neighborhood boundaries are loose enough that a "Southeast Olympia" address could be a quiet cul-de-sac three miles from downtown or a block directly adjacent to a commercial arterial. Within every neighborhood designation, there is meaningful variation. Pull the city's public safety dashboard and the neighborhood watch directory to narrow from neighborhood to street before finalizing your thinking about where to land.
Local Expert Takeaway: Olympia's 5.65 violent crimes and 34.35 property crimes per 1,000 residents sound alarming until you understand that the Capitol campus, the downtown transit center, and the social services corridor drive a disproportionate share of those numbers. On the streets of Northeast Olympia, Bigelow Highlands, and Southeast Olympia, daily life looks nothing like the citywide rate. The smarter move is to pull OPD's public performance dashboard at olympiawa.gov, check neighborhood watch activity on the specific streets you're considering, and visit the downtown corridor on a weekday evening before you decide whether the capital-city energy is something you want nearby or something you'd rather trade for the quieter environment that Lacey or Tumwater offers instead.
Quick Takeaways & FAQs
✅ Olympia's 2024 crime total fell roughly 5% year-over-year, and motor vehicle theft dropped by approximately 29% — the trend is moving in the right direction.
⚠️ The citywide property crime rate of 34.35 per 1,000 is heavily inflated by the downtown Capitol corridor; residential neighborhoods like Bigelow Highlands and Northeast Olympia experience significantly lower exposure.
📍 OPD's Crisis Response Unit fielded 3,212 calls in 2023 without armed officers — a model uncommon enough that newcomers from other states are often surprised to learn it exists.
Is Olympia, WA a safe place to live?
How does Olympia's crime rate compare to Lacey and Tumwater?
What type of crime is most common in Olympia?
Is the Olympia crime rate improving or getting worse?
What is Olympia's Crisis Response Unit and how does it affect safety?
Moving to Washington?
Tell us what you need help with and we'll connect you with local resources.
