
People moving to Arlington from busier Puget Sound cities often arrive with a single question: is this small Snohomish County town actually as quiet as it looks? The honest answer is mostly yes — with one important caveat about where in the city you're spending your time. Arlington sits along US-9 and I-5 roughly 40 miles north of Seattle, and that freeway access shapes more than just the commute. It also shapes which parts of town absorb regional commercial traffic — and the lower-level disorder that tends to follow it.
The numbers paint a reasonably reassuring picture. Arlington's violent crime rate of 3.4 per 1,000 residents (federal crime reporting data, 2024) essentially mirrors both the national average and the Washington State average. That figure isn't a marketing claim — it's a meaningful signal for a city of about 22,000 people positioned between Marysville to the south and Stanwood to the northwest. Property crime is the more relevant concern here, as it is across nearly every Pacific Northwest city, and that story has its own nuance worth understanding before you settle on a neighborhood.
The broader trend line is moving in the right direction. Arlington's overall crime rate dropped roughly 26% in 2025 compared to 2024, according to City-Data.com statistics. Washington State as a whole saw violent crimes fall 7.6% and property crimes fall 13.4% in 2024 per the Washington Association of Sheriffs and Police Chiefs (WASPC) annual report — so Arlington is tracking with a genuine statewide improvement, not just a statistical blip. That context matters when evaluating any single year's numbers.
This guide breaks down Arlington's crime statistics against state and national benchmarks, maps the safety picture across the city's distinct neighborhoods, identifies where property crime concentrates, and explains what the Arlington Police Department is actually doing about it — so you can evaluate safety with real information rather than gut feelings or real-estate-agent reassurances.

Arlington Crime Rates vs. State and National Averages
The most useful frame for Arlington's crime numbers isn't a comparison to an idealized suburb — it's a comparison to where the data actually places it.
| Geography | Violent Crime (per 1,000) | Property Crime (per 1,000) |
|---|---|---|
| Arlington, WA | 3.4 | 22.2 |
| Washington State | ~3.3 | 24.67 |
| United States (national) | 3.59 | 17.6 |
| City-Data Composite Index (Arlington) | 172 vs. U.S. average 228.4 — Arlington scores better | |
* Violent and property crime figures from federal crime reporting data, 2024. City-Data composite index as of 2025.
The Violent Crime Picture
Arlington's violent crime rate of 3.4 per 1,000 sits a hair below the national figure of 3.59 per 1,000 and is essentially level with Washington State's rate of approximately 3.3 per 1,000. You're not getting a dramatic safety premium over the state average here, but you're also not absorbing a meaningful penalty for living outside a larger city.
In real terms for a city of about 22,000 people, the 2025 data reported just one homicide — down from two the prior year. That's not statistical noise; it reflects a genuinely low-violence environment by any reasonable measure.
The Property Crime Reality
Property crime is where Arlington's numbers demand honest attention. At 22.2 per 1,000, the city runs noticeably above the national figure of 17.6 per 1,000. That gap is real and shouldn't be dismissed.
What softens that headline: Washington State's own property crime rate of 24.67 per 1,000 ranks third-highest in the nation, meaning Arlington actually performs below the statewide average. Living in Western Washington means accepting a higher property crime baseline than most of the country — that's a statewide condition, not an Arlington-specific failure.
The City-Data composite crime index — which weights serious and violent crimes more heavily than minor property incidents — places Arlington at 172 against a U.S. average of 228.4. On a holistic, weighted basis, Arlington comes out meaningfully better than the national benchmark.
One Structural Context You Should Know
Washington ranks last in the country — 51st out of 50 states and the District of Columbia — for police officers per capita, with 1.38 officers per 1,000 residents against a national average of 2.31, per WASPC's 2024 annual report. That staffing gap shapes response times and patrol presence across every Washington city, not just Arlington. It's worth knowing before you interpret any comparative crime figure as a pure reflection of local conditions.
Where Crime Concentrates: The Smokey Point Distinction
Not all of Arlington carries the same risk profile, and the city itself is candid about the divide.
The Commercial Corridor Effect
The Smokey Point area — Arlington's commercial strip along I-5 near the city's northern edge — is specifically identified on the Arlington Police Department's own Community Outreach Team page as an area that attracts individuals experiencing homelessness. Commercial corridors with high retail density and freeway proximity tend to generate the kind of property crime — vehicle break-ins, retail theft, opportunistic theft from parking lots — that pulls a city's overall property crime rate upward without meaningfully affecting residential blocks.
If your daily life involves driving through or shopping in the Smokey Point commercial zone, you should be aware of that environment. If you're considering a home in the residential neighborhoods that sit east or west of the commercial corridor, that distinction matters considerably when reading the citywide property crime figure.
The Residential Neighborhoods
Neighborhoods like Gleneagle, Hilltop, and Arlington Heights sit in quieter residential settings that feel removed from the commercial-corridor dynamics entirely. These are the areas where Arlington's crime profile approaches what most people would intuitively expect from a Pacific Northwest small city of this size — calm streets, neighbors who know each other, and property crime concerns that center on unlocked cars rather than anything more serious.
Old Town, closer to the Stillaguamish River and the city's original core, has its own character. Legion Memorial Park anchors that part of the city, and the Centennial Trail draws consistent foot traffic — both assets that tend to support an active, eyes-on-the-street environment that informal safety research consistently associates with lower crime perception.
The Practical Takeaway Before You Decide on a Neighborhood
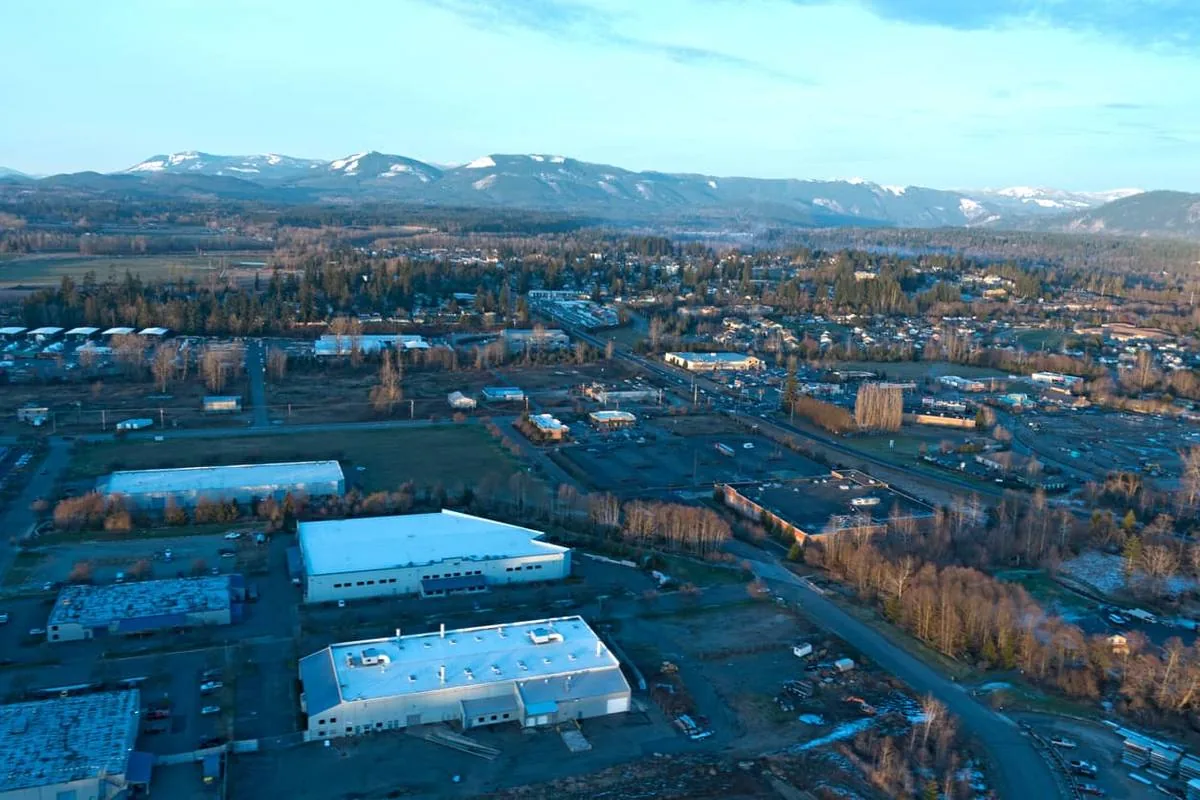
The single most useful thing you can do when evaluating a specific address in Arlington is to identify which side of the I-5 commercial zone it sits on, and how close it is to the Smokey Point retail cluster. That geographic question will tell you more about your day-to-day safety experience than the citywide rate alone.
Trending in the Right Direction: Recent Crime Data
Year-over-year snapshots can mislead, but Arlington's recent trend is consistent enough to be meaningful.
The 2025 Drop
Arlington's overall crime rate fell approximately 26% in 2025 compared to 2024, per City-Data.com statistics. That's a substantial single-year movement, not a rounding error. Paired with the single homicide recorded in 2025 — the lowest figure in recent years — the direction of travel is encouraging for anyone evaluating Arlington as a long-term home.
That drop also tracks with Washington State's broader 2024 improvement: the WASPC annual report, released in July 2025, documented a 7.6% statewide decline in violent crimes and a 13.4% drop in property crimes compared to 2023. Arlington isn't bucking a regional trend — it's moving with it, and possibly outpacing it.
National Context
Nationally, 2024 crime data showed violent crime falling an estimated 4.5% from 2023, with the 2024 national violent crime rate described as the lowest recorded since 1969. The environment in which Arlington's numbers sit is one of genuine, broad-based improvement — not a temporary blip driven by pandemic-era anomalies working themselves out.
What Experienced Locals Will Tell You
People who have lived in Arlington for a decade will tell you the city feels noticeably different from five years ago — in a positive direction. The Centennial Trail, which runs through the city, sees consistent use year-round, and that kind of active public infrastructure tends to track with neighborhoods that feel safe in practice, not just on paper. First-time visitors often expect a rougher edge based on the proximity to the I-5 corridor and are genuinely surprised by how quiet the residential areas feel on a weekday afternoon.
Looking to buy in Arlington? Estimate your payment.
Enter your numbers to see an estimated monthly mortgage payment.
Estimate only. Excludes HOA fees and mortgage insurance. The interest rate above is a starting point, not a quoted rate — replace it with your own to see real numbers. Insurance is a flat placeholder, not a Arlington quote.
What the Arlington Police Department Is Actually Doing
Raw statistics only tell part of the story. How a department approaches public safety — particularly in a smaller city where resources are finite — shapes the lived experience as much as the numbers do.
Community Policing Infrastructure
The Arlington Police Department runs a dedicated Crime Prevention program that includes community education initiatives and a Radar Trailer program — a loaner device that residents can deploy in their neighborhood to monitor traffic speeds and generate data about patterns that sometimes precede other disorder. The non-emergency tip line (425-407-3999) is actively promoted, which signals a department that wants residents to report problems rather than absorb them quietly.
The Embedded Social Worker Program
The most distinctive element of Arlington's public safety approach is the Law Enforcement Embedded Social Worker Program, operated by the APD Community Outreach Team in partnership with the Snohomish County Sheriff's Office and Marysville Police. The program specifically targets individuals experiencing homelessness and those dealing with addiction, connecting them with services and housing rather than cycling them through enforcement alone.
This matters for the safety picture because it addresses a root cause of the property-crime concentration in areas like Smokey Point — where displacement, untreated addiction, and opportunistic theft tend to cluster together. A department that recognizes that dynamic and funds a proactive response to it is doing something that reactive enforcement alone can't accomplish.
The Staffing Caveat
Washington's last-in-the-nation ranking for police officers per capita — 1.38 per 1,000 residents versus the national average of 2.31 — is a real structural constraint that affects Arlington along with every other Washington city. The APD's partnership model with Snohomish County and Marysville Police is partly a practical response to that limitation. Don't expect the kind of patrol density you'd see in comparably-sized cities in Texas or Florida; the embedded social worker model reflects what effective policing looks like when staffing is structurally constrained.
Practical Safety Research for Arlington: What to Check
Statistics are a starting point. Here's how to translate them into a real evaluation of a specific area.
Ask the Right Geographic Question First
Before going deep on any data source, identify where your prospective neighborhood sits relative to the I-5 and US-9 commercial corridors. Smokey Point's retail density and freeway access create conditions that don't apply to West Arlington, Gleneagle, Edgecomb, or Arlington Heights. The citywide property crime rate of 22.2 per 1,000 is a meaningful average — but averages blend very different environments.
Use Multiple Data Sources, Not Just One
City-Data.com's composite index (172 vs. the U.S. average of 228.4) and the raw figures derived from federal crime reporting tell a slightly different story because they weight crime types differently. Neither is wrong — they're measuring different things. The composite index, which emphasizes serious and violent crimes, will feel more relevant if your concern is personal safety; the raw property crime rate will feel more relevant if your concern is vehicle break-ins and home burglary.
The Six-Month Surprise
Newcomers to Arlington who move from the Seattle or Bellevue metro consistently report the same thing around month six: the city is quieter than they expected, but the Smokey Point commercial strip took some getting used to, particularly for anyone whose route to the freeway runs through it daily. It's not a dangerous stretch in any serious sense — but the visible signs of homelessness and retail-corridor disorder are more pronounced there than in the residential areas, and some residents find that jarring after a move from a more insulated suburb.
Seasonal Patterns Worth Knowing
Property crime in Pacific Northwest cities tends to tick upward during the wetter months, when reduced visibility and longer nights create more opportunity for vehicle break-ins and porch theft. Arlington is no exception. Residents in lower-lying areas near the Stillaguamish River also monitor river conditions each winter — flooding events don't create crime, but they do concentrate displacement and transient movement in ways that can temporarily affect the feel of adjacent neighborhoods.
Tools and Resources
The Arlington Police Department's Crime Prevention page at arlingtonwa.gov is the most direct local resource for neighborhood-level guidance. For residents who want to engage with the city's outreach response in Smokey Point specifically, the Community Outreach Team page explains the embedded social worker program and provides direct contact for reporting concerns that fall outside traditional enforcement. Both are worth bookmarking before you decide on a specific part of the city.

Local Expert Takeaway: Arlington's safety profile is genuinely better than its Pacific Northwest location might suggest — violent crime tracks the national average, property crime sits below the Washington State average, and the overall crime rate dropped 26% in 2025. The honest nuance is that Smokey Point's commercial corridor concentrates most of the property crime that inflates the citywide figure, while residential neighborhoods like Gleneagle, Hilltop, and Arlington Heights feel substantially quieter. If you're evaluating a specific address, the single most useful question is how close it sits to the I-5 commercial strip — not what the citywide average says.
Quick Takeaways & FAQs
✅ Arlington's composite crime index of 172 scores meaningfully better than the U.S. average of 228.4, and violent crime sits essentially at the national rate — a stronger profile than many Pacific Northwest cities of similar size.
⚠️ Property crime at 22.2 per 1,000 runs above the national average, and the Smokey Point commercial corridor along I-5 concentrates the majority of that gap — residential neighborhoods tell a quieter story.
📍 The Arlington Police Department's embedded social worker program, run in partnership with Snohomish County and Marysville Police, specifically targets the homelessness and addiction dynamics that drive property crime in the Smokey Point area.
What is Arlington WA's crime rate compared to the national average?
Which parts of Arlington WA have the most crime?
Is Arlington WA safe for families?
How does Arlington WA's property crime compare to other Washington State cities?
Is crime in Arlington WA getting better or worse?
Moving to Washington?
Tell us what you need help with and we'll connect you with local resources.
