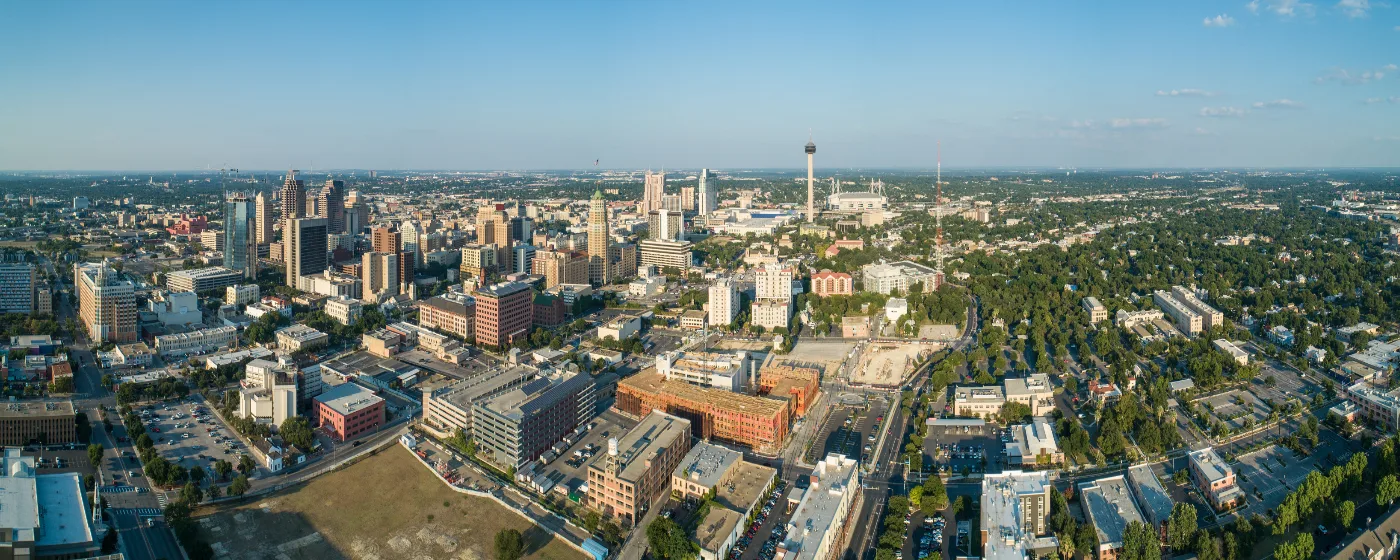
San Antonio gets flagged as unsafe more often than it deserves — and also gets defended more cheerfully than the numbers fully support. The honest answer sits somewhere in between, and it depends almost entirely on where in the city you're talking about. With a population of 1,548,422, San Antonio is the 2nd-largest incorporated city in Texas, and its sheer scale means that city-wide crime averages obscure the difference between neighborhoods that feel genuinely quiet and areas that carry real risk. Treating the whole city as one safety unit is the most common mistake relocating buyers make here.
The headline figures: San Antonio carries a violent crime rate of 5.94 per 1,000 residents and a property crime rate of 46.24 per 1,000 residents. Both sit above the Texas state averages and above national benchmarks. That context matters. But so does the trajectory: SAPD has been reporting meaningful, sustained crime declines since 2022, and the 2025 numbers continue that direction. A city moving this consistently in the right direction reads differently than one where a single good year followed a string of bad ones.
One methodological note worth understanding before you compare these figures: SAPD reports crime using the FBI's National Incident-Based Reporting System (NIBRS), which classifies serious offenses into Group A categories. Cities that still use older summary-based reporting systems often capture fewer incident types, which can make their numbers look lower by comparison — not because crime is lower, but because the counting method is less comprehensive. When you see San Antonio's property crime rate look dramatically higher than a smaller Texas city's, NIBRS is part of the explanation.
This guide walks through what the city-wide rates actually mean, where crime concentrates geographically, which neighborhoods carry the lowest risk, what SAPD is doing about the numbers, and the honest caveats that any thorough safety picture requires.

San Antonio Crime Rates in Context
The numbers above a city's average tell one story. The trend line tells another. San Antonio's violent crime rate does run above state and national figures, and that is worth acknowledging plainly rather than explaining away. But the direction of travel over the past two years is hard to dismiss.
SAPD reported 127 homicides in 2024 — the lowest count in a non-pandemic year since 2019, and a sharp drop from the peak of 231 homicides in 2022. Total Group A crime fell 5.9% in 2024, with violent crimes against persons down 2.4%. Through the first eleven months of 2025, overall crime fell more than 13% compared with the same period in 2024, with property crime off roughly 18% and crimes against persons down about 9%.
These are not rounding-error fluctuations. A city of this size moving crime numbers by double digits in successive years reflects something structural, not statistical noise. The question for anyone deciding on a neighborhood is whether that improvement is concentrated in areas they're considering — and the honest answer is that it's uneven.
The One Number That Runs Against the Trend
Reported rape increased 23% in the first half of 2025 compared to the same period in 2024, the largest jump among Texas cities tracked by the Major Cities Chiefs Association in that period. Robbery fell nearly 20% and aggravated assaults were down 6% over the same window, so the increase stands out as a specific exception to the broader decline. It is one reporting period, not a multi-year pattern, but it is real and worth naming rather than burying.
Vandalism and criminal mischief also bucked the 2024 downward trend, rising 26% even as property crime overall fell 7.7%. If you park on the street or leave a vehicle unattended in certain commercial corridors, that is the category most likely to affect you — not the violent crime that dominates the headlines.
Where Crime Concentrates: San Antonio's Geographic Reality
San Antonio has roughly 300 neighborhoods. The city-wide crime rate tells you almost nothing useful about which ones to avoid and which ones to seek out. The spread is wide: the north side of the city records the fewest violent crime incidents per year, while the east side and parts of the central city see significantly more — a difference large enough to be the deciding factor in any neighborhood decision.
The directional pattern is consistent across multiple data sources. The east side of San Antonio carries the highest concentration of both violent and property crime. The north side generally records the fewest violent crime incidents per year and is considered the safest directional quadrant in the city. That divide shapes the entire conversation about where families with school-age children end up, and it maps almost directly onto the freeway structure — the inner and outer loops act as rough boundary markers as you move outward from the core.
What This Means in Practice
The central city — the areas immediately around the River Walk, downtown, and the older inner-ring neighborhoods — has the highest foot traffic and the highest crime density. That doesn't make it unlivable; thousands of people live in Midtown and Southtown specifically because of the walkability and the neighborhood energy. But it does mean the risk profile is different from a master-planned subdivision in the far north.
The Midtown cluster — Tobin Hill, Five Points, Beacon Hill, and Alta Vista — sits closer to the urban core, where crime rates run comparatively higher. The same is true of Southtown and the King William Historic District. Both areas attract residents who accept that tradeoff in exchange for access to the city's culture and walkable streets. Neither area is categorically dangerous, but neither is it the same risk environment as the city's northern neighborhoods.
For a fuller look at what each neighborhood is like to actually live in day to day, the neighborhoods guide covers the character and fit of each one.

San Antonio's Safer Neighborhoods: What the Data Shows
The north side consistently outperforms the rest of the city on safety metrics, and two neighborhoods in particular come up repeatedly in crime analysis: Stone Oak and The Dominion.
Stone Oak
Stone Oak sits in the far north of the city, developed as a master-planned community with the kind of suburban infrastructure — wide streets, newer construction, grocery-anchored retail corridors — that tends to correlate with lower crime rates. It is consistently cited among the city's lower-crime areas in analyses drawing on SAPD and FBI data. Families with school-age children make up a significant share of the residents here, and the neighborhood's design reflects that. It runs above the city-wide typical home price — for the full picture on what that means in dollar terms, see the cost of living page.
The Dominion
The Dominion operates as a gated community in the northwest, which by design limits access and produces a different security environment than a standard neighborhood. It is frequently cited for its low crime profile and draws residents who prioritize that combination of privacy and a controlled perimeter. It also runs above the city-wide typical home price.
Monte Vista and Northwest Side / Medical Center
Monte Vista, one of San Antonio's most architecturally significant historic neighborhoods, sits closer to the urban core than Stone Oak or The Dominion. Its safety profile is more variable than the far-north neighborhoods, though it remains a well-established area with an active residential community. The Northwest Side near the medical center district is a broad corridor that houses a significant share of the city's healthcare workforce and generally records lower violent crime rates than the east or central city.
| Neighborhood | General Safety Profile | Best For |
|---|---|---|
| Stone Oak | Among the city's lowest-crime areas, north quadrant | Families Quiet |
| The Dominion | Gated, low crime, controlled access | Luxury Privacy |
| Monte Vista | Established historic area; more variable than far north | Walkable Character |
| Northwest Side / Medical Center | Below-average violent crime; broad, sprawling corridor | Commuter Families |
| Midtown (Tobin Hill / Five Points) | Higher than city average; urban core risk profile | Walkable Renters |
| Southtown / King William | Elevated relative to north; accepted tradeoff for culture access | Walkable First-Time |
| Alamo Ranch | Far northwest, suburban; lower crime density | Families Value |
Looking to buy in San Antonio? Estimate your payment.
Enter your numbers to see an estimated monthly mortgage payment.
Estimate only. Excludes HOA fees and mortgage insurance. The interest rate above is a starting point, not a quoted rate — replace it with your own to see real numbers. Insurance is a flat placeholder, not a San Antonio quote.
What SAPD Is Doing — and Whether It's Working
The crime declines of the past few years are not accidental. In 2022, SAPD partnered with University of Texas at San Antonio criminologists on a multi-phase Violent Crime Reduction Plan — one of the more rigorously designed policing interventions a Texas city has attempted in recent years.
Hot-Spot Policing: The Mechanics
Phase one centered on hot-spot policing: patrol officers stationed themselves with emergency lights activated in identified high-crime locations for 15-minute intervals during peak crime periods. The theory — that a visible, rotating police presence disrupts the conditions that allow crime to occur — played out in the data. The strategy produced a 37% drop in violent crime in targeted areas and a 7.3% citywide decline in violent incidents in its first year.
That result is significant enough that the city is now using it as the justification for a larger investment. As of early 2026, San Antonio is pursuing a plan to hire 360 additional patrol officers over three to five years, with the Violent Crime Reduction Plan results cited directly in the council discussions.
Response Times Are Improving
Emergency response times improved to an average of 5 minutes 29 seconds through November 2025, down from 5 minutes 56 seconds in 2024 and 6 minutes 20 seconds in 2023. Non-emergency response times also reached their fastest recorded pace in at least three years. For a city of 1,548,422 people spread across one of the largest geographic footprints of any U.S. city, a sub-six-minute average emergency response is a meaningful operational benchmark.
The picture that emerges is a department that has adopted a data-driven approach and is producing measurable results — while still operating in a city where the structural conditions that drive crime (poverty concentration, geographic isolation of certain communities) remain real. The trend is encouraging. The baseline it's improving from is still elevated.
What to Actually Look For Before Choosing a Neighborhood
City-wide crime statistics are the starting point, not the answer. If you are comparing neighborhoods in San Antonio, the most useful thing you can do is look at crime data at the neighborhood or ZIP code level — not the city average, which averages together areas that function completely differently.
The Six-Month Surprise Most People Don't Anticipate
People who move to San Antonio from smaller Texas cities or from out of state often expect property crime to feel like a distant abstract risk. The category that catches newcomers off guard is not violent crime — it's vehicle break-ins and vandalism. SAPD's own data showed criminal mischief rising 26% even while other property crime categories fell. The practical implication: where you park matters, and some commercial corridors and apartment complexes see a noticeably higher rate of vehicle-related theft than the overall city numbers suggest.
Using Crime Data Effectively
CrimeGrade.org aggregates SAPD data at a granular level and lets you look at specific block clusters rather than ZIP codes. It is a useful supplement to SAPD's own crime mapping tool. Neither tool replaces spending time in a neighborhood at different hours — a Saturday afternoon and a weekday evening will tell you different things about what a block actually feels like to live on.
The directional geography is real and durable. If you are choosing between neighborhoods on the north side and neighborhoods in the central city or east side, you are making a genuine safety decision, not just a lifestyle preference. Both can work depending on what you're looking for — but going in without understanding that difference is how buyers end up surprised six months later.
For more on how these neighborhoods compare on character, housing stock, and who they tend to suit, the neighborhoods page covers each one in depth. For what it costs to live in the safer northern areas versus the city-wide typical home price of $249,689 (July 2026), see the cost of living breakdown.
What You Would Not Do
Anyone who has lived in San Antonio for more than a year will tell you the same thing: don't buy in an area solely because the price looks attractive without understanding which part of the city you're in. The east side's lower home prices reflect the risk environment, not hidden value waiting to be discovered. That is not a prediction about whether those neighborhoods improve — some are actively developing — but it is the honest framing for what the numbers currently show.
Local Expert Takeaway: San Antonio's crime rate is real, it runs above state and national averages, and it should not be hand-waved away. But the city is also producing some of the most sustained crime declines it has seen in years, driven by a documented policing strategy backed by University of Texas at San Antonio criminologists. The geographic split is the most important thing to understand: the north side — Stone Oak, The Dominion, the Northwest Side medical center corridor — operates in a fundamentally different risk environment than the central and east-side areas. Families with kids consistently end up in the north for exactly this reason. If you are serious about a specific neighborhood, run it through SAPD's crime mapping tool and CrimeGrade.org before you settle on a decision — the difference between adjacent ZIP codes in this city can be larger than the difference between two entirely different Texas cities.
Quick Takeaways & FAQs
✅ San Antonio homicides dropped to 127 in 2024 — the lowest non-pandemic count since 2019 — and overall crime continued falling through 2025, driven by a University of Texas at San Antonio-backed hot-spot policing strategy that cut violent crime 37% in targeted areas.
⚠️ San Antonio carries a property crime rate of 46.24 per 1,000 residents, which runs well above state and national averages, and criminal mischief rose 26% in 2024 even as other property crime categories fell — vehicle break-ins are a real, everyday concern in certain corridors.
📍 Stone Oak and The Dominion are consistently among the city's lowest-crime areas; the east side of San Antonio carries the highest concentration of violent and property crime — a geographic divide that shapes where most families with children ultimately land.
Is San Antonio safe to live in?
Which neighborhoods in San Antonio are the safest?
How does San Antonio's crime rate compare to the rest of Texas?
Is property crime a big problem in San Antonio?
What is SAPD doing to reduce crime in San Antonio?
Moving to Texas?
Tell us what you need help with and we'll connect you with local resources.
