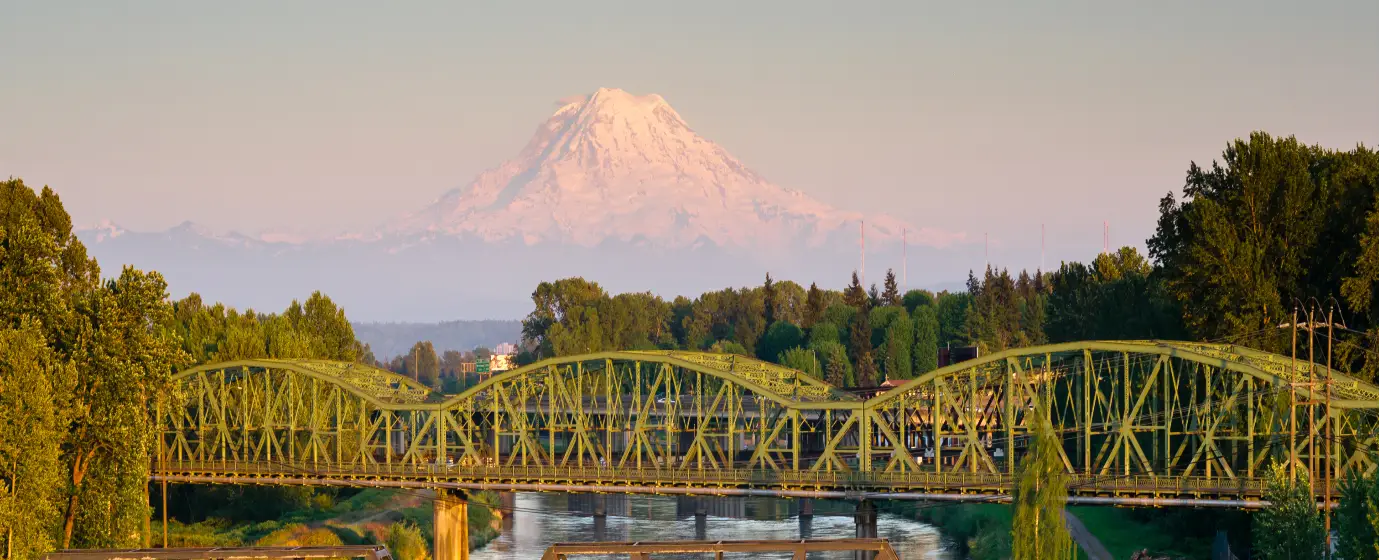
The number that stops people in their tracks when they research Puyallup is the property crime rate — 38 per 1,000 residents. That figure deserves a real explanation, not reassurance. Puyallup sits in Pierce County, roughly 35 miles south of Seattle along the SR-512 and SR-167 corridors, and it carries the crime profile you'd expect from a working city of 42,552 people embedded in one of the most property-crime-intensive states in the country. Understanding the numbers means understanding the context.
The violent crime picture is genuinely close to average. FBI 2024 data puts Puyallup's violent crime rate at 4 per 1,000 residents — modestly above the national figure but within a range that most families and residents find acceptable day-to-day. The property crime rate is the real story, driven almost entirely by larceny-theft and motor vehicle theft rather than crimes against persons. Washington State ranked 3rd in the nation for property crime in 2024, which means Puyallup is fighting a statewide tide, not just a local one.
The trend line matters as much as the snapshot. City-Data reports Puyallup's overall crime rate fell 29% in 2025 compared to 2024 — a sharp improvement on top of a multi-year decline in both violent and property crime. That trajectory, combined with a modest cost-of-crime estimate that sits below Washington State's own average, tells a more nuanced story than a raw number ever could.
This guide breaks down Puyallup's crime data by category, compares it honestly against state and national benchmarks, walks through the neighborhood-level safety picture, and gives you the practical detail you need to evaluate specific areas before deciding where in the city to put down roots.
Puyallup Crime Rates vs. State and National Averages
Two numbers define Puyallup's safety profile: a violent crime rate of 4 per 1,000 residents and a property crime rate of 38 per 1,000 residents, both drawn from FBI 2024 data.
| Geography | Violent Crime (per 100k) | Property Crime (per 100k) |
|---|---|---|
| Puyallup, WA | 374.7 | 3,868.9 |
| Washington State | 326–331 | ~2,467 |
| United States | 359 | ~2,100 (est.) |
* Sources: FBI UCR 2024 data; USAFacts; crimebycity.com.
The Violent Crime Picture
Puyallup's violent crime rate of 374.7 per 100,000 sits roughly 4% above the national rate of 359 per 100,000 — a difference that, in a city this size, amounts to a handful of additional incidents annually. The national 2024 rate of 359 per 100,000 was itself the lowest recorded since 1969, so the benchmark Puyallup is being measured against is an historically low one. Washington State's violent crime rate ran approximately 326–331 per 100,000 in 2024, meaning Puyallup runs modestly above both the state and national lines — but not dramatically so.
The Property Crime Reality
Property crime is where Puyallup's numbers look more serious, at 3,868.9 per 100,000. The catch is that Washington State ranked 3rd in the nation for property crime in 2024, with a statewide rate of approximately 2,467 per 100,000. Puyallup runs well above that state figure, which means this isn't purely a case of the state pulling the number up — the city does have an elevated rate. But it also isn't an outlier in isolation: projected crime-related costs in Puyallup run approximately $514 per resident annually in 2025, which is about $50 above the national average but roughly $96 below what the average Washington State resident faces. Within its own state, Puyallup is not the worst-performing city by this measure.
What's Driving the Property Crime Count
Larceny-theft dominated the 2024 numbers, with 1,078 reported incidents. Motor vehicle theft followed with 355 incidents. Both categories are consistent with Washington State's statewide pattern — the state had the highest per-capita rate of larceny-theft nationally and ranked 3rd for motor vehicle theft. In practice, this means the risk profile in Puyallup looks a lot like the risk profile across the Puget Sound region: protect your car, don't leave valuables visible, and understand that your greatest exposure is to opportunistic property crime, not violence.
Is the Trend Getting Better or Worse?
The trajectory in Puyallup is clearly improving. City-Data reports a 29% drop in overall crime in 2025 compared to 2024, building on a multi-year trend of declining violent crime and falling property crime figures. That's a meaningful shift in a short window.
The Statewide Tailwind
Puyallup isn't improving in isolation. Washington State's overall crime rate dropped 11.6% from 2023 to 2024, with violent crime specifically down 6.2% year over year. When a state with historically elevated property crime numbers posts that kind of systemic improvement, cities embedded in that system tend to benefit. Puyallup's own decline tracks closely with the broader state pattern.
What a 29% Drop Actually Means
A single-year 29% reduction is notable enough that it warrants some caution — large one-year swings can reflect changes in reporting methodology, staffing levels, or concentrated enforcement efforts as much as genuine behavioral change. The more durable signal is the multi-year direction: Puyallup has seen decreasing violent crime over the last five years, not just a one-year anomaly. Taken together, the short- and medium-term trends both point the same direction.
Police Staffing Context
Puyallup operates with 66 sworn officers and 78 full-time law enforcement employees total for a population of 42,552 — roughly 1.55 officers per 1,000 residents. That ratio is on the lower end for a city this size, which is worth understanding when you consider response times in outer residential areas versus the more heavily patrolled downtown core. The Puyallup Police Department has a dedicated community policing presence, but coverage density varies meaningfully depending on where in the city you are.
Neighborhood-Level Safety: Where You Live Matters
City-wide crime rates are averages, and averages can be misleading when a handful of concentrated areas are pulling numbers up. Puyallup's safety picture varies more by area than the overall figures suggest.
| Neighborhood / Area | General Safety Perception | Primary Concern (if any) | Best For |
|---|---|---|---|
| Northwest Puyallup / Manorwood | Among the safer residential areas in the city | Low concern — residential streets, limited commercial foot traffic | Families Quiet |
| Crystal Ridge | Quiet, elevated suburban feel | Minimal — hillside location limits pass-through traffic | Families Views |
| Summit | Established residential, generally calm | Low — suburban density, owner-occupied housing base | Quiet Value |
| South Hill | Moderate — varies by block | Vehicle break-ins in commercial parking areas; not a violent crime concern | Families Commuter |
| Sunrise | Mixed — older central neighborhood | Property crime, particularly larceny near arterial corridors | First-Time Value |
| North Puyallup / Puyallup Valley | Mixed — active industrial and residential blend | Elevated property crime near commercial corridors along River Road | Renter Value |
| Downtown Puyallup | Higher reported crime than residential areas | Larceny, vehicle theft, and transient-related incidents near Main Ave | Walkable |
The West-Side Pattern
Residents consistently describe the west side of Puyallup — anchored by Northwest Puyallup and the Manorwood area — as the calmer, lower-crime part of the city. The further you get from the downtown core and the high-traffic commercial corridors along SR-512 and Meridian, the more the crime statistics shift in your favor. This isn't just perception: CrimeGrade's 2025 analysis of Puyallup specifically identifies the western residential zones as the city's safest.
The Downtown Reality
Downtown Puyallup along E Main Avenue is the city's most walkable stretch — independent restaurants, the historic Pioneer Park, and weekend foot traffic all draw people to the area on evenings and weekends. It's a genuinely pleasant area during the day. But the downtown core also concentrates a disproportionate share of the city's reported incidents, partly because any larceny or vehicle theft in a commercial zone gets attributed to that neighborhood even when it has nothing to do with residential life there. Understand that dynamic before letting a downtown heat map scare you off — or lull you into leaving your car unlocked.
The Fairgrounds Effect
The Washington State Fairgrounds — which hosts the Washington State Fair every September and draws over a million visitors — sits squarely within the city's residential footprint. Each September, incident counts in the surrounding area spike visibly on crime maps. This is real data, but it reflects the concentrated volume of strangers and vehicles that descend on a finite area for 17 days, not the baseline risk that residents live with the other 348 days of the year. When you're reading any heat-map data for Puyallup, check whether the area near the Fairgrounds is pulling the surrounding neighborhood's numbers up. It almost certainly is, especially in September data.
For a deeper look at how these neighborhoods differ in character beyond safety, see the full Puyallup neighborhoods guide.
Looking to buy in Puyallup? Estimate your payment.
Enter your numbers to see an estimated monthly mortgage payment.
Estimate only. Excludes HOA fees and mortgage insurance. The interest rate above is a starting point, not a quoted rate — replace it with your own to see real numbers. Insurance is a flat placeholder, not a Puyallup quote.
What Property Crime in Puyallup Actually Looks Like Day to Day
The 38 per 1,000 property crime figure can feel abstract. What it translates to in practice is a city where your car, your garage, and anything left visible in a parking lot require consistent attention — but where violent crime against persons remains a secondary concern.
Motor Vehicle Theft Is the Number to Watch
355 motor vehicle theft incidents in a single year for a city of 42,552 people is a meaningful number. Certain older vehicle models — particularly pre-2001 trucks and SUVs — remain disproportionately targeted across Washington State, and Puyallup follows that pattern. If you're relocating with an older vehicle that doesn't have modern anti-theft systems, that's worth factoring into your parking habits from day one.
Larceny-Theft: Where and How
With 1,078 reported larceny-theft incidents in 2024, opportunistic theft from vehicles and retail areas accounts for the bulk of Puyallup's property crime. Shopping center parking lots along South Hill Mall Drive and the commercial corridors near Meridian see the highest concentration. The behavior pattern is consistent across Pierce County: unlocked cars, bags left on seats, and open garages are the primary targets. None of that requires sophisticated planning from a thief, and none of it requires you to have any personal contact with one.
What Surprises New Residents After Six Months
People who move to Puyallup from less property-crime-intensive states often describe the same adjustment: they arrive prepared for the violent crime concern they've read about online, and then their neighbor's car gets broken into. The violence concern fades quickly — the property crime vigilance never fully goes away. Developing the habit of treating your car like you'd treat it in a downtown Seattle garage — nothing visible, always locked, parked in lighted areas when possible — is the single most impactful behavioral shift most newcomers describe making.
Renter vs. Owner Exposure
If you're renting near the Sunrise neighborhood or along the North Puyallup corridors close to River Road, the property crime exposure is meaningfully higher than in the established owner-occupied subdivisions of Crystal Ridge or Manorwood. That's not a knock on any particular area — it reflects the national pattern that higher-density, higher-transience zones correlate with elevated property crime regardless of city. Renters who are particularly vehicle-dependent should weigh that when choosing between neighborhoods.
How to Read Puyallup's Safety Data Before Choosing an Area
Online crime maps are useful tools that are also regularly misread. Understanding their limitations is as important as knowing the underlying statistics.
Heat Maps Reflect Incidents, Not Risk to You
Every crime-mapping platform — AreaVibes, CrimeGrade, NeighborhoodScout — shows where incidents were reported, not where you personally are most likely to be affected. A block that shows red because it sits adjacent to a commercial corridor or a large public venue is not the same as a block where residents experience frequent crime. The area around the Washington State Fairgrounds is the clearest local example: the surrounding residential streets carry a heat-map signature that reflects fair-month commercial incidents far more than any chronic neighborhood safety issue.
Look at Crime Category, Not Just Crime Rate
When you're evaluating a specific area of Puyallup, break the data down by category. A neighborhood with elevated property crime but near-zero aggravated assault calls tells a very different story than one where both numbers are elevated. For most of Puyallup's residential zones, the violent crime component of any elevated overall figure is minimal — it's property crime carrying the number, and property crime responds well to behavioral habits and parking decisions in ways that violent crime does not.
Talk to Residents on Adjacent Blocks
The most reliable safety data in any city isn't on a map — it's from the people who live on the specific block you're considering. In Puyallup, that's especially true for the transitional areas between neighborhoods: the edges of Downtown Puyallup that blend into Sunrise, or the North Puyallup industrial-residential boundary along the Puyallup River corridor. A conversation at Pioneer Park on a Saturday morning will tell you more about block-level conditions than any aggregate statistic.
The One Thing Not to Skip
Before deciding on a neighborhood, check the specific street on Puyallup's public crime map rather than relying on a third-party aggregator's heat map. Pierce County and the City of Puyallup both publish incident-level data that lets you look at a 90-day or 12-month window for a specific address range. Most people skip this step. The ones who don't rarely have post-move surprises about safety.
Local Expert Takeaway: Puyallup's property crime rate is real and worth taking seriously — but it reflects a statewide Washington pattern as much as a local one, and the 2025 trend line is moving sharply in the right direction. If you're choosing between neighborhoods, put your attention on the west side of the city: the Manorwood, Crystal Ridge, and Northwest Puyallup areas consistently turn up as the calmer residential zones, while downtown E Main Avenue and the corridors near the Fairgrounds carry a heavier incident load that looks more alarming on a heat map than it feels to daily residents. Lock your car, park in lighted areas, and don't mistake larceny statistics for a dangerous city — the violent crime rate here sits within a few percentage points of the national average.
Quick Takeaways & FAQs
✅ Puyallup's violent crime rate is only modestly above the national average, and the city's overall crime rate dropped 29% in 2025 — a trajectory that reflects both local policing and a statewide Washington improvement trend.
⚠️ Property crime — especially motor vehicle theft and larceny-theft — is the real concern here, running well above national norms and requiring consistent behavioral habits around vehicle security and parking.
📍 The Washington State Fairgrounds draws over a million visitors every September, inflating crime heat-map readings for surrounding neighborhoods during fair month in a way that doesn't reflect year-round residential conditions.
Is Puyallup, WA a safe place to live?
Which parts of Puyallup are the safest?
What type of crime is most common in Puyallup?
How does Puyallup's crime rate compare to Tacoma?
Does the Washington State Fair affect crime in Puyallup?
Moving to Washington?
Tell us what you need help with and we'll connect you with local resources.
