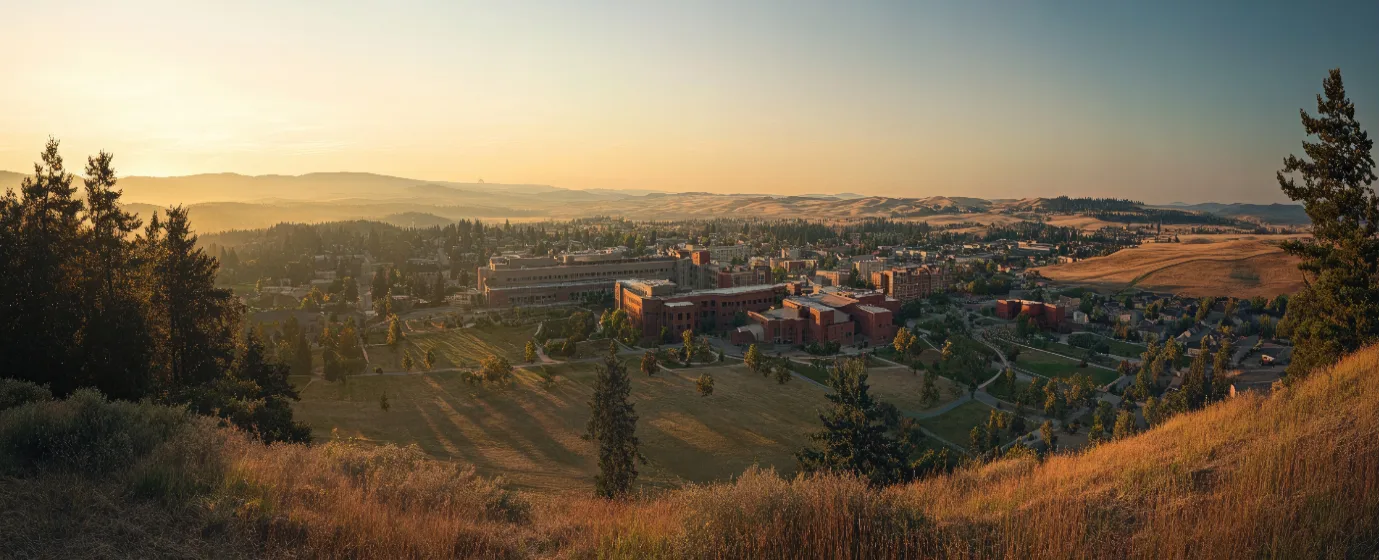
Most people researching Pullman start with the question nobody wants to type into Google: is this actually a safe place to live? It's a fair question for a city shaped by Washington State University — a campus of roughly 20,000 students that floods the population every fall and thins it every May. College towns have a reputation, and that reputation isn't always deserved. In Pullman's case, the data makes a clear argument: by both state and national standards, this is a low-crime city.
The numbers that matter most are violent crime. FBI 2024 data puts Pullman's violent crime rate at approximately 2 per 1,000 residents — a figure that sits more than 2.5 times below Washington state's own 2024 rate of roughly 326–329 per 100,000. The national rate that same year was 359 per 100,000, historically the lowest since 1969. Pullman comes in well below both benchmarks. That context matters, because Washington state as a whole has one of the higher property crime rates in the country, which makes Pullman's position as a relative outlier more meaningful, not less.
Property crime is the more honest concern here. With roughly 10 property crimes per 1,000 residents, larceny-theft and car break-ins are the crimes residents actually encounter — not violent incidents. Understanding that distinction changes how you think about where to park your car and where to rent versus where to put down roots. The Trailside Taproom by Paradise Creek Brewery on SE Riverview St and Roost Coffee & Market on SE Spring St sit in areas locals move through comfortably at night, which is its own kind of ground-level data point.
This guide breaks down Pullman's 2024 crime figures, explains what the WSU campus means for how statistics get calculated, maps safety patterns across the city's distinct neighborhoods, and gives you practical ways to research any specific area before you decide where to land.

Pullman's 2024 Crime Numbers in Context
The headline figure is this: Pullman's total crime index score from City-Data.com for 2025 is 108, compared to a U.S. average of 228.4 — meaning the city's overall crime rate is roughly 2.1 times lower than the national benchmark. That index continued a multi-year downward trend, falling another 1% from 2024 to 2025.
The year-over-year shift in 2024 alone was substantial. Total crime fell 19.4% from 2023 to 2024, with violent crime specifically dropping 30.4% in a single year, per FBI-reported data analyzed by crimebycity.com. These aren't rounding-error moves — they reflect a genuine and sustained improvement.
| Metric | Pullman (2024) | Washington State (2024) | U.S. Average (2024) |
|---|---|---|---|
| Violent crime per 1,000 | ~2 | ~3.3 | ~3.6 |
| Property crime per 1,000 | ~10 | Higher (3rd nationally) | ~19 |
| Total crime index (City-Data) | 108 | — | 228.4 |
| Safer than % of WA cities | 91% (areavibes) | — | — |
| Safer than % of U.S. cities | 76% (crimebycity) | — | — |
| YoY violent crime change | −30.4% | −7.6% | −4.5% |
Pullman ranks #6 of 87 reporting cities in Washington state by total crime rate — a standing that holds even as Washington's overall property crime rate remains among the nation's highest. Being safer than 91% of Washington cities, in that context, is a meaningful bar to clear.
One Caveat Worth Naming
Washington state ranked last in the country for police officers per capita in 2024, with 1.38 officers per 1,000 residents against a national average of 2.31. That staffing gap is a statewide condition that applies to Pullman too — it doesn't erase the low crime numbers, but it does mean response times during peak periods can be slower than residents in higher-staffed cities might expect.
What Type of Crime Actually Happens Here
Violent crime in Pullman is rare enough that most long-term residents have never experienced it or lived near an incident. Property crime is the reality check.
In 2024, larceny-theft accounted for 211 reported incidents — the dominant crime category by a wide margin. Burglary added another 50 incidents. Property crime outnumbers violent crime by 6.3 times, which means the practical safety question for most residents isn't about personal safety on the street; it's about unlocked cars, unattended bikes, and ground-floor apartment windows.
What Locals Actually Encounter
Bike theft around the WSU campus is a known and recurring problem, not a hidden one. Thousands of students commute by bike along the corridors connecting College Hill to campus, and an unsecured bike left near a lecture hall or along Stadium Way is a predictable target. This is one of those things nobody tells you until month two.
Car break-ins follow a similar logic. Vehicles left in surface lots near the stadium during Cougar football weekends — when Martin Stadium draws crowds that dwarf Pullman's everyday population — have historically seen elevated rates of opportunistic theft. It's a seasonal pattern tied to the academic and athletic calendar, not an indicator of baseline city risk.
The Student Population Factor
Per-capita crime rates in college towns carry a built-in complication: WSU's enrollment pushes Pullman's functional daytime population well above its official 33,543 resident count, but students aren't always counted consistently in the denominator. When enrollment is high, the per-capita rate looks lower than it might otherwise. When comparing Pullman's figures to non-college cities, keep that in mind — but the direction of the comparison (Pullman is safer than most comparable cities) holds regardless of how you weight it.

Neighborhood Safety: Where You Live Changes the Picture
Pullman's neighborhoods don't have dramatic safety divides the way larger cities do, but they do have meaningful differences in what kinds of incidents occur and how often. Understanding the character of each area is the better research tool than trying to find block-level crime maps, which often aren't granular enough to be useful at Pullman's scale. For a fuller look at neighborhood character and geography, see the best neighborhoods in Pullman guide.
College Hill
The densely rented hillside streets between campus and the surrounding residential blocks see the most foot traffic after dark. Property crime — especially bike theft and car break-ins — is the primary pattern here. The area runs loud on game days and during the first weeks of the fall semester, which is when opportunistic theft peaks.
Best for: People comfortable with urban-adjacent density who prioritize walkability over quiet. Watch: unattended property.
Downtown Pullman
Main Street and the surrounding blocks function as the city's commercial and social center. Tokyo Seoul on E Main St and South Fork Public House on S Grand Ave are anchors of the evening scene. Downtown sees the most foot traffic of any non-campus area and has proportionally more minor incidents — public disturbances, minor theft — but serious violent crime here is rare.
Best for: People who want to walk to dinner and don't need a quiet street. Watch: Friday and Saturday evenings during the school year.
Sunnyside
The rolling residential streets on Pullman's south side draw a mix of faculty, young professionals, and established families. Sunnyside sits far enough from the core student corridors that it rarely appears in property crime clusters. It has a quieter, more settled feel than College Hill.
Best for: Residents looking for a lower-incident, lower-noise baseline.
Military Hill and Pioneer Hill
These established residential neighborhoods sit on Pullman's hillsides away from the main student density. Lower turnover, longer-term residents, and little overlap with the late-night entertainment corridor make them among the quieter areas in the city's safety profile.
Best for: Those prioritizing residential calm and longer-term neighbors.
Grand Avenue Area and Terre View
The Grand Avenue corridor, where South Fork Public House anchors a stretch of mixed retail and residential, is one of Pullman's more active zones without the student-density pressure of College Hill. Terre View, farther out toward the city's edge, trends quieter with lower incident rates and more single-family housing stock.
Best for: Residents who want access without the density. Terre View suits those who prefer distance from the university's activity patterns.
Looking to buy in Pullman? Estimate your payment.
Enter your numbers to see an estimated monthly mortgage payment.
Estimate only. Excludes HOA fees and mortgage insurance. The interest rate above is a starting point, not a quoted rate — replace it with your own to see real numbers. Insurance is a flat placeholder, not a Pullman quote.
Dual Policing: Pullman PD and the University Police Department
Pullman operates with two law enforcement agencies covering overlapping geography. The Pullman Police Department serves the city proper; the university's own campus police department covers the WSU campus. For any incident that crosses the campus–city boundary — which is a blurry line in practice, given how the campus weaves into the surrounding neighborhoods — the two departments work jointly.
What This Means for Residents
Practically, this means the area around WSU is more heavily policed per square block than most of Pullman. The campus police department runs its own patrol, and the Pullman PD covers the city streets immediately outside campus — Stadium Way, Terre View Drive, and the residential corridors of College Hill fall under city jurisdiction but benefit from proximity to campus enforcement.
The Pullman Police Department also runs a visible community engagement program. Coffee with a Cop events, a Citizen Police Academy open to residents, a youth Explorer Program, and crime-prevention workshops coordinated directly with WSU are all active. These aren't just PR gestures — they reflect an agency that has invested in a working relationship with a population that turns over substantially every four years.
A Practical Note on Reporting
Because the campus police department and Pullman PD report separately, some crime statistics you find online may or may not include campus-reported incidents depending on the data source and year. If you're comparing Pullman's figures to another college town, verify whether campus crime is included or excluded in both datasets. The figures cited in this guide use FBI Uniform Crime Reporting data that typically captures city-reported incidents — campus incidents reported separately by the university police may not be fully reflected.
How to Research Safety Before Choosing a Specific Area
The city-wide figures tell you Pullman is safer than most Washington cities. They don't tell you whether the specific block you're considering is closer to the College Hill property-theft pattern or the quiet residential reality of Pioneer Hill. That research requires a few more steps.
Use the Right Tools
The Pullman Police Department publishes an online crime map that allows you to filter by incident type and date range. Before you settle on a neighborhood, run larceny-theft and burglary filters against a six-month window for the specific streets you're considering. A concentration of auto-theft reports near a particular parking area is actionable information; a blank map for a residential block several streets off the main corridors is reassuring.
City-Data.com's crime history graphs for Pullman show multi-year trend lines rather than a single snapshot. A block-level data tool like the Pullman PD's public portal gives you the geographic specificity; City-Data gives you the trend context. Use both together.
Ask the Right Questions When Touring
If you're walking a street near College Hill, look for how many properties have Ring cameras or motion-sensor lights at ground level — residents in higher-incident blocks self-select into visible deterrents, and you'll notice the difference between those streets and the quieter ones farther from campus. Ask a neighbor how long they've lived there and whether they've had anything taken. In a city this size, you'll usually get a straight answer.
The Seasonal Reality
Nobody warns newcomers about this: Pullman's safety profile shifts measurably with the academic calendar. The weeks around fall move-in (late August through mid-September) and Cougar football Saturdays at Martin Stadium produce noticeably different street conditions than a Wednesday morning in January. If your only visit to scout a neighborhood happens to fall during a home football game weekend, you're seeing Pullman in its highest-activity state — that's useful data, but it's not representative of a typical Tuesday.
The quieter version of Pullman — the one with graduate students at Roost Coffee & Market on SE Spring St on a weekday morning and sparse foot traffic on the residential hillsides after 9 p.m. — is what most days actually look like. Both versions are real. Make sure you've seen both before deciding.

Local Expert Takeaway: Pullman's violent crime rate sits well below both the Washington state average and the national figure — a meaningful distinction in a state that ranks among the highest for property crime nationally. The real day-to-day safety concern is property theft: bikes near campus, cars in surface lots on game days, and ground-floor units in the denser College Hill rental corridors. If you're choosing between neighborhoods, the quieter residential hillsides of Pioneer Hill and Military Hill offer a materially different profile than the blocks immediately surrounding WSU. Run the Pullman PD's crime map for the specific streets you're considering, visit once during a football weekend and once on a regular weekday, and you'll have a grounded picture of what you're actually moving into.
Quick Takeaways & FAQs
✅ Pullman's violent crime rate is more than 2.5 times lower than Washington state's 2024 average — one of the strongest safety distinctions in the region.
⚠️ Property theft — especially bike theft near WSU and car break-ins on football weekends — is the realistic concern, not violent crime.
📍 The Pullman Police Department and the university's campus police department coordinate jointly on incidents near the campus boundary, giving the university-adjacent neighborhoods an above-average enforcement presence.
Is Pullman, WA a safe place to live?
How does crime in Pullman compare to other Washington cities?
Does WSU affect Pullman's crime statistics?
Which Pullman neighborhoods have lower property crime?
Is it safe to walk around Pullman at night?
Moving to Washington?
Tell us what you need help with and we'll connect you with local resources.
