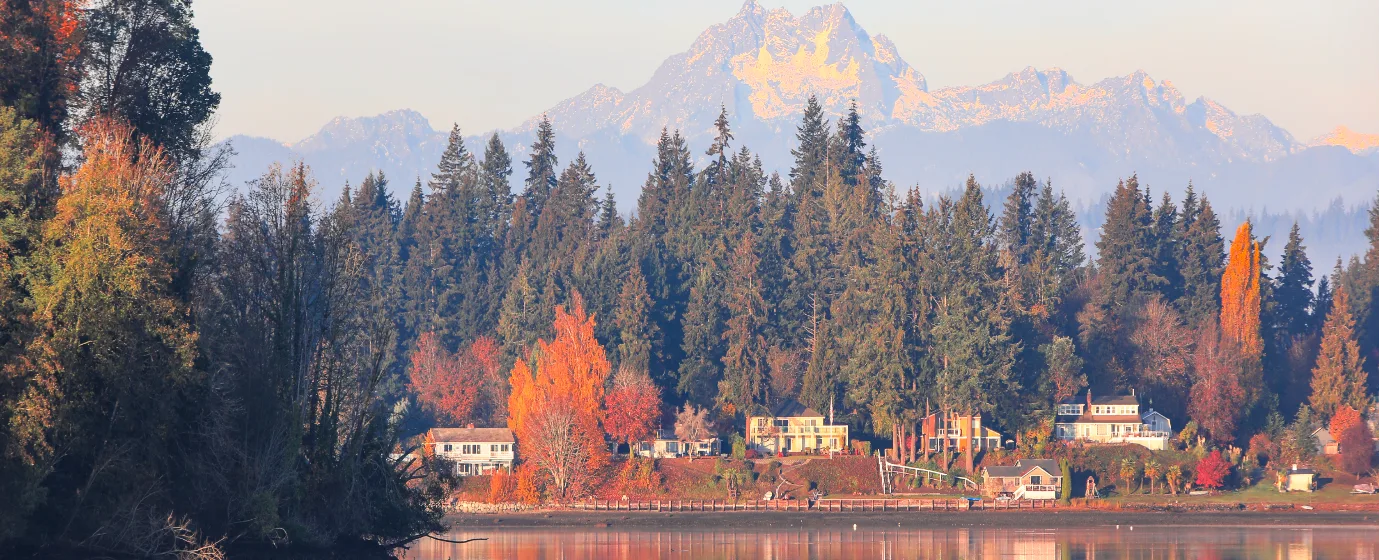
Maybe you've pulled up a crime-rate website, seen Bremerton's numbers, and started second-guessing the whole idea. That reaction is understandable — and also incomplete. Bremerton sits on Kitsap Peninsula across Puget Sound from Seattle, connected by one of the most heavily used passenger ferry routes in the country, and its crime statistics reflect a city doing real urban work: a working waterfront anchored by Puget Sound Naval Shipyard, a downtown that went through decades of disinvestment and is now clawing back, and a population of roughly 44,830 that skews younger and more economically mixed than its quieter Kitsap County neighbors like Silverdale or Poulsbo.
The city-wide numbers are genuinely elevated — a violent crime rate of 4.28 per 1,000 residents and a property crime rate of 37.71 per 1,000, per FBI UCR 2024 data. Those figures sit noticeably above Washington state averages and meaningfully above national ones. But raw city-wide rates are one of the least useful tools for evaluating whether a specific block, neighborhood, or daily routine will feel safe. The difference between the northwest side of the city and the southeast commercial corridors is not marginal — it's roughly the difference between a quiet suburb and a busy urban retail strip. Where you live inside Bremerton matters enormously.
The direction of travel also matters. Washington state posted its largest single-year crime reduction in recent memory between 2023 and 2024 — a 14.1% overall drop per FBI UCR data. Bremerton's motor vehicle theft, the single biggest driver of its elevated property crime rate, fell 34% year-over-year. The police department is in the middle of rebuilding a younger force and shifting toward proactive policing. None of that erases the current numbers, but it changes how you should read them.
Whether you're researching Bremerton for the first time or trying to narrow down which neighborhood to focus on, this guide breaks down the actual crime data, maps it to the city's specific neighborhoods, explains what the statistics do and don't tell you, and gives you a practical framework for evaluating safety street by street.
The Numbers in Context: How Bremerton Compares
Bremerton's violent crime rate of 4.28 per 1,000 residents sits approximately 20% above the national figure and roughly 33% above Washington state's 2024 average of 3.29 per 1,000, based on FBI UCR 2024 data. That gap is real and shouldn't be minimized.
But context shifts the picture considerably. Using the Washington Association of Sheriffs and Police Chiefs' broader NIBRS methodology — which counts all Group A offenses, not just the narrower FBI Part I index — Bremerton's overall crime rate of 88.2 per 1,000 in 2024 was the highest among Kitsap County's five police jurisdictions. It was also nearly identical to Seattle at 87.4 per 1,000, and well below Tacoma at 120 per 1,000. Bremerton is not an outlier among Washington's working-class port cities; it is squarely in their company.
Bremerton vs. Key Benchmarks (FBI UCR 2024)
| Jurisdiction | Violent Crime (per 1,000) | Property Crime (per 1,000) | Notes |
|---|---|---|---|
| Bremerton, WA | 4.28 | 37.71 | City fact sheet / CrimeGrade.org |
| Washington State avg. | 3.29 | 24.98 | PlainCrime / FBI UCR 2024 |
| National avg. | 3.59 | ~19.60 | FBI UCR 2024 |
| Seattle (WASPC) | 88.2 overall (WASPC) | Comparable to Bremerton | |
| Tacoma (WASPC) | 120 overall (WASPC) | Substantially higher | |
| Silverdale / Kitsap Co. | Lower than Bremerton | Suburban; no incorporated city PD | |
Note: WASPC figures use NIBRS Group A methodology and are not directly comparable to the narrower FBI UCR Part I index figures in the same row.
Property crime is where the gap is sharpest. At 37.71 per 1,000, Bremerton's rate is well above both the state and national figures. Motor vehicle theft drove a disproportionate share of that number — but it fell from 272 incidents in 2023 to 180 in 2024, a 34% year-over-year drop that the police chief credited directly to targeted arrests of prolific offenders. Washington state as a whole led the nation in vehicle theft reduction in the first half of 2025, posting a 42% drop versus the same period in 2024 per the National Insurance Crime Bureau. That statewide momentum is showing up locally.
What's Actually Driving Violent Crime Here
The composition of Bremerton's violent crime matters as much as the total. Aggravated assault — not robbery, not homicide — accounts for the bulk of reported violent incidents. Bremerton police have publicly stated that a disproportionate share of those assaults cluster around the downtown homeless shelter, rather than spreading evenly across residential streets.
That geographic concentration is important. It means the violent crime rate that shows up in city-wide statistics is heavily weighted toward one specific area and context, not distributed uniformly across Manette, West Bremerton, or Kitsap Lake.
The Rape Statistic — What It Actually Means
Bremerton's 2024 FBI UCR data showed reported rape incidents nearly doubling, from 30 to 59. That number circulates in crime-ranking aggregators and looks alarming in isolation. The Bremerton police chief clarified publicly that the number of cases found credible and charged remained unchanged — the statistical spike reflects multiple reports filed by a small number of individuals, not an emergence of a new threat pattern across the city.
This is the kind of context that raw crime-rate websites almost never provide. A number that doubles in the data doesn't always mean the underlying reality doubled. It can mean reporting methodology changed, a specific case generated multiple filings, or a department improved its intake process. Bremerton's chief addressed it directly and on record, which is worth knowing before you let an aggregator score define your perception of the city.
A Young Police Force in Transition
The police chief has also noted that roughly 60% of Bremerton's officers were hired within the last three years. A younger force tends to generate higher raw arrest counts as officers build experience and shift toward proactive policing — which can temporarily inflate reported crime statistics even as underlying trends improve. That dynamic is playing out here right now, and it's a structural reason why the current numbers may overstate where the city is headed.
Neighborhood Safety: The Northwest–Southeast Divide
The single most useful thing you can know about safety in Bremerton is that the city is not uniform. Property crime risk varies from roughly 1 in 17 in the highest-risk southeast areas to approximately 1 in 57 in the lowest-risk northwest neighborhoods, per CrimeGrade.org's May 2026 analysis. That's not a marginal difference — it's the difference between a high-crime urban commercial strip and a low-crime suburban neighborhood that happens to share a city boundary.
The northwest side — anchored by Rocky Point and Kitsap Lake — is broadly considered the safest part of Bremerton. Overall crime risk there is roughly six times lower than in the highest-crime southeast commercial corridors. These are quieter, more residential areas with less retail density, fewer transient foot traffic patterns, and greater distance from the downtown shelter cluster that drives a significant share of the city's assault numbers.
Neighborhood Safety at a Glance
| Neighborhood | Area | Relative Safety | Primary Risk Factor | Best For |
|---|---|---|---|---|
| Rocky Point | Northwest | Lowest Crime | Minimal; low density | Families Privacy |
| Kitsap Lake | Northwest | Lowest Crime | Minimal; residential | Families Nature |
| Bay Vista | West/Northwest | Below avg. | Low; some auto theft | Views Families |
| West Bremerton | West | Near city avg. | Property crime; some theft | Value Commuter |
| Manette | East (waterfront) | Near city avg. | Property crime; vehicle theft | Walkable Renter |
| Charleston | North | Near city avg. | Property crime | First-Time |
| Downtown Bremerton | Central | Above city avg. | Assault; auto theft; theft | Transit Walkable |
| East Bremerton | East/Southeast | Highest Risk | Vehicle theft; retail crime | Value |
East Bremerton and the Downtown-adjacent commercial corridor concentrate the highest volume of property crime in the city — roughly 229 vehicle thefts per year in northeast areas versus about 29 in the northwest, per CrimeGrade.org's vehicle theft mapping. That concentration tracks with retail density and foot traffic, not residential character per se, but the numbers make a compelling case for parking strategy and neighborhood selection if auto theft is a concern for you.
For a deeper look at what each neighborhood actually feels like to live in day-to-day, see the Bremerton neighborhoods guide.
Looking to buy in Bremerton? Estimate your payment.
Enter your numbers to see an estimated monthly mortgage payment.
Estimate only. Excludes HOA fees and mortgage insurance. The interest rate above is a starting point, not a quoted rate — replace it with your own to see real numbers. Insurance is a flat placeholder, not a Bremerton quote.
What Locals Know That the Data Doesn't Show
Downtown Is Not Evenly Distributed
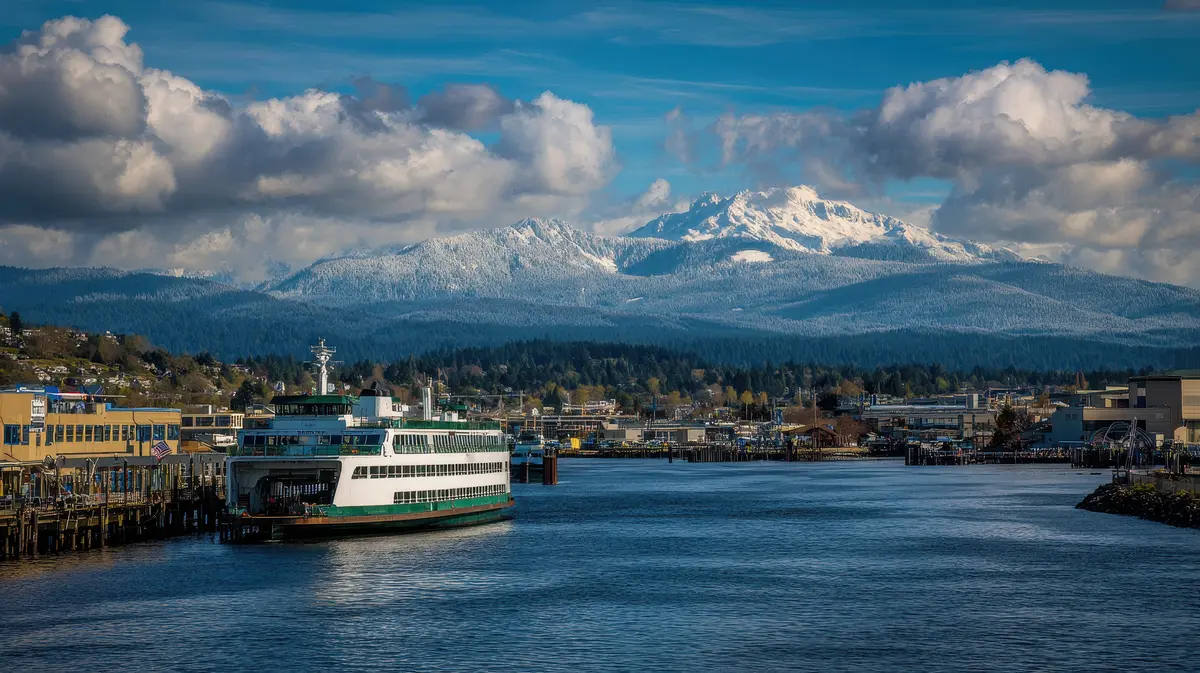
People who've lived here a few years will tell you that Bremerton's downtown has two distinct atmospheres. The Bremerton Boardwalk, Harborside Fountain Park, and the USS Turner Joy Museum Ship area feel active and reasonably comfortable — ferry commuters and waterfront visitors move through steadily. Walk a few blocks inland from the ferry terminal toward the shelter cluster and the character shifts noticeably, especially after dark.
This is the most common thing people report being surprised by after six months here: the city's reputation as a whole is shaped heavily by a relatively small geographic zone. Most residential streets — even in areas that score as average on city-wide metrics — don't feel remotely like the downtown corridor does on a difficult night.
Car Theft Was a Real Problem; It's Getting Better
If you moved to Bremerton anytime between 2020 and 2023, vehicle theft was genuinely alarming. The 2024 drop from 272 to 180 incidents marked real progress, and the statewide momentum through 2025 suggests that trajectory continues. That said: if you're parking in the East Bremerton commercial strip or near the ferry terminal regularly, take basic precautions — a steering wheel club, garage parking if available, keeping valuables out of sight. The northwest neighborhoods don't require the same level of vigilance.
What the Friday Night Scene Actually Looks Like
Bremerton's social life concentrates along 4th Street downtown, where Dog Days Brewing and Remedy Speakeasy draw a mix of shipyard workers, ferry commuters, and younger residents. Silver City Brewery & Taproom on Katy Penman Ave has a more neighborhood-pub feel. None of these areas are rough — they're functioning bars in a working city. But they're a short walk from the shelter zone, and late-night foot traffic on the surrounding blocks is something to be aware of rather than alarmed by.
The Manette Bridge Divide
Manette, across the Manette Bridge from downtown, has developed its own distinct identity — smaller, more walkable, with a stronger community feel than the commercial corridors. Residents there broadly report feeling safe and connected. Property crime exists, but the neighborhood's scale and density mean it feels very different from East Bremerton's strip-mall corridor even though both show similar average rates on aggregator maps.
How to Research Safety Before Choosing a Neighborhood
City-wide crime rates are the worst possible unit of analysis for a decision about where to live. They average together the downtown shelter corridor, the quiet cul-de-sacs of Rocky Point, the retail density of East Bremerton, and the waterfront blocks of Manette — and produce a number that accurately describes none of them.
Tools Worth Using
CrimeGrade.org's block-level heat maps for Bremerton are genuinely useful — they show property crime concentration by geography, which lines up with the northwest/southeast gradient described throughout this guide. Use them to compare specific addresses, not just neighborhoods by name. The Bremerton Police Department also posts call-for-service data, which gives you a more granular sense of what's actually happening near a specific address week by week.
Drive the streets you're considering at different times. The gap between a Rocky Point residential block at 9 p.m. and the stretch of Kitsap Way near downtown at the same hour is visceral in a way that a heat map can't fully communicate. This is one instance where a local perspective genuinely outperforms any dataset.
Questions Worth Asking
- Is street parking available, or is there a garage? Vehicle theft is concentrated in high-traffic commercial zones — covered parking meaningfully changes your exposure.
- How close is the property to the downtown shelter? The clustering of aggravated assault incidents is specific enough that distance from that zone is a meaningful variable.
- What's the call-for-service history for the specific block? Bremerton PD data can answer this with more precision than any aggregator.
- What direction is the specific micro-area trending? The overall city trend is improving; that's not uniformly true at the block level.
What Six Months In Usually Teaches People
Most people who move to the northwest neighborhoods — Rocky Point, Kitsap Lake, Bay Vista — report that the city-wide crime statistics simply don't match their daily lived experience. Most people who move to East Bremerton or near the downtown commercial strip without researching it first report exactly the opposite. The lesson isn't that the numbers lie; it's that a city-wide average lies about both ends of the distribution simultaneously.
Bremerton is a city in genuine transition. The property crime trend is moving in the right direction. The police force is gaining experience. The ferry-connected waterfront draws investment and energy. None of that makes it a low-crime city today — but it does make the current snapshot less predictive of where things are headed than a static comparison to the state average would suggest.
Local Expert Takeaway: Bremerton's city-wide crime rate is above state and national averages — that's real, not a spin. But the number that matters most is where you're specifically considering living. Rocky Point and Kitsap Lake sit in a fundamentally different risk category than the East Bremerton commercial corridor or the blocks immediately surrounding the downtown shelter. Walk 4th Street on a weekday evening, drive Kitsap Lake Road on a weekend morning, and check CrimeGrade.org's block-level map for any specific address before you decide. The gap between Bremerton's worst and best zones is wider than almost any other city its size in Kitsap County — which means doing the neighborhood-level homework here matters more than it would almost anywhere else.
Quick Takeaways & FAQs
✅ Motor vehicle theft — the biggest driver of Bremerton's elevated property crime rate — dropped 34% between 2023 and 2024, and Washington state led the nation in vehicle theft reduction through the first half of 2025.
⚠️ Bremerton's overall crime rate is nearly identical to Seattle's and well below Tacoma's per the WASPC 2024 report — the city's reputation as uniquely dangerous within Washington is not supported by the comparative data.
📍 Rocky Point and Kitsap Lake in the northwest have a property crime risk roughly six times lower than the highest-risk southeast corridors — the neighborhood you choose inside Bremerton matters far more than the city-wide number.
Is Bremerton, WA a safe place to live?
Which Bremerton neighborhoods have the lowest crime?
Is Bremerton more dangerous than Seattle?
Is car theft a real problem in Bremerton?
Why did Bremerton's reported rape statistics spike in 2024?
Moving to Washington?
Tell us what you need help with and we'll connect you with local resources.
