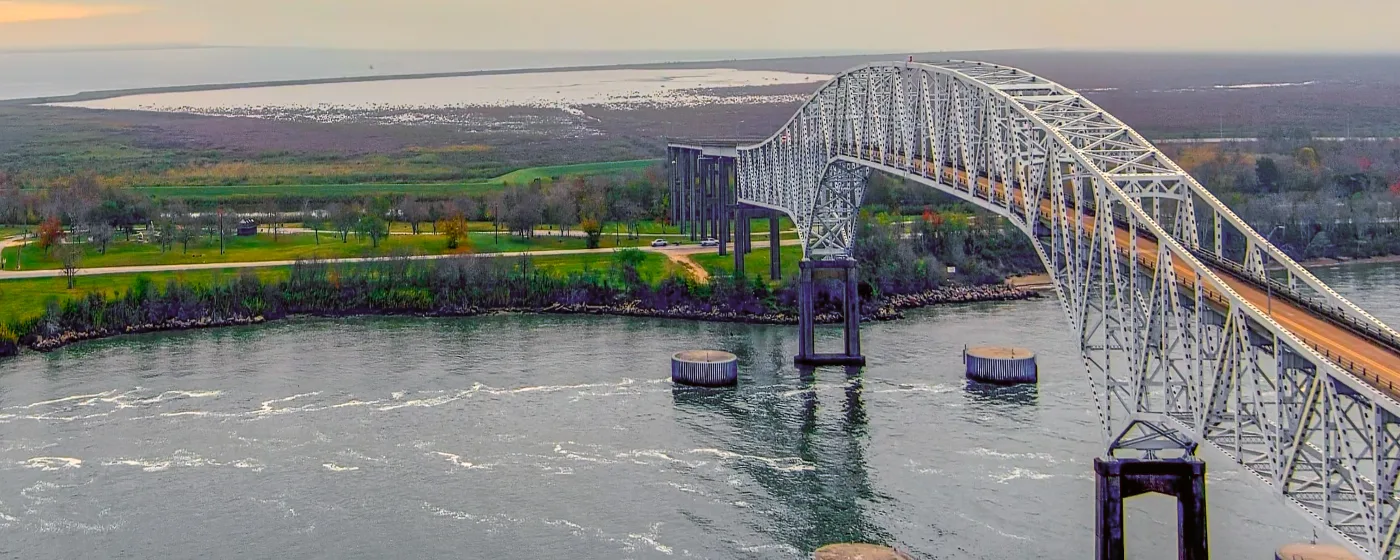
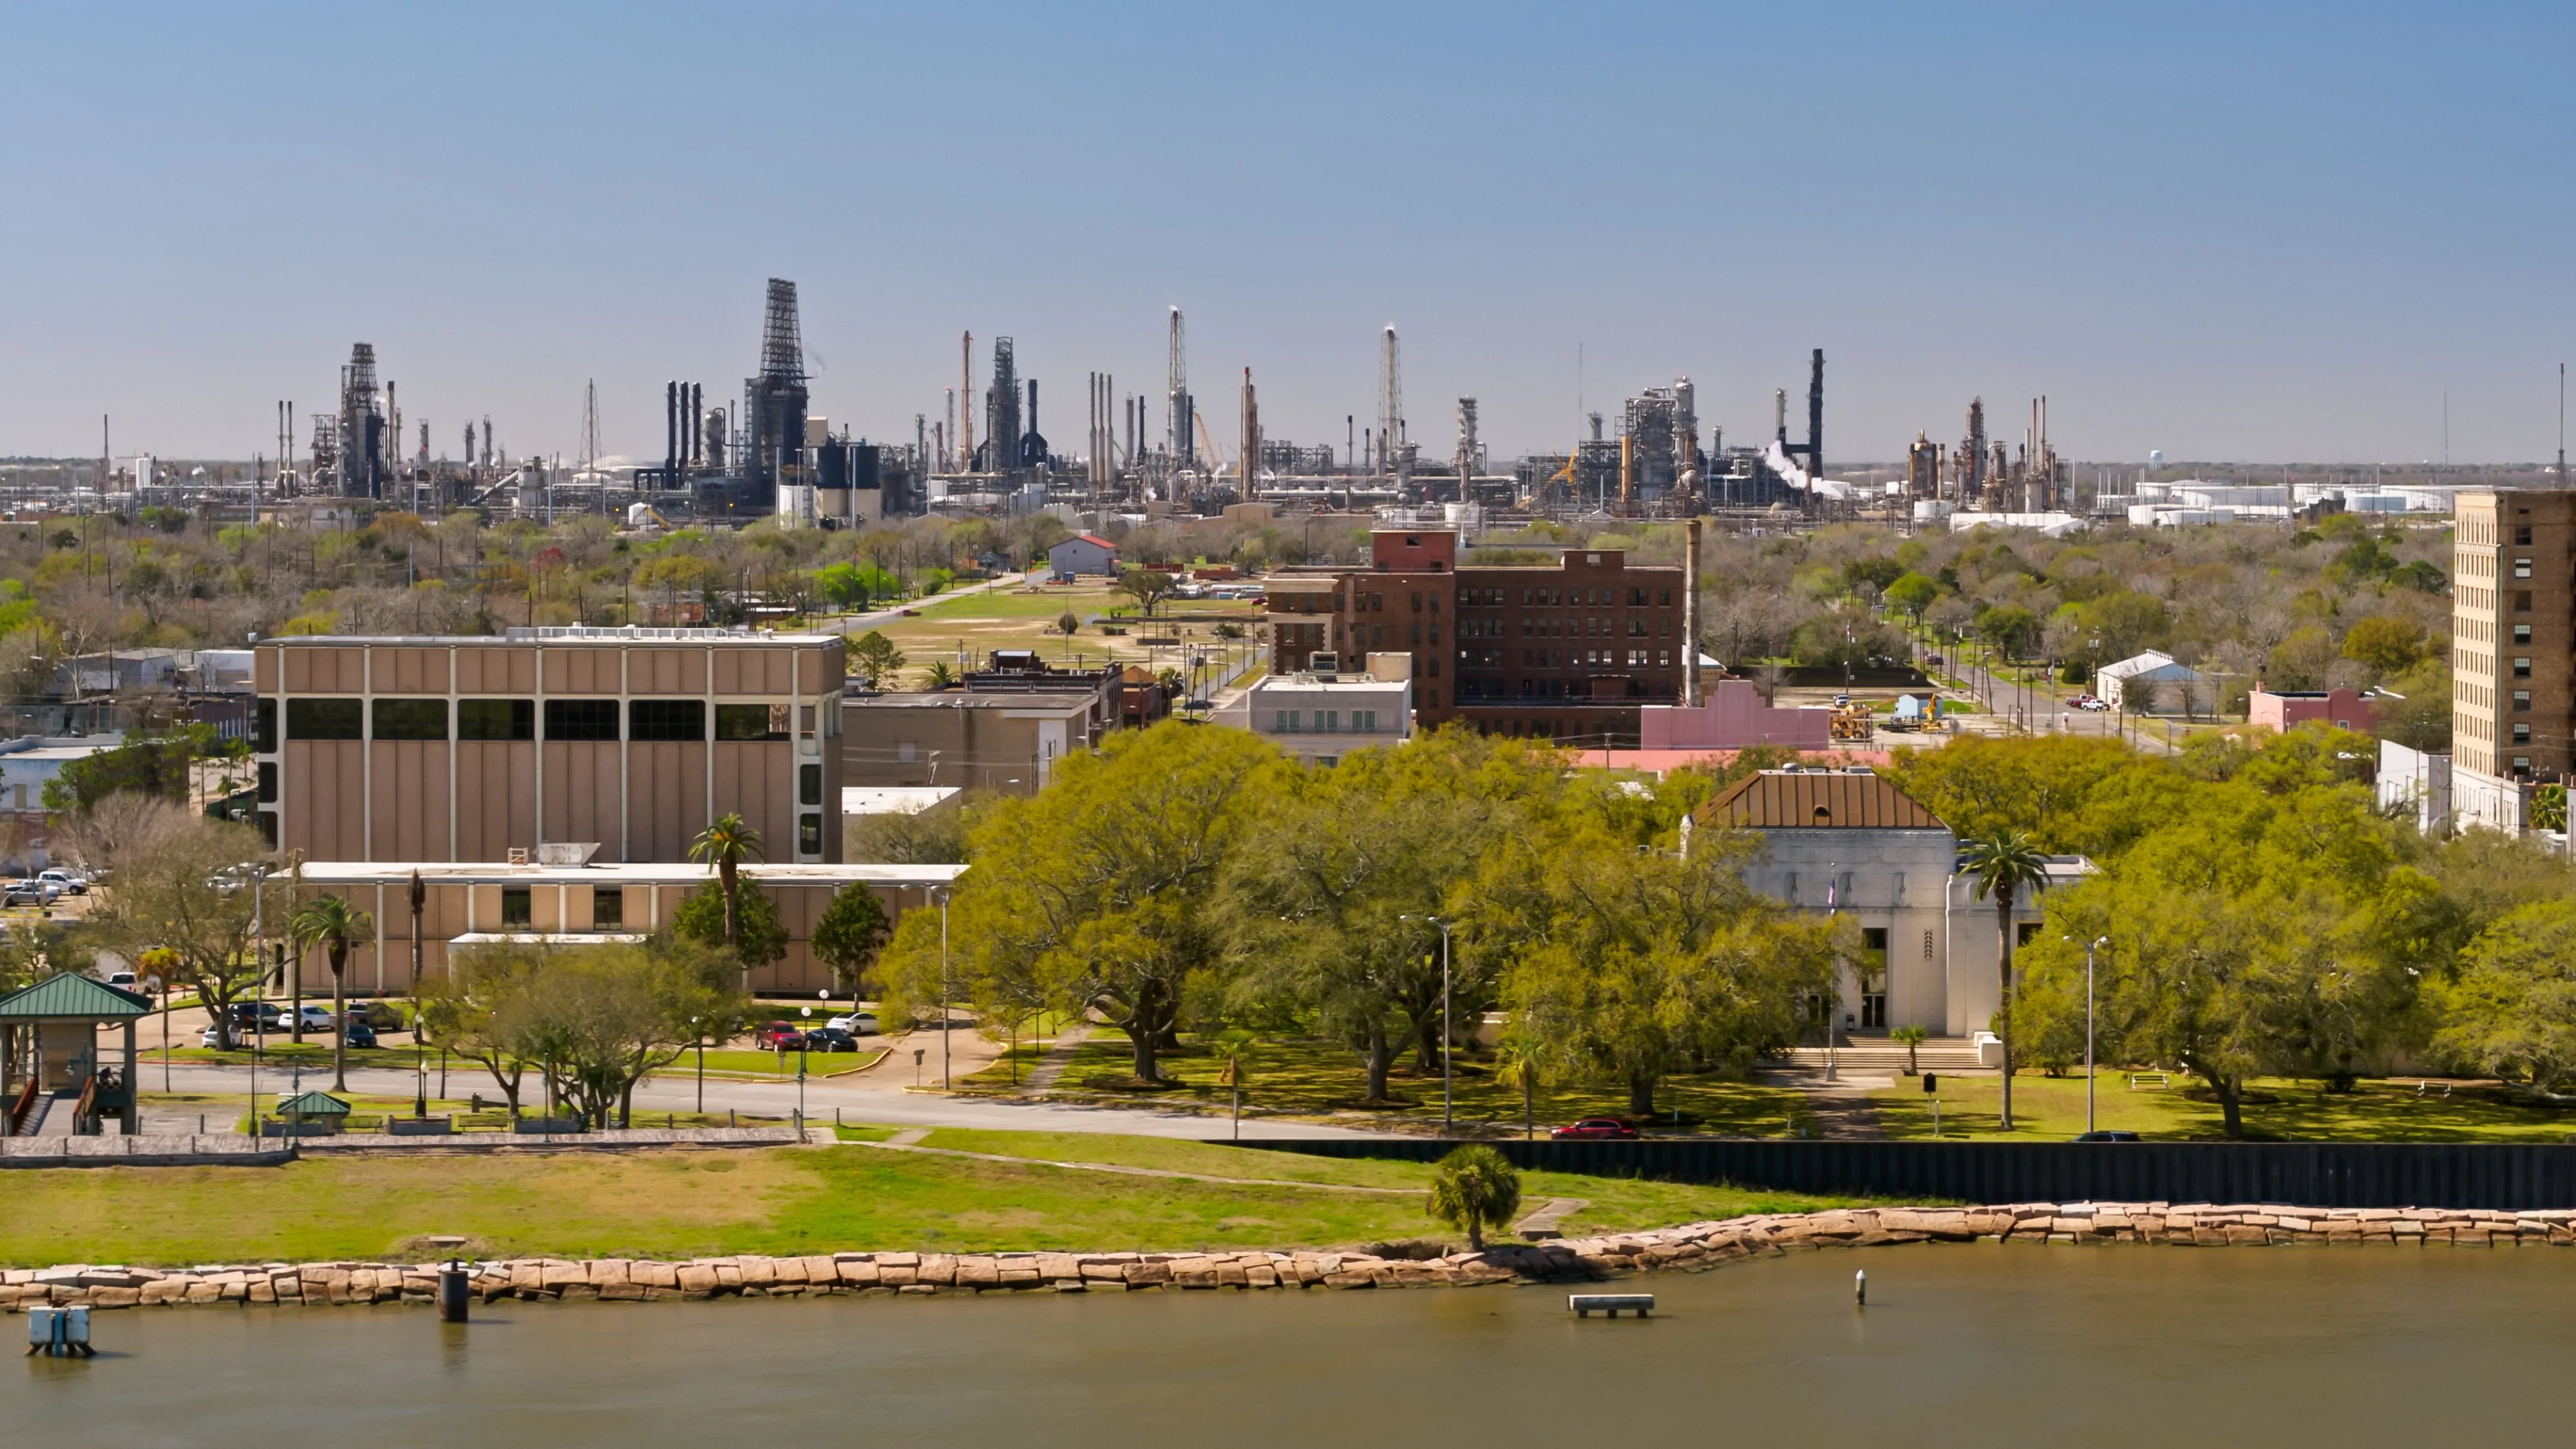
Port Arthur gets flagged in crime rankings, and if that's why you're here, the data deserves a straight read — not a dismissal and not a panic. With a population of 55,804, this is a working industrial city built on one of the largest refinery clusters in the country, and like most industrial Gulf Coast cities, safety is uneven. The headline numbers sit above state and national benchmarks for violent crime, and that's real. What the headlines miss is that property crime runs below the Texas state average — an asymmetry worth understanding before you write the city off entirely.
The economic backbone here is petrochemicals. Motiva, Valero, TotalEnergies, and Chevron Phillips Chemical are all operating in or near the city, and that industrial base shapes everything — who lives where, which neighborhoods are stable, and which parts of the city see the most commercial foot traffic. The Port Arthur Independent School District employs a significant share of the non-industrial workforce. The people who stay tend to stay for a reason: affordable housing, proximity to the refineries, or deep family roots in Southeast Texas.
Cost of living is among the most compelling parts of Port Arthur's case. The typical home price sits at $125,021 (July 2026), a figure that is noticeably below nearby Nederland, Groves, and Port Neches — a full breakdown is on the cost-of-living page. That affordability comes with trade-offs, and safety is the most cited one. But trade-offs look different once you understand which parts of the city are actually driving the numbers.
The sections below break down Port Arthur's crime statistics against state and national comparisons, explain what the neighborhood-level data actually shows, and walk through what residents and community organizations are doing to address safety — so you can make an informed call about whether Port Arthur fits your situation.
The Numbers in Context: What Port Arthur's Crime Rate Actually Means
| Measure | Port Arthur | Texas | National | vs. national |
|---|---|---|---|---|
| Violent crime (per 1,000) | 7.18 | 4 | 3.7 | 94% higher |
| Property crime (per 1,000) | 15.4 | 20.7 | 18.4 | 16% lower |
State and national figures — Bureau of Justice Statistics, Crime Known to Law Enforcement, 2024 (tables 2 and 3). City figures — AreaVibes, based on FBI crime data (2024 calendar year, released Sept 2025). City rates come from a different reporting series than the state and national benchmarks, so read the comparison as a direction, not a precise multiple.
Port Arthur carries a violent crime rate of 7.18 per 1,000 residents and a property crime rate of 15.4 per 1,000 residents. Those are the figures you need to anchor everything else on this page.
The state and national comparisons matter here. Texas as a whole reports a state violent crime rate of 4 per 1,000, and the national violent crime rate sits at 3.7 per 1,000. Port Arthur's violent crime rate is meaningfully above both — that's the honest read. But flip to property crime: Port Arthur has a property crime rate of 15.4 per 1,000 residents, which falls below the Texas state average of 20.7 per 1,000 and below the national figure of 18.4 per 1,000. That's the detail most online rankings bury.
This page shows a full comparison table immediately below this section — use it as your reference point before reading further.
Why the Gap Exists
Port Arthur's refinery economy creates a city with relatively stable residential neighborhoods alongside commercial corridors with high vehicle and foot traffic. Property crime tends to follow commercial activity; the fact that Port Arthur's commercial zones are industrial rather than retail-dense likely suppresses the kind of opportunistic theft that drives property crime figures up in more retail-saturated cities.
Violent crime is a different story. Like many post-industrial Gulf Coast cities, Port Arthur has faced persistent socioeconomic pressures — concentrated poverty, limited economic mobility in certain neighborhoods — that correlate with higher violent crime rates nationally. The figure is real and shouldn't be softened. What it means for a specific household depends heavily on which neighborhood you're in.
A Caution About Crime Heat Maps
If you've pulled up a crime heat map of Port Arthur, you've probably noticed red clustering in the northeastern part of the city. That area holds a higher concentration of retail establishments, and raw incident counts there run far higher than the southeastern corner of the city. But raw counts and per-capita rates are not the same thing. A commercial corridor generates incidents because it generates traffic — shoppers, vehicles, workers — not necessarily because residents there face elevated personal risk. When you're evaluating a neighborhood to live in, per-capita rates and the character of surrounding land use matter more than a heat map's color.
Neighborhood-by-Neighborhood Safety Picture
Port Arthur is not one uniform safety environment. The eight canonical neighborhoods read differently from each other, and choosing wisely within city limits matters more than the city-wide average suggests.
Griffing Park
Griffing Park sits in the eastern part of the city and was its own independent municipality before Port Arthur annexed it in 1983. That history produced a neighborhood with real civic identity — primarily owner-occupied, medium- to small-sized single-family homes, most of them built between 1940 and 1969. Owner-occupancy is one of the most reliable proxies for neighborhood stability, and Griffing Park trends that direction. Families with school-age children appear consistently in profiles of this area.
Best for: Families Quiet streets
Pear Ridge
Pear Ridge carries a similar character to Griffing Park — quiet, predominantly owner-occupied, with housing stock mostly established between 1940 and 1969. Profiles consistently describe it as family-friendly with a variety of housing options. It doesn't generate the kind of chatter that higher-incident areas do, which is the point. For a household prioritizing residential calm over proximity to commercial amenities, Pear Ridge is worth a close look. See the neighborhoods page for the full character breakdown.
Best for: Families Value
Lakeview
Lakeview occupies the eastern edge of the city near Sabine Lake, a mix of single-family homes and apartments. Residents and neighborhood profiles describe a peaceful atmosphere. The proximity to the lake gives the area a geographic anchor that residential neighborhoods without natural boundaries sometimes lack — water on one side means less through-traffic and more defined community edges.
Best for: Nature Quiet
West Port Arthur
West Port Arthur has something concrete going for it beyond general character descriptions: active neighborhood watch infrastructure. Residents there have organized formally around community involvement, and neighbors are described as actively working together on safety. That kind of organized resident participation is one of the factors criminologists consistently identify as a meaningful deterrent — it isn't just morale, it changes behavior patterns in an area.
Best for: Families Commuters
Port Acres
Port Acres is the neighborhood that consistently reads as quiet and close-knit in resident profiles. A mix of older homes and newer construction gives it more housing variety than some of the city's other established neighborhoods. Local parks anchor the community feel. For households who want a low-key residential environment and don't need to be within walking distance of commercial amenities, Port Acres delivers that.
Best for: Quiet First-timers
Sabine Pass
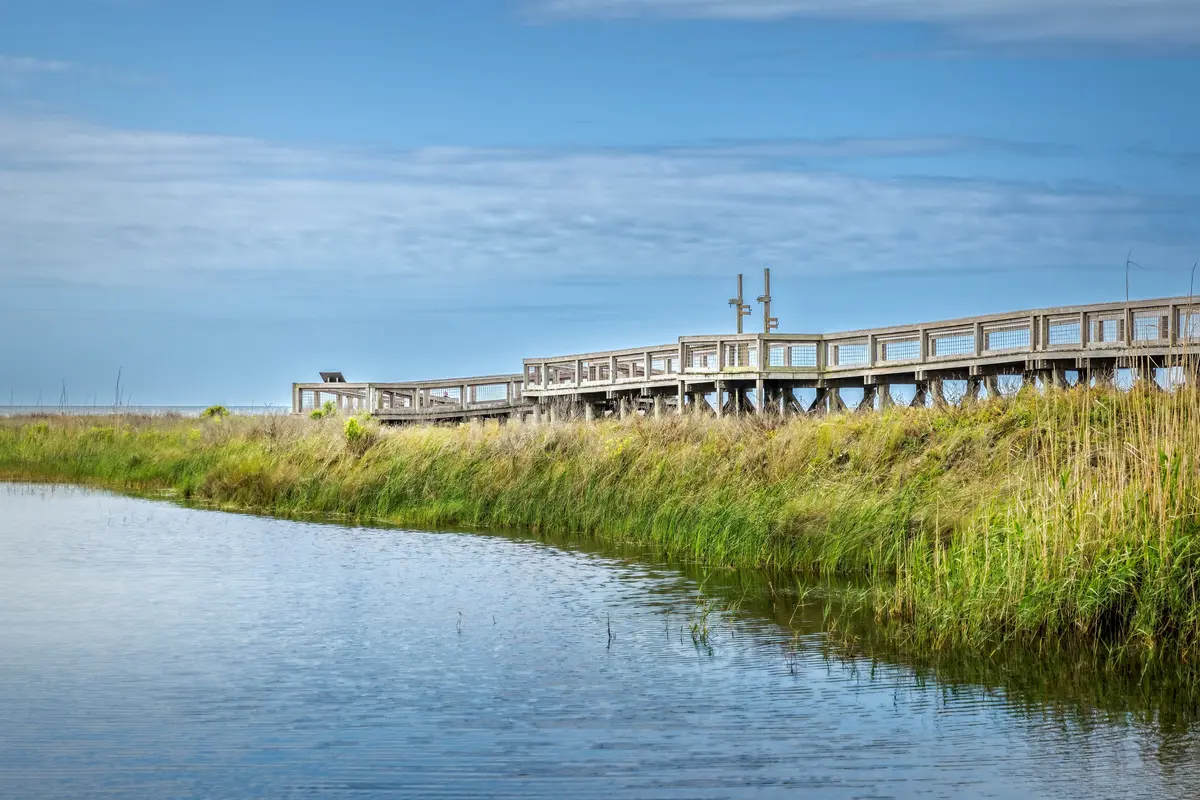
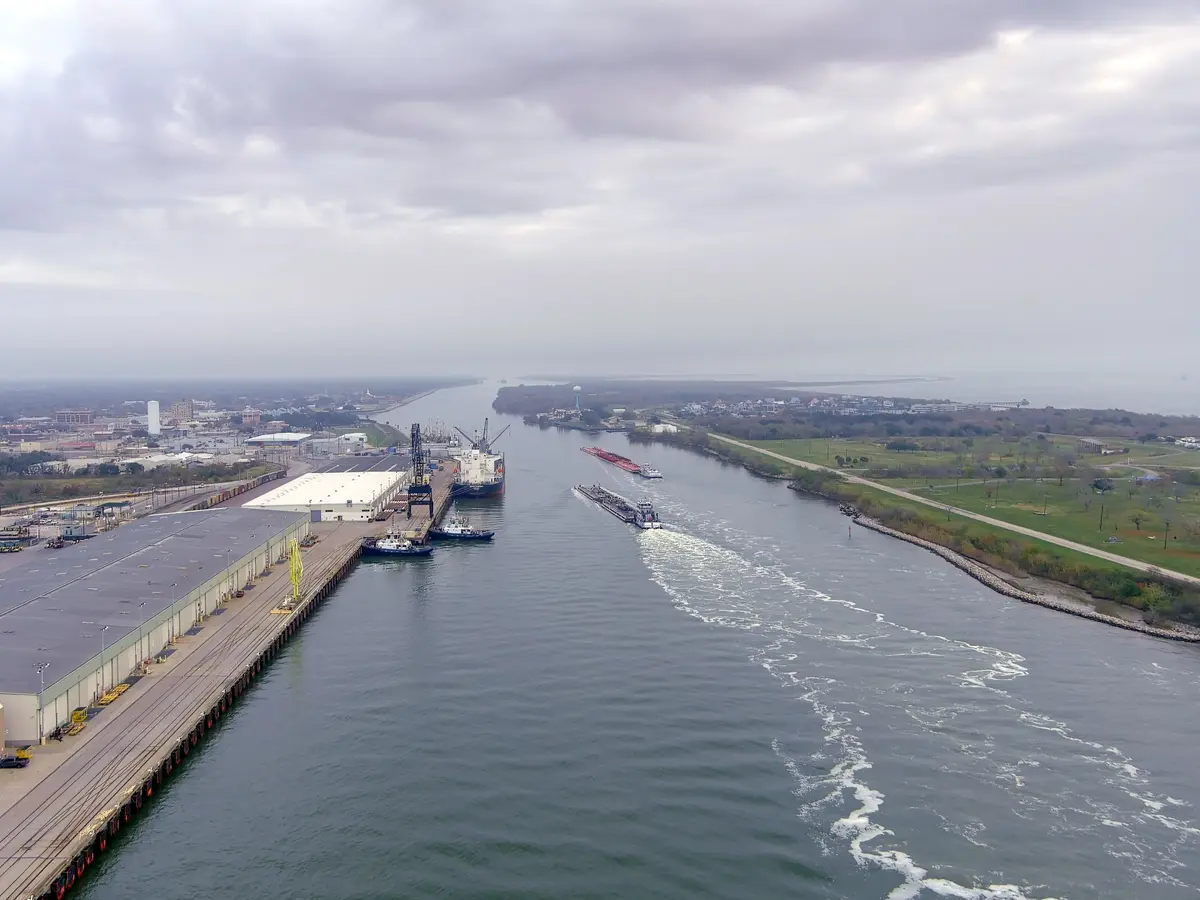
Sabine Pass sits at the city's southern tip near Sea Rim State Park and functions almost like a separate town — because it was one. Originally incorporated in 1861, it wasn't annexed until 1978, and it still maintains its own school district, post office, and port authority. That institutional self-sufficiency produces a genuinely tight-knit community character unlike any other Port Arthur neighborhood. The retail corridor in the north end of the city sees the most incidents; this geographically isolated southern area sees few.
Best for: Nature Privacy
Downtown Port Arthur and Tallow Woods
Downtown Port Arthur is the neighborhood most affected by the commercial corridor dynamics described in the heat-map section — higher raw incident counts driven by foot and vehicle traffic rather than purely residential risk. That doesn't mean Downtown is without investment or activity: the Museum of the Gulf Coast and the Pompeiian Villa anchor a cultural presence that the surrounding neighborhoods lack. Tallow Woods sits adjacent and is worth assessing on its own terms. Both are areas where paying attention to specific blocks and street character matters more than the neighborhood label. The neighborhoods page goes deeper on each.
Best for: Renters Walkable access
Community Policing and What the City Is Doing About It
Port Arthur's Police Department was established in 1897 — the first municipal law enforcement agency in Jefferson County — and has grown into a four-division operation. The organizational history matters less than what the department is doing on the ground right now.
Neighborhood Action Groups
The most significant community-facing program is the Neighborhood Action Groups model, a formal structure run through the department's Community Relations Division. Citizen groups are organized within residential neighborhoods, apartment complexes, and housing developments, with more than 1,000 Port Arthur residents currently participating. The model is designed so any resident can join and work directly with officers — the stated objective is teaching residents of all ages about crime prevention and personal safety, not just reporting incidents after the fact.
That scale of participation is meaningful. A thousand residents in a city of 55,804 represents a real organizational footprint, not a token program. When West Port Arthur's neighborhood watch infrastructure is described as active, this is the institutional framework behind it.
Police Chief Advisory Committee
A less visible but structurally important initiative is the Police Chief Advisory Committee, established by city ordinance in 2017. Fourteen members — appointed by each city council member and the mayor — serve with a stated mission to enhance citizen understanding and cooperation between the department and the community. It exists as an accountability mechanism, not a ceremonial body.
Neither of these programs erases the city's crime figures. But they represent genuine institutional investment in community-level safety rather than purely reactive policing, and that distinction matters when you're evaluating whether a city is moving in a productive direction.
What Doesn't Show Up in the Data
One thing longtime residents point out: the refinery economy creates shift-work schedules that populate neighborhoods at unusual hours. Multiple adults on different schedules means more eyes on streets at 2 a.m. than you'd find in a conventional suburban neighborhood. That informal surveillance is hard to measure and never appears in crime statistics, but it's part of the texture of neighborhoods near the industrial corridor.
Looking to buy in Port Arthur? Estimate your payment.
Enter your numbers to see an estimated monthly mortgage payment.
Estimate only. Excludes HOA fees and mortgage insurance. The interest rate above is a starting point, not a quoted rate — replace it with your own to see real numbers. Insurance is a flat placeholder, not a Port Arthur quote.
How to Research Safety Before Choosing a Neighborhood
City-wide crime rates tell you the average. They don't tell you whether the specific block you're considering runs above or below it. Here's how to get closer to ground truth.
Go to the Source, Not the Aggregator
Crime aggregator sites like NeighborhoodScout and AreaVibes synthesize publicly available data, but they use different methodologies and report different figures than federal crime reporting source tables. For Port Arthur, this can produce confusion when one site shows a rate significantly different from another. The figures on this page come from federal crime reporting source tables; they're the most consistent basis for comparing Port Arthur against state and national benchmarks.
For hyper-local street-level patterns, the Port Arthur Police Department's Community Relations Division is the direct source. Neighborhood Action Group captains often have granular knowledge of specific blocks that no public database captures.
Read the Map Critically
When you pull a crime heat map for Port Arthur, remember the commercial corridor dynamic described earlier. The northeastern part of the city — with more retail density — generates higher raw incident counts. That's volume, not per-capita rate. If you're evaluating a residential block in that general area, look at whether the incidents on that block are commercial (shoplifting, vehicle break-ins in parking lots) or residential in nature. They carry very different implications for a household considering that address.
The residential areas of the southeastern corner of the city, including around Sabine Pass, see far fewer incidents than the commercial northeast — directionally useful context even when comparing across neighborhoods.
Talk to the Neighborhood Action Group
This is the most underused resource for anyone researching Port Arthur neighborhoods. Neighborhood Action Groups operate as resident-level organizations with direct ties to the police department — they're not just a tip line. Before deciding on a neighborhood, reaching out through the city's Community Relations Division to connect with the local group gives you access to the kind of ground-level pattern recognition that no public database offers. The city's website lists the Community Relations Division contact directly under the Police Department.
Visit at Different Times
A neighborhood visit on a Tuesday afternoon reads differently than a Friday evening. Port Arthur's refinery-adjacent neighborhoods, in particular, have shift-change rhythms that affect street activity significantly. If a neighborhood's feel at 7 p.m. is your concern, that's the time to be there — not mid-morning on a weekday when the picture is flattering but unrepresentative.
The Honest Verdict: Who Port Arthur Works For on Safety
Port Arthur's violent crime rate is elevated above state and national figures — that's not something to rationalize away. For households with low tolerance for elevated risk, or for anyone who has children and prioritizes safety above other factors in neighborhood selection, the city-wide average is a real signal to weight seriously. The neighboring cities of Nederland, Groves, and Port Neches all come in noticeably higher on home prices, but they also carry different safety profiles worth comparing.
The property crime picture is genuinely different and often overlooked. Port Arthur has a property crime rate of 15.4 per 1,000 residents, which sits below the Texas state average — suggesting that vehicle break-ins, home burglaries, and theft are less common here than in many Texas cities. For someone weighing Port Arthur primarily on that dimension, the data is more favorable than the city's reputation implies.
Where the Numbers Land in Practice
The households who report the fewest concerns tend to cluster in Griffing Park, Pear Ridge, Lakeview, and Port Acres — owner-occupied, residential-character neighborhoods that generate limited commercial foot traffic. West Port Arthur's organized neighborhood watch infrastructure provides a meaningful additional layer. Sabine Pass sits effectively in its own category: geographically isolated, institutionally self-sufficient, and producing some of the lowest incident volumes in any part of the city.
Downtown Port Arthur is where the city's commercial dynamics concentrate the most incidents. That doesn't make it uniformly unsafe, but it's the area where block-by-block research matters most and where a surface-level look at city averages is least useful as a guide.
The Friction Point Nobody Mentions
People who move to Port Arthur from cities like Beaumont or Houston often say the same thing after six months: the crime statistics felt more alarming from the outside than the daily reality inside a stable neighborhood. That's not a dismissal of the data — it's a description of what localized safety actually looks like when you're in Griffing Park or Pear Ridge rather than averaging across the entire city of 55,804. The city-wide number is real. Your neighborhood's number is the one you live with.
For the full picture on neighborhood character and what each area looks and feels like to live in, the neighborhoods page goes deeper. If you're weighing Port Arthur against the neighboring cities, the cost-of-living page has the price comparison that puts the safety trade-off in financial context.
Local Expert Takeaway: Port Arthur's violent crime rate is above the state average and that deserves an honest acknowledgment — but the city has a property crime rate of 15.4 per 1,000 residents, which sits below the Texas benchmark and flips the usual narrative. Where you land within Port Arthur matters enormously: Griffing Park, Pear Ridge, and Port Acres are predominantly owner-occupied, residential-character neighborhoods that look very different from the city-wide average. Sabine Pass, at the southern tip near Sea Rim State Park, has the feel and incident volume of a small town rather than a Gulf Coast industrial city. If you're serious about a move, connect with the Port Arthur Police Department's Community Relations Division and ask about the Neighborhood Action Group for the specific area you're considering — it's a direct line to resident-level pattern knowledge that no online database provides.
Quick Takeaways & FAQs
✅ Port Arthur has a property crime rate of 15.4 per 1,000 residents, which falls below the Texas state average — a meaningful distinction that most online rankings ignore.
⚠️ Violent crime runs above both state and national benchmarks, and households with children or low risk tolerance should research specific neighborhoods carefully before deciding, rather than relying on the city-wide average.
📍 Sabine Pass retains its own school district, post office, and port authority more than 45 years after annexation — giving it a self-contained, small-community character that produces some of the lowest incident volumes in the city.
What is Port Arthur's crime rate compared to Texas as a whole?
Which Port Arthur neighborhoods are considered the safest?
Why do crime heat maps show so much red in the northeastern part of Port Arthur?
Does Port Arthur have any organized community safety programs?
How does Port Arthur's safety compare to nearby cities like Nederland or Groves?
Moving to Texas?
Tell us what you need help with and we'll connect you with local resources.
