
Fort Worth is the 4th-largest incorporated city in Texas, home to 1,028,117 people spread across a geographic footprint that stretches from dense urban corridors to quiet suburban streets where neighbors still wave from the porch. That size is the first thing to understand when someone asks whether the city is safe: a single yes or no answer covers too much ground to be useful. The northwest feels nothing like the central corridors, and buying without knowing that distinction is one of the most common mistakes relocating families make here.
The city carries a violent crime rate of 4.9 per 1,000 residents and a property crime rate of 26.4 per 1,000 residents — figures that run above both the Texas state average and the national average. But those city-wide numbers are a ceiling, not a floor. The Fort Worth Police Department's Q2 2025 crime report recorded a 14.3% reduction in overall crime compared to the same period in 2024, with crimes against persons down 16.3% and crimes against property down 14.1%. The direction of travel matters as much as the snapshot.
What the city-wide rate cannot tell you is that a resident's experience of safety varies dramatically by geography. The east side sees the most concentrated incident activity; the northwest sees far fewer. That is not a small difference — it is the difference between a neighborhood that demands constant awareness and one where families with school-age children feel genuinely settled. The sections below break down what the numbers actually mean, which neighborhoods carry lower risk, what the city is doing structurally to drive those numbers down further, and how to run your own research before deciding on an area.
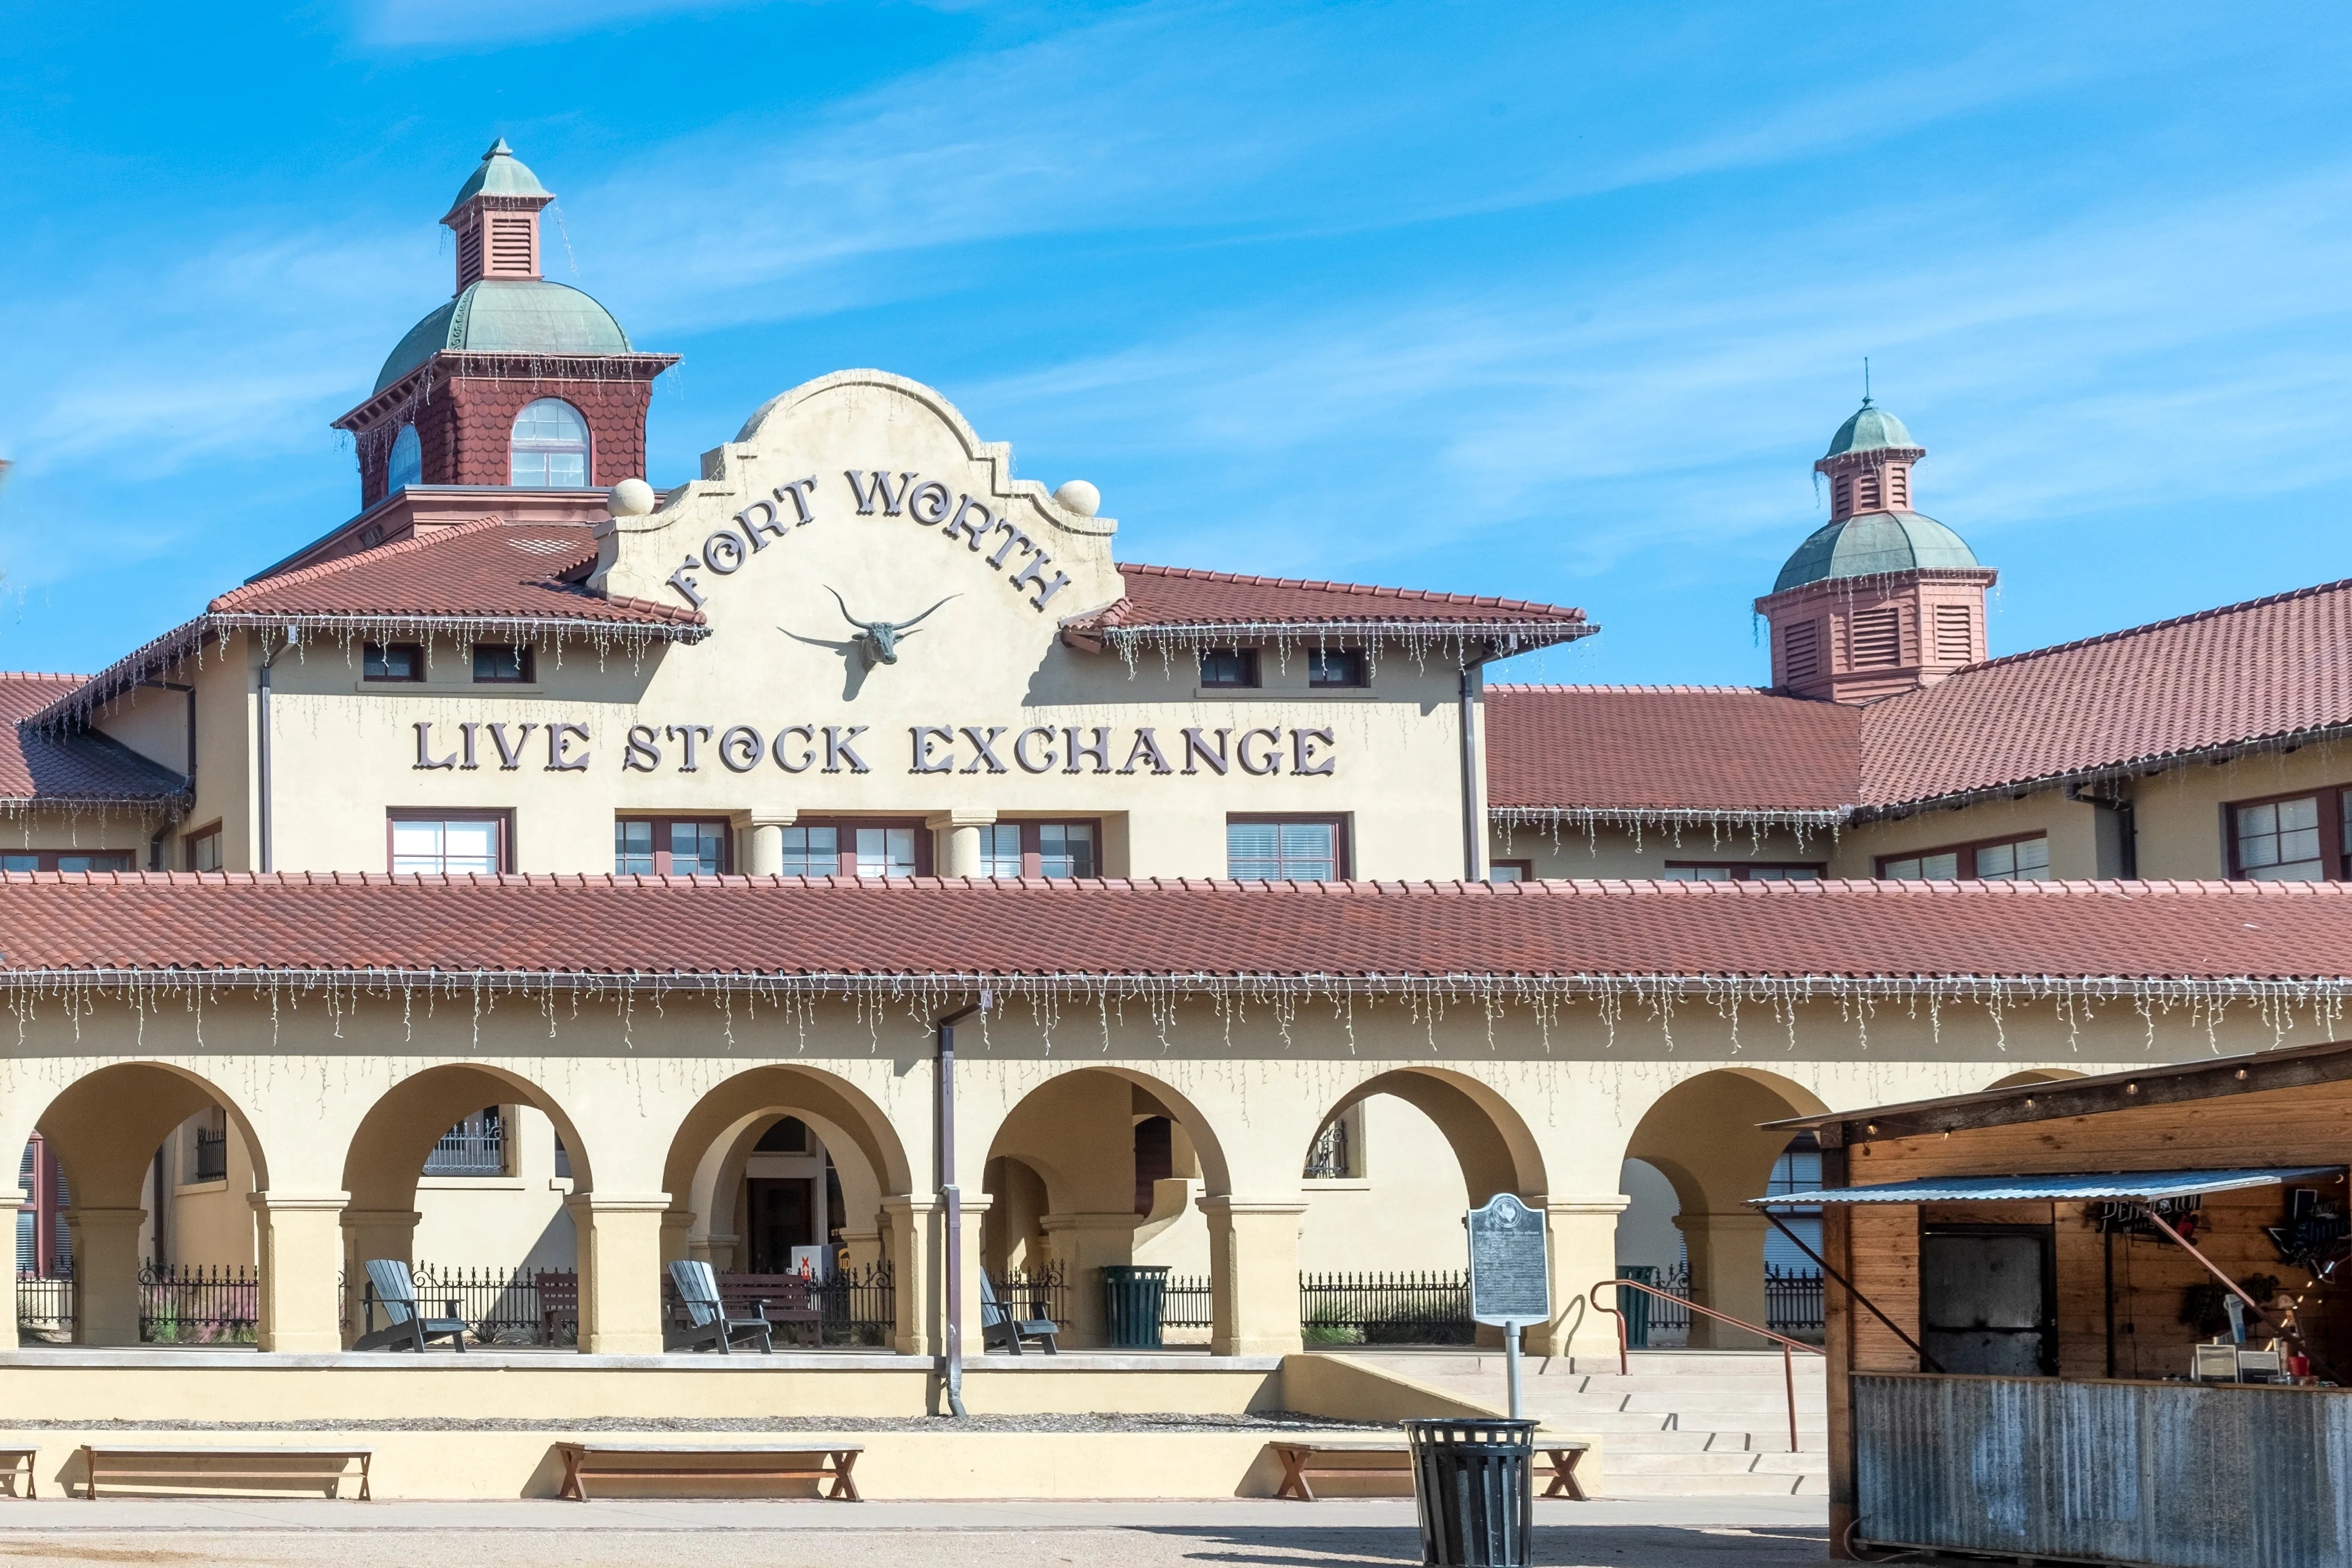
Fort Worth Crime Rates in Context
The numbers require honest framing before they become useful. Fort Worth carries a violent crime rate of 4.9 per 1,000 residents, which sits above the Texas state average of 4 per 1,000 and above the national average of 3.7 per 1,000. The city also carries a property crime rate of 26.4 per 1,000 residents, similarly running above the state figure of 20.7 per 1,000 and the national figure of 18.4 per 1,000.
City-wide rates for a city of more than a million people absorb a lot of variation. High-activity commercial corridors, downtown entertainment districts, and transitional neighborhoods all pull those averages upward, while large swaths of residential Fort Worth sit well below them.
The more useful lens is direction. By mid-2025, citywide crime was running measurably lower than the same point in 2024. The Q2 2025 FWPD report recorded 12,392 total offenses in Q2 2025 versus 14,456 in Q2 2024 — a 14.3% reduction. Crimes against society — gang activity, drug offenses, weapons violations — dropped 8.2%. These are meaningful reductions for a city that has historically struggled with its crime narrative.
What the overall city rate does not reflect is geography. The east side of the city sees the heaviest concentration of reported incidents; the northwest sees far fewer. That gap is what neighborhood-level research is designed to surface — and it is why residents in Tanglewood or Arlington Heights experience a functionally different city than someone living near the central commercial districts.
The Geographic Divide: Where Fort Worth Is Safer
The northwest quadrant is where safety-conscious buyers and renters consistently land. Residents and safety analysts alike point to this part of the city as the least exposed to property and violent crime — a pattern that holds across multiple data sources and has been consistent for several years.
Tanglewood sits among the city's neighborhoods with crime rates meaningfully below the citywide average. The housing stock runs above the city median, and the neighborhood draws long-term owner-occupants — the demographic stability itself tends to correlate with lower property crime. For more on what the neighborhood costs and who it suits, the neighborhoods guide has the full picture.
Arlington Heights, just west of downtown, carries crime rates lower than city averages — particularly on interior residential streets. Multiple analyses group it with Tanglewood as among the city's safer choices. It is also one of the few places in Fort Worth where running an errand on foot feels genuinely reasonable in spots, which matters for families evaluating day-to-day livability alongside safety data.
Fairmount and Ryan Place tell a slightly different story. Both are pre-1950s historic enclaves — Craftsman bungalows and Colonial Revival homes on tree-lined streets — and both carry an increasingly strong safety profile despite sitting closer to the center of the city than Tanglewood. Fairmount's proximity to Magnolia Avenue's independent restaurant and coffee scene is part of its draw; Ryan Place's character homes attract buyers who want community stability alongside safety. Neither is as insulated as the northwest, but both are regularly grouped by safety analysts as meaningfully below Fort Worth's citywide rate.
Mistletoe Heights and Ridglea / Ridglea Hills round out the picture on the west side. Ridglea sits below the city median on home price, making it one of the more accessible entry points into a generally calmer part of town. Mistletoe Heights runs above it. Both sit in the geographic band where the data tends to be more favorable than the city average would suggest.
Near Southside and Wedgwood are more mixed. Near Southside is an evolving urban district with genuine energy and some of the city's better independent dining — but it is not the place to choose primarily on the basis of crime statistics. Wedgwood sits at the city median on home price and offers more residential quiet, though its safety profile is less uniformly strong than the neighborhoods further west and north.
| Neighborhood | General Safety Profile | Best For |
|---|---|---|
| Tanglewood | Among the city's lowest crime rates | Families Quiet |
| Arlington Heights | Below citywide average, especially interior streets | Families Walkable |
| Fairmount | Improving profile; below citywide average | First-Time Walkable |
| Ryan Place | Below citywide average; strong community stability | Families Quiet |
| Mistletoe Heights | Generally calmer; west-side positioning helps | Families Luxury |
| Ridglea / Ridglea Hills | Below citywide; more accessible price point | Value Families |
| Near Southside | Mixed; urban district with higher activity nearby | Renters Walkable |
| Wedgwood | Moderate; residential but uneven | First-Time Commuter |
The east side of the city is where the aggregate numbers are most heavily influenced. If you are researching a specific address east of downtown, neighborhood-level data is especially important — the block-by-block variation there is more pronounced than it is in the west.
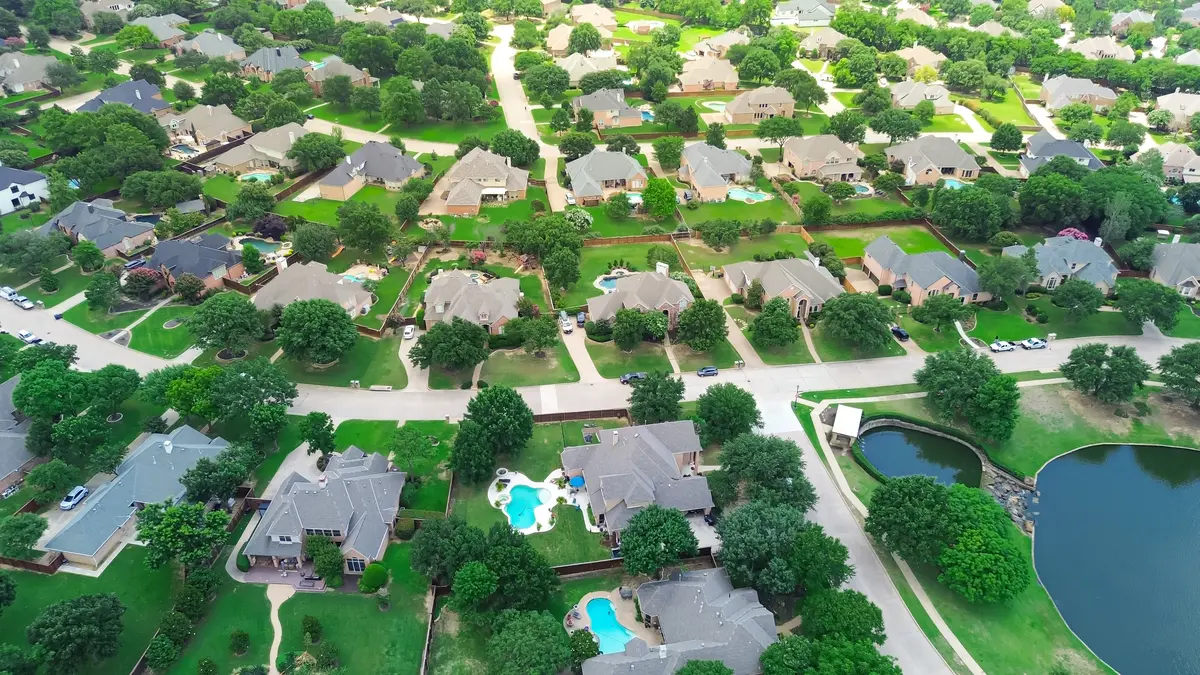
What Fort Worth Is Doing About Crime
The city has invested significantly in the structural side of crime reduction, and the budget reflects it. The Fort Worth Crime Control and Prevention District (CCPD) — funded by a dedicated half-cent sales tax that voters have repeatedly renewed — approved a FY2026 budget of just over $138.6 million. That figure funds the Real Time Crime Center, Neighborhood Police Officers embedded in specific districts, and gang intervention programs operating across the city.
The Real Time Crime Center deserves specific mention because it represents a different approach than traditional patrol presence. The center aggregates camera feeds, license plate readers, and incident data in real time, allowing dispatchers and analysts to direct officers more precisely during active incidents. Residents in neighborhoods with Neighborhood Police Officers assigned to them describe a different texture of daily engagement — officers who show up at community meetings, know the street-level context, and aren't primarily responding to calls from the next precinct over.
On the prevention side, the CCPD awarded $2.13 million in May 2025 to six Tarrant County nonprofits running programs targeting at-risk youth ages 13–24, firearm safety education, crime victim support, and youth literacy — contracts running through June 2028. That funding is preventive rather than reactive, aimed at the conditions that produce crime rather than the crime itself.
Six months of improved data does not permanently resolve a city's safety picture, and anyone moving to Fort Worth should approach the trend data as a positive signal rather than a guarantee. But the combination of a structural funding mechanism, a declining trend line, and expanding community-level programs gives the numbers more credibility than a single good quarter would on its own.
Looking to buy in Fort Worth? Estimate your payment.
Enter your numbers to see an estimated monthly mortgage payment.
Estimate only. Excludes HOA fees and mortgage insurance. The interest rate above is a starting point, not a quoted rate — replace it with your own to see real numbers. Insurance is a flat placeholder, not a Fort Worth quote.
How to Research Safety for a Specific Address
The single most useful thing you can do before deciding on a neighborhood is pull the FWPD's Crime Data Center. The department publishes quarterly crime reports by district, and its online Crime Map allows you to filter by offense type and date range for any part of the city. No aggregated city-wide number tells you what happened on a specific block over the past six months — the map does.
The Steps That Actually Matter
Start with the quarterly report for the district that contains the address you're evaluating. The reports are broken down by crime category and district, so you can compare the area directly to the city average rather than reading the whole-city number and trying to infer what it means for one street.
Then run the Crime Map for that specific address, filtered to violent crime over the past 12 months. A single incident two years ago reads very differently than a recurring pattern in the past two quarters. Time filtering is what separates a neighborhood with a past from one with an ongoing issue.
Cross-reference with CrimeGrade.org's neighborhood-level breakdown. Their methodology weights incident type and recency differently than a raw count, which is useful precisely because it surfaces the difference between a neighborhood that had one significant event and one that has structural, recurring activity.
What Surprises People After Six Months
Newcomers who moved to Fort Worth from markets like Denver or Phoenix often expect the city-wide crime number to describe their block. It rarely does. The more common experience in Tanglewood, Arlington Heights, or Fairmount is that the statistics feel abstract — the day-to-day reality is quieter than the headline number suggests. The surprise cuts the other way too: buyers who chose a neighborhood based on price alone, without checking the FWPD district data, sometimes find that the city's improving trend line does not describe their specific corridor as cleanly as it does the northwest.
Property crime — particularly car break-ins and catalytic converter theft — is the category that touches the most residents across the widest range of neighborhoods. Even in calmer areas, leaving valuables visible in a parked car remains the practical risk that residents mention most often. It is not a reason to avoid the city, but it is the habit most quickly adopted by people who have been here more than a few months.
The Honest Bottom Line on Fort Worth Safety
Fort Worth is not a uniformly safe city by the numbers, and presenting it as one would be misleading. A violent crime rate of 4.9 per 1,000 residents and a property crime rate of 26.4 per 1,000 residents both sit above Texas and national averages — those figures are real, and they belong in any honest conversation about whether to move here.
The more accurate framing is that Fort Worth is a city with meaningful geographic variation, a visible and funded commitment to reducing crime, and a trend line that has been moving in the right direction. The northwest neighborhoods, and the established historic enclaves on the west side, deliver a safety profile that most families find genuinely comfortable — not a compromise. The east side and certain central corridors are a different calculation entirely.
The city's population of 1,028,117 means that aggregate statistics absorb enormous variation. A buyer who does the neighborhood-level homework — pulls the FWPD district data, runs the Crime Map, and spends time in the specific area rather than just researching it from a spreadsheet — almost always ends up with a clearer picture than the city-wide grade provides. For more on which neighborhoods match different priorities and lifestyles, see the full neighborhoods guide. For what that means in terms of what you will pay, the cost of living page has the pricing context alongside the typical home price of $298,353 (July 2026).
The most honest thing to say about Fort Worth safety is this: the question is not really whether the city is safe. The question is whether the specific neighborhood you're considering is safe — and that is a question the FWPD's own public data is genuinely equipped to answer.
Local Expert Takeaway: Fort Worth's city-wide crime numbers are real but misleading without geography. The northwest — including Tanglewood and Arlington Heights — delivers a safety profile well below the citywide average, while the east side pulls those averages up significantly. The FWPD Crime Data Center and quarterly district reports are the practical tools to use before settling on a neighborhood; the aggregate grade tells you almost nothing useful about a specific block. The improving trend through 2025 is credible and backed by a structural funding mechanism, but property crime — especially vehicle-related theft — is still the everyday risk that touches residents across the widest range of neighborhoods.
Quick Takeaways & FAQs
✅ Fort Worth logged a 14.3% drop in overall crime in Q2 2025 compared to the same period in 2024, with violent crime falling 16.3% — a meaningful and well-documented improvement.
⚠️ The city-wide crime rates sit above Texas and national averages, and the east side sees incident concentrations far higher than the northwest — choosing a neighborhood without checking FWPD district data is a real risk.
📍 The FWPD Crime Data Center lets you filter by offense type and date range for any address in the city — it is the single most useful tool for researching safety before deciding on a neighborhood.
What is Fort Worth's violent crime rate compared to the Texas average?
Which Fort Worth neighborhoods have the lowest crime rates?
Is Fort Worth's crime rate improving?
How do I research crime for a specific Fort Worth address?
What type of crime is most common in Fort Worth's safer neighborhoods?
Moving to Texas?
Tell us what you need help with and we'll connect you with local resources.
