
Most people moving to Stayton ask the safety question the same way: they Google a crime index, see a number, and aren't sure what to do with it. The more useful question is how Stayton compares to the benchmarks that actually matter — and what the numbers look like at the neighborhood level, not just citywide. For a city of 8,292 people tucked into the foothills of the Willamette Valley, the picture is more reassuring than most newcomers expect.
Stayton sits along OR-22, the North Santiam Highway, roughly about 25 minutes to Salem. It is a working agricultural and light-industrial town, not a bedroom suburb that imported its character from somewhere else. The North Santiam River waterfront anchors one edge of the city, trail networks connect parks through the residential core, and the kind of foot traffic that comes with a walkable small-town center tends to have its own deterrent effect. These aren't abstract safety features — they're what residents point to when they describe why the city feels the way it does on a Tuesday evening.
Property crime is the honest complication in Stayton's safety story. The city carries a property crime rate of 22.54 per 1,000 residents — below Oregon's state average but noticeably above the national benchmark. Violent crime is a different story entirely, running well below both state and national figures. That distinction matters enormously when you're choosing a neighborhood, because it shifts the practical conversation from personal safety to securing your vehicle and your home. Understanding both sides of that picture is what this guide is designed to help you do.
The sections below cover the citywide crime numbers in context, how safety varies across Stayton's recognized neighborhoods, what the Stayton Police Department looks like at a staffing and policy level, what residents actually report about day-to-day life, and the practical steps worth taking before you decide on a neighborhood.

The Numbers in Context: Stayton vs. State and National Averages
| Measure | Stayton | Oregon | National | vs. national |
|---|---|---|---|---|
| Violent crime (per 1,000) | 2.45 | 3.3 | 3.7 | 34% lower |
| Property crime (per 1,000) | 22.54 | 24.5 | 18.4 | 23% higher |
State and national figures — Bureau of Justice Statistics, Crime Known to Law Enforcement, 2024 (tables 2 and 3). City figures — AreaVibes crime data. City rates come from a different reporting series than the state and national benchmarks, so read the comparison as a direction, not a precise multiple.
Stayton carries a violent crime rate of 2.45 per 1,000 residents and a property crime rate of 22.54 per 1,000 residents. The engine below this section renders a full comparison table — the short version is that both figures beat Oregon's state benchmarks, but the property crime rate sits above the national one.
The violent crime picture is genuinely good. Oregon's state violent rate runs at 3.3 per 1,000 and the national violent rate at 3.7 per 1,000, both from Bureau of Justice Statistics, Crime Known to Law Enforcement, 2024 (tables 2 and 3). Stayton's figure comes in below both by a meaningful margin. For families concerned about personal safety — assault, robbery, the categories that most directly affect daily life — Stayton's numbers belong in the reassuring column.
Property crime deserves an honest read. The national property crime rate sits at 18.4 per 1,000. Oregon's state property rate of 24.5 per 1,000 gives useful perspective: Stayton beats the state average, and the state itself runs high nationally. You are not moving to a city with an outlier property crime problem — you are moving to a city that reflects a regional pattern. That said, it is the real number, and anyone who tells you otherwise is doing you a disservice.
CrimeGrade.org's independent analysis places Stayton as safer than the Oregon state average overall — a useful directional check, even though their methodology differs from the Bureau of Justice Statistics series. Their estimate of the annual cost of crime per resident comes to $403 — below both national and Oregon state averages on that same metric. City-Data's composite crime index similarly places Stayton well below the U.S. average on its own scale. These secondary sources use proprietary weightings and are not directly comparable to the per-1,000 rates above, but they all point the same direction.
One trend worth knowing: over the past five years, violent crime in Stayton has trended upward while property crime has trended downward. Neither shift is dramatic at this city's scale — small absolute numbers move the rate meaningfully — but it explains why property crime, not personal safety, is the more productive thing to think about when researching specific areas.
Neighborhood Safety: Where Stayton Feels Different
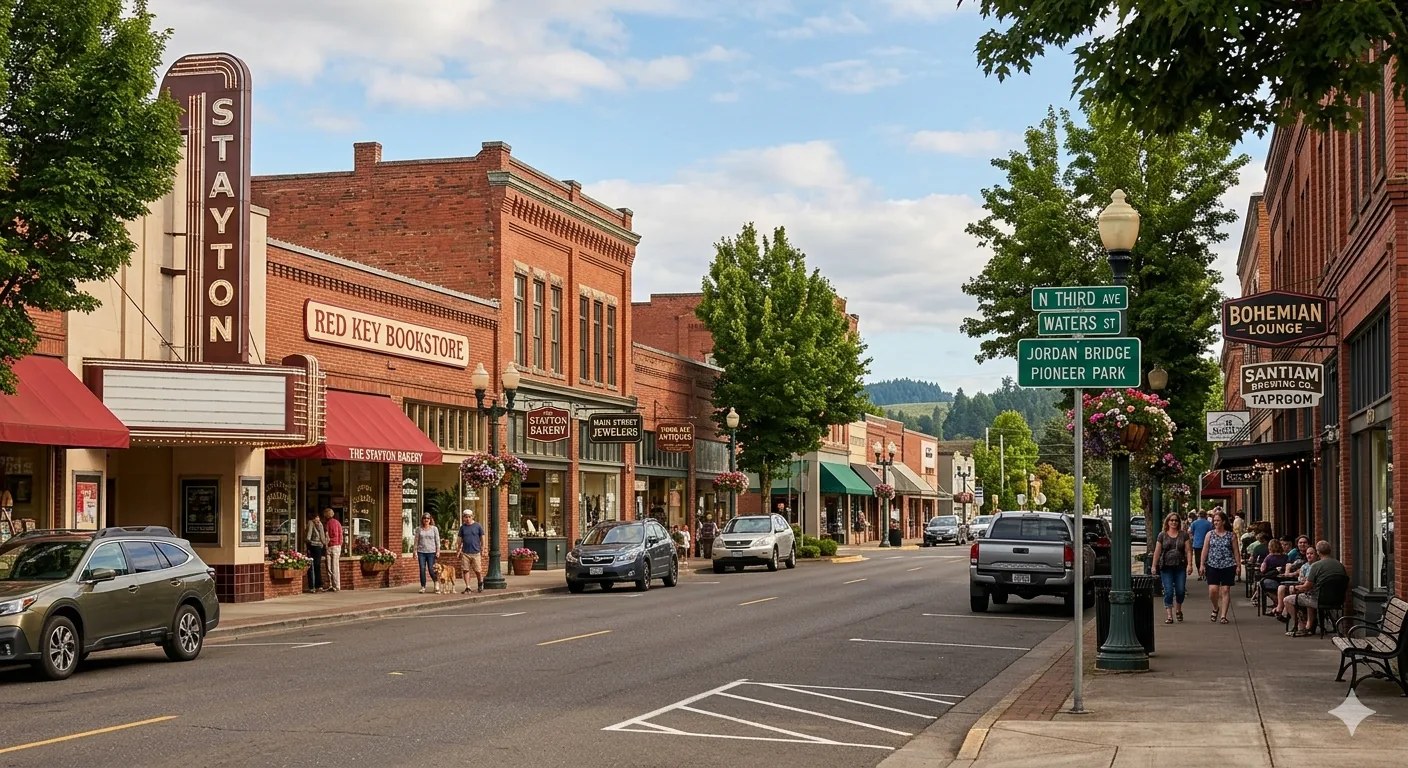
Stayton's neighborhoods don't have the sharp dividing lines you find in larger cities, but they're not all identical either. CrimeGrade.org's resident-sentiment data places the central part of the city among the areas residents consider safest — which aligns with what long-term locals say about Historic Downtown Stayton and the blocks immediately surrounding it.
Downtown Stayton and the Historic Core
The historic downtown core benefits from the things that make any small-town center feel secure: foot traffic, business activity during the day, and a street pattern that keeps eyes on the sidewalk. The Stayton Public Library and the Stayton Farmers Market draw consistent community presence to this area. Residents who live within walking distance of the core consistently report feeling comfortable on foot, including after dark on main commercial streets.
Westown and Hollister Addition
These are established residential neighborhoods with mature tree canopy and owner-occupied housing stock. Neither carries a reputation for elevated crime, and the housing density — mostly single-family homes on standard lots — tends to produce the neighborly familiarity that deters opportunistic property crime better than almost anything else. If you are looking at a home in either area, the practical concern is the same as anywhere in Stayton: visible valuables in vehicles and unsecured outbuildings are the vulnerabilities worth addressing.
Heritage Oaks, Village Creek, and Newer Developments
Heritage Oaks and Village Creek represent Stayton's newer residential growth. Newer subdivisions bring their own dynamics: less established social networks at first, but also newer construction with better lighting and more visible street design. For more on how these neighborhoods compare in character and housing type, the Stayton neighborhoods guide has the full breakdown.
Riverhaven and Fern Ridge
Riverhaven's proximity to the North Santiam River waterfront means strong trail access and consistent outdoor activity — the kind of visible, active community presence associated with lower property crime in small cities. Fern Ridge and Green Acres Park sit at the edges of Stayton's developed footprint, where the transition to rural character begins. That edge-of-city position means slightly less natural surveillance than the denser core, which is the honest tradeoff for the additional space and privacy those areas offer.
The practical takeaway on neighborhoods: Stayton's intra-city safety variation is relatively modest compared to cities many times its size. The factors most worth investigating before you decide on a specific street are proximity to high-traffic commercial corridors and the character of adjacent parcels — not a dramatic neighborhood-level crime divide.
The Stayton Police Department: Staffing and Approach
The Stayton Police Department is a small department that knows the city — the kind of agency where officers build familiarity with the streets and the people on them rather than cycling through an anonymous rotation of calls. Patrol presence is visible in the historic downtown core and in the residential neighborhoods that surround it.
The department operates under a community-oriented policing model, emphasizing high visibility and active engagement with residents and stakeholders. That approach — officers who know the names on their beats, who show up at community events rather than only at incidents — is genuinely different from the reactive-response posture common in larger agencies, and residents notice it.
Police Scorecard data covering 2013 to 2023 recorded no killings by officers during that period. That is a decade of operational data, not a press release, and it says something meaningful about the scale and character of policing in a city of this size.
Oregon's overall crime rate fell 7.3% between 2023 and 2024, with every major reportable category declining statewide, including a steep drop in motor vehicle theft. Stayton's property crime trend moving in the same downward direction over recent years is consistent with that statewide shift — the city is not moving against the regional tide.
One honest note: the Stayton Police Department's annual reports were not publicly accessible online during research for this guide. The city's performance-reporting page exists but no detailed crime summary document was retrievable. That's not a red flag — many small departments don't digitize their annual reports — but it does mean that for granular, current call-for-service data, the department's non-emergency line is worth a direct call if you want specifics about a particular street or block before you decide on a neighborhood.
Looking to buy in Stayton? Estimate your payment.
Enter your numbers to see an estimated monthly mortgage payment.
Estimate only. Excludes HOA fees and mortgage insurance. The interest rate above is a starting point, not a quoted rate — replace it with your own to see real numbers. Insurance is a flat placeholder, not a Stayton quote.
What Residents Actually Say
Statistics describe a population; residents describe a place. The two usually agree, and in Stayton's case they do.
Niche.com community reviewers describe the city as having a sense of community that stands out even by small-town Oregon standards, with residents specifically noting they feel safe in ordinary daily activities — running alone, walking to a neighbor's house, letting kids play in the yard. That kind of granular, behavioral comfort is a different data point than a crime rate, and it is one worth taking seriously.
The friction that does come up, consistently, is property crime — specifically vehicle break-ins. This matches the statistical picture exactly: a property crime rate of 22.54 per 1,000 residents almost always signals opportunistic theft rather than organized or violent crime. Residents who move here and then report frustration usually mention leaving something visible in an unlocked car, which is the same lesson most mid-sized Pacific Northwest cities teach on arrival.
Six months in, newcomers almost universally say the same thing: the city is quieter than they expected, neighbors introduce themselves, and the parks along the North Santiam River waterfront feel genuinely safe at any reasonable hour. Nobody warned them, in a good sense — their mental model of a small Oregon city built around OR-22 traffic was grimmer than the reality.
The Stayton Farmers Market draws the kind of regular, cross-neighborhood community gathering that tends to dissolve the anonymity that makes urban crime easier. When people know each other, when a familiar face is the norm rather than the exception, the social fabric itself does some of the work that a larger police department would otherwise need to do. It is not a safety guarantee, but it is a real and underappreciated factor in how safe a small city actually feels to live in.
Practical Safety Considerations Before You Choose a Neighborhood
Property crime is where Stayton rewards a little preparation. The gap between Stayton's property crime rate and the national figure is real, and the most effective response is behavioral rather than geographic — it does not require avoiding any particular neighborhood.
Vehicle Security
Vehicle break-ins are the dominant property crime category in most small Oregon cities, and Stayton fits that pattern. Visible items in cars — a bag on the seat, a charging cable, anything that suggests something of value inside — are the primary invitation. A habit of leaving nothing visible, combined with using a garage if the home has one, eliminates most of the exposure. This is the single most practical adjustment newcomers can make.
Home Security Basics
Standard deterrents matter more in a city at this crime rate level than in genuinely low-crime towns. Motion-sensing lights on garage and side-entry areas, reinforced door hardware on back entries, and a relationship with a neighbor who notices when something is off are worth more than a monitored alarm system in a small city where response times are fast anyway. The community-oriented policing model the department operates under means officers are accessible; introducing yourself to the local patrol coverage early is genuinely worthwhile.
Checking the Street, Not Just the City
Citywide rates average across everything. Before you decide on a specific block, it is worth understanding what sits adjacent to it: a commercial corridor, a vacant lot at the edge of the city's footprint, or a well-established residential street all carry different practical implications. The city's trail network and park system are spread across 125 acres of open space, and areas with active trail access tend to have higher foot traffic — which works in a neighborhood's favor.
Seasonal Patterns
The city sits at the gateway to recreational areas in the Santiam State Forest and the corridor toward Silver Falls State Park, which means OR-22 carries significant through-traffic in summer and fall. More through-traffic means more unfamiliar vehicles in neighborhoods near the highway corridor — a seasonal pattern worth knowing even though it doesn't dramatically change the city's overall numbers.
For a broader look at neighborhood character and what different parts of the city feel like day to day, the neighborhoods guide covers each area in detail. And if cost of living is the next variable you're weighing — including the typical home price of $471,759 as of July 2026 — the cost of living page has the full breakdown.
Local Expert Takeaway: Stayton's safety picture is better than the numbers first suggest, but only if you read them honestly. Violent crime sits well below both Oregon and national averages — that's the headline most buyers care about. Property crime is the real consideration, running above the national rate while still beating Oregon's state average. The practical implication is simple: this is a city where locking your car matters, where knowing your neighbors matters, and where the North Santiam River trail system and the active community life around the Stayton Farmers Market create the kind of visible, connected neighborhood fabric that small cities with good safety profiles share. The Stayton Police Department's community-oriented approach and manageable size mean you are not dealing with an anonymous, reactive force — officers here tend to know the city and its patterns. Choose a block near the historic downtown core or an established residential neighborhood and your day-to-day experience will almost certainly match what Niche reviewers describe: a place where people feel comfortable running alone, leaving their kids in the yard, and introducing themselves to new neighbors.
Quick Takeaways & FAQs
✅ Stayton carries a violent crime rate of 2.45 per 1,000 residents — meaningfully below both Oregon's state average and the national benchmark, a genuine safety strength for a small city of this size.
⚠️ Property crime runs above the national rate, and vehicle break-ins are the most common category; leaving visible items in unlocked vehicles is the most common way newcomers learn this lesson.
📍 The central part of Stayton — around Historic Downtown and the blocks near the Stayton Public Library — is where residents consistently report feeling most secure, and that matches the CrimeGrade.org neighborhood-sentiment data.
Is Stayton, Oregon a safe place to live?
How does Stayton's crime rate compare to Salem and other nearby cities?
What parts of Stayton are safest?
What type of crime is most common in Stayton?
How large is the Stayton Police Department?
Moving to Oregon?
Tell us what you need help with and we'll connect you with local resources.
