
Monmouth tends to get overlooked in conversations about safe Oregon communities, partly because it sits in Salem's shadow and partly because a college town of 11,428 carries assumptions that don't always match the data. The reality is that Monmouth's crime numbers land well below both Oregon and national benchmarks — not by a narrow margin, but by a meaningful one. That's the headline. The more useful story is what that looks like street by street, and where the picture is less tidy.
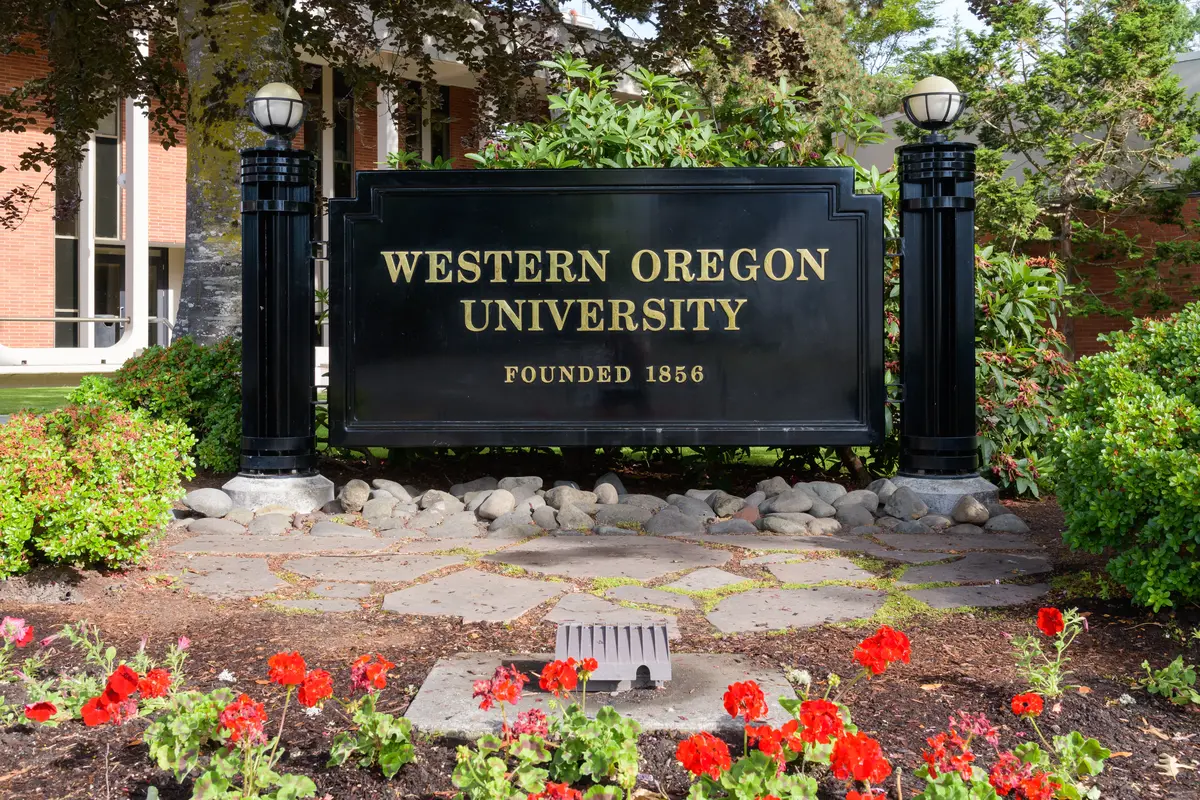
Western Oregon University shapes almost everything about daily life here, including the safety profile. A campus of several thousand students living, walking, and cycling through the city core creates foot traffic patterns that influence where incidents cluster and how the police department allocates attention. The university runs its own 24/7 Campus Public Safety operation, and Monmouth PD retains primary jurisdiction over campus grounds — so the two agencies work in close coordination rather than operating independently. That relationship matters when you're thinking about the neighborhoods that border campus.
The broader context matters too. Monmouth sits in the Willamette Valley, about 20 minutes to Salem, and its size means most residents know their neighbors and notice when something looks out of place. The community feel of a small college town has a genuine effect on the informal safety fabric — kids walking to school, neighbors watching out for each other, a walkable core where unfamiliar activity gets noticed. That's not a substitute for data, but it's a real factor in day-to-day experience.
Whether you're weighing a specific neighborhood, trying to understand what the crime maps actually mean, or just want an honest read on Monmouth's safety before deciding where to land — the sections below break down the numbers, explain where and why crime is concentrated, and tell you what the police department looks like from the inside.

Monmouth Crime Rates vs. Oregon and the Nation
Monmouth carries a violent crime rate of 1.29 per 1,000 residents — well below the Oregon state rate of 3.3 per 1,000 and even further below the national rate of 3.7 per 1,000. For most people considering a move, that's the number that matters most. Violent crime is what people mean when they ask "is it safe," and Monmouth's rate sits at roughly a third of the national figure.
The property crime picture is similarly favorable. Monmouth records a property crime rate of 9.17 per 1,000 residents, compared with an Oregon state rate of 24.5 per 1,000 and a national rate of 18.4 per 1,000. Property crime is where most small cities struggle, particularly those with commercial corridor activity that draws transient traffic. Monmouth's figure runs well below both the state and national benchmarks — a more unusual outcome than the violent crime comparison alone might suggest.
One supplemental way to read these numbers: CrimeGrade.org estimates Monmouth's annual per-resident cost of crime at approximately $245 — a metric that bundles criminal justice system costs and direct victim costs into a single figure. That sits noticeably below the national average and well below the Oregon state average, and it tracks with what the per-1,000 rates show. No single metric tells the whole story, but all of them point the same direction here.
City-Data.com's composite crime index — which draws on a different methodology than the per-1,000 rates used above — showed a meaningful drop in 2024 relative to 2023. That directional signal is worth noting, but treat it as context rather than a precise count: composite indexes aggregate differently than raw reported-crime data, and the authoritative figures are the per-1,000 rates this page is built around.
How Crime Is Distributed Across Monmouth's Neighborhoods
Raw crime rates tell you about a city overall. Where things actually happen inside the city is a different question, and in Monmouth the answer follows a predictable pattern: activity concentrates where people and commerce concentrate.
The North Side and 99W Corridor
The northern part of Monmouth — anchored by the commercial stretch along 99W — records the highest raw incident count in the city. That sounds alarming until you understand the denominator problem: per-capita crime rates use residential population as the base, not the actual number of people present. A commercial corridor draws shoppers, commuters, and visitors all day, every day — none of whom appear in the residential headcount. The result is that the north end can look statistically elevated on a crime map while posing no unusual risk to the people who actually live nearby.
The southeast side of Monmouth records the fewest incidents by raw count. Residents and crime data consistently describe this area as the quietest — lower foot traffic, fewer commercial anchors, and a more uniformly residential character. If minimizing exposure to property crime at the neighborhood level is a priority, this is where the data points. For more on what these neighborhoods look and feel like, the best neighborhoods page goes into each area's character.
Downtown and the University Area
Historic Downtown Monmouth and the Western Oregon University area are the most walkable parts of the city, with students moving between campus and local businesses on foot throughout the day. That foot traffic keeps the streets active and visible — which is generally a safety asset — but it also means the commercial core sees more minor incidents than the quieter residential streets to the south and east. The pedestrian bridge connecting Monmouth to Independence extends this walkable zone across the Ash Creek corridor, and both sides of that bridge stay well-traveled.
Ash Creek Corridor and Edwards Addition
The Ash Creek Corridor runs a quieter, more residential character. Trail access along the creek provides low-traffic recreational routes through the city, passing parks, schools, and community gathering spaces. The Edwards Addition, one of the city's older established neighborhoods, shares this lower-key feel. Neither area carries the commercial traffic that inflates incident counts on the north end.
The honest caveat for any neighborhood-level safety research: crime maps and heat maps are built from incident address data, which skews toward wherever police are called. High-traffic areas generate more calls; quiet residential streets generate fewer. That's as much a reflection of activity as of risk. Spending time in the areas you're considering — different times of day, different days of the week — will tell you more than a heat map alone.
Monmouth's Police Department: What the Coverage Actually Looks Like
For a city of Monmouth's size, the police department is more resourced than many similarly sized Oregon communities. The department maintains a dedicated detective unit — two investigators assigned full-time to felony cases — and holds joint membership on the Polk County Major Crimes Team. That regional partnership is significant: a small-city department couldn't sustain a full detective division independently, but the Polk County arrangement gives Monmouth access to investigative resources well beyond what its size would typically support.
Chief Isaiah Haines has led the department since 2021 and has been with Monmouth PD for 20 years — the kind of institutional continuity that matters in a small-city department where relationships drive community policing. Dispatch runs through the Willamette Valley Communications Center. Patrol vehicles carry mobile data terminals, and the department participates in RAIN — Oregon's COPLINK Node — which enables real-time information sharing with surrounding regional agencies. For a small city, that's a meaningfully connected infrastructure.
Campus Coverage
Western Oregon University runs a separate 24/7 Campus Public Safety operation with uniformed officers who patrol campus, respond to emergencies, and work directly alongside Monmouth PD. The city department retains primary law enforcement jurisdiction over campus grounds, so the two organizations operate in coordination rather than in silos. From a practical standpoint, this means the neighborhoods immediately bordering the campus have layered coverage — both agencies patrol the same geography from different starting points.
One thing that surprises people after a few months in Monmouth: the police department is genuinely visible on the small end of town. Patrol officers know the main streets, the campus edges, and the commercial corridor — a function of coverage area more than staffing ratio. That visibility tends to keep minor issues from escalating, and it's part of why the violent crime numbers look the way they do.
Looking to buy in Monmouth? Estimate your payment.
Enter your numbers to see an estimated monthly mortgage payment.
Estimate only. Excludes HOA fees and mortgage insurance. The interest rate above is a starting point, not a quoted rate — replace it with your own to see real numbers. Insurance is a flat placeholder, not a Monmouth quote.
What Crime Maps Get Wrong About Monmouth
If you've spent any time with online crime maps before researching Monmouth, you've probably seen the same pattern: a cluster of red pins near the commercial north end, lighter coverage elsewhere, and a visual impression that reads as "avoid the north side." That picture is misleading in a specific way that's worth understanding before you use it to make a neighborhood decision.
Per-capita crime rates divide incident counts by the residential population of a geographic area. They do not divide by the number of people actually present. A shopping corridor along 99W might see hundreds of visitors daily — none of whom count in the denominator — while a quiet residential block with 30 households generates almost zero calls regardless of how safe or unsafe it actually is. The result is a systematic bias: commercial and university areas always appear more dangerous than residential areas, even when the residents of both feel equally safe.
The north end of Monmouth is the clearest local example. The retail corridor records the most incidents in the city — but that activity is driven by commercial traffic, not by conditions that threaten residents of the nearby streets. A resident living a block from the commercial strip is not absorbing that concentrated activity on their doorstep; they're experiencing the background ambient activity of a small city's busiest zone.
What to Look at Instead
The more useful question for someone considering a specific street or block is not "what does the heat map show" but "what kind of incidents are these, and who do they involve." Vandalism, vehicle break-ins, and retail theft are common outputs from commercial corridors; they're property nuisances, not threats to personal safety. Violent incidents are the rarer category and the one that actually changes how safe a neighborhood feels to live in day-to-day.
Monmouth carries a violent crime rate of 1.29 per 1,000 residents — the better guide to personal safety than any heat map. Spread across a city of 11,428, that figure translates to a low absolute number of violent incidents, and they are not uniformly distributed. The quieter residential areas in the southeast, the Ash Creek Corridor, and the Edwards Addition see very little of even that modest total.
The practical move is to cross-reference the heat map with the incident type breakdown if your preferred tool provides it, and to weight violent crime incidents far more heavily than property crime when making a neighborhood judgment. The two categories tell genuinely different stories in Monmouth. Tools like CrimeGrade.org and NeighborhoodScout let you look up specific addresses for a more granular read than a city-level figure can provide.
Neighborhood Safety for Families and Long-Term Residents
Families with school-age children tend to care about a specific kind of safety: the walk to school, the park at the end of the street, the general sense of whether a neighborhood watches out for itself. By those measures, Monmouth holds up well. The city is small enough that social networks are visible — people recognize faces on the main streets, neighbors notice unfamiliar cars, and community events at Monmouth City Park and the Western Oregon University campus grounds keep the social fabric active. That informal watchfulness is a real feature of small-city life, not a platitude.
The Ash Creek Natural Area and its trail connections through the city's residential core give parents and kids a low-traffic way to move through Monmouth that stays off the busier commercial streets. The trail routes pass near schools and community spaces, which tends to mean they're used regularly enough to stay well-observed. For the full picture on parks and outdoor access, the parks page covers these connections in more detail.
The University Presence as a Safety Factor
A college campus in the city core is a double-edged element in any safety conversation. On the positive side, WOU's year-round activity keeps the central part of Monmouth populated and watched — a campus that empties in summer is a different story, but WOU maintains enough year-round enrollment and programming to keep the surrounding streets active. Campus Public Safety's 24/7 patrol extends that coverage into the immediate campus neighborhood.
The honest trade-off is that a university population does bring the typical social patterns of a young adult residential community: occasional noise complaints, minor alcohol-related incidents, the kind of low-level disruption that doesn't threaten safety in a meaningful way but can affect the feel of certain blocks during the academic year. Families who prefer a quieter residential environment tend to gravitate toward the southeast side of the city, where the university's footprint fades and the housing stock is more uniformly owner-occupied.
For parents weighing a neighborhood choice, the southeast and Ash Creek sides of the city typically reflect the quietest day-to-day experience by the data. That said, even the busier university-adjacent blocks carry a violent crime exposure that is low by any reasonable standard — Monmouth's numbers hold across the whole city, not just the outlying residential fringe. For context on how safety, schools, and neighborhood character interact across these areas, the neighborhoods guide pulls those threads together.
One thing residents mention that newcomers don't always anticipate: the city's smallness works in both directions. The same social fabric that makes Monmouth feel safe also means things get noticed and talked about quickly. A car break-in on a quiet street becomes known across several nearby blocks by the next morning. That's community connectivity in action — not a sign that Monmouth has a vehicle-theft problem, but a reminder that in a small city, the information environment is very different from a larger metro.

Local Expert Takeaway: Monmouth's crime numbers are genuinely good — a violent crime rate of 1.29 per 1,000 residents that sits at roughly a third of the national figure, and a property crime rate that runs well below both the state and national averages. The north commercial stretch along 99W generates the most raw incidents, but that's a function of retail traffic more than residential risk. Families and long-term residents tend to find the southeast side and the Ash Creek Corridor the quietest corners of the city. The Monmouth Police Department punches above its size through the Polk County Major Crimes Team and the WOU Campus Public Safety partnership. For a Willamette Valley college town of 11,428, this is a meaningfully safe place to live — the data says so, and the day-to-day experience of the neighborhoods bears it out.
Quick Takeaways & FAQs
✅ Monmouth carries a violent crime rate of 1.29 per 1,000 residents — well below the Oregon state average and roughly a third of the national figure, one of the stronger safety profiles in the mid-Willamette Valley.
⚠️ Crime heat maps tend to overstate risk in Monmouth's commercial north end because per-capita rates use residential population as the denominator, not the actual visitor traffic that drives most of the incident count.
📍 The Monmouth Police Department's full-time detective unit holds joint membership on the Polk County Major Crimes Team, giving a small-city department access to investigative resources well beyond what its size would typically support.
Is Monmouth, Oregon a safe place to live?
Which part of Monmouth is considered the safest?
How does Western Oregon University affect Monmouth's safety?
Why do crime maps show Monmouth's north side as a hot spot?
What regional law enforcement resources does Monmouth have access to?
Moving to Oregon?
Tell us what you need help with and we'll connect you with local resources.
