
Most people researching Ashland come in through the Oregon Shakespeare Festival or the Lithia Park trails and leave wondering whether a city this culturally rich could really be as livable as it looks. The safety picture is largely what it appears. Ashland, a city of 21,259 people in Jackson County's southern end, carries a violent crime rate of 2.6 per 1,000 residents — below both the Oregon state average and the national figure. That's not a marketing claim; it's the 2024 law-enforcement data, and it puts Ashland meaningfully below where most cities its size land.
The fuller picture is more nuanced. Property crime is the real day-to-day concern here, and the downtown core — busy with Oregon Shakespeare Festival audiences, Southern Oregon University students, and tourists moving through on I-5 — accounts for a disproportionate share of reported incidents. That concentration matters when you're trying to read neighborhood-level risk. A high count in a commercial zone doesn't tell you much about what life feels like in Oak Knoll or Mountain Meadows. This guide unpacks that distinction so you can read the numbers the way a local does, not the way a raw index does.
There's also a safety dimension that most relocation guides skip entirely: wildfire. Ashland sits directly at the wildland-urban interface, and the city takes that seriously enough to have conducted a community-wide wildfire evacuation drill in October 2025 — described as one of only a handful ever held in the United States. If you're considering a home on the edges of town, that context belongs in your research. The sections below cover crime by the numbers, what the data looks like neighborhood by neighborhood, how Ashland's police approach the downtown corridor, wildfire preparedness, and practical tools for doing your own due diligence before choosing an area.

Ashland Crime by the Numbers: Context First
| Measure | Ashland | Oregon | National | vs. national |
|---|---|---|---|---|
| Violent crime (per 1,000) | 2.6 | 3.3 | 3.7 | 30% lower |
| Property crime (per 1,000) | 17.9 | 24.5 | 18.4 | About the same |
State and national figures — Bureau of Justice Statistics, Crime Known to Law Enforcement, 2024 (tables 2 and 3). City figures — NeighborhoodScout (FBI crime data). City rates come from a different reporting series than the state and national benchmarks, so read the comparison as a direction, not a precise multiple.
Ashland posts a violent crime rate of 2.6 per 1,000 residents against an Oregon state average of 3.3 per 1,000 and a national average of 3.7 per 1,000. On violent crime, the city outperforms both benchmarks by a meaningful margin.
Property crime tells a different story. Ashland posts a property crime rate of 17.9 per 1,000 residents — below the Oregon state figure of 24.5 per 1,000 and close to the national figure of 18.4 per 1,000. Residents are less exposed to property crime than most Oregonians, though the gap with the national average is narrow.
Larceny and theft are the most frequent offenses in the property crime category, followed by destruction, damage, and vandalism. These are the crimes that show up in car break-ins near the Oregon Shakespeare Festival or in opportunistic theft along the commercial strip on Ashland Street — not the kind of violence that changes how a neighborhood feels to live in day to day.
On Niche, 94% of Ashland residents who responded describe the city as either very safe or pretty safe. Resident sentiment and the statistical picture align here, which is not always the case in small cities where a single bad stretch of blocks can skew perception in either direction.
What the Numbers Miss: Downtown Crime Concentration
The single most important thing to understand about Ashland's crime data is where it clusters. The Historic Downtown District — the blocks anchored by Ashland Plaza, the Oregon Shakespeare Festival campus, and the retail and restaurant corridor along the main street — generates the highest incident counts in the city.
That concentration is partly a function of density, not disorder. When tens of thousands of visitors move through a compact commercial zone across a festival season that runs from February into November, the raw count of incidents rises even if the per-resident risk stays low. Areas with high foot traffic and retail establishments simply see more reportable events than quiet residential streets.
The Ashland Police Department's own 2024 annual report documented 40 violent crimes citywide for the year. The department also noted that a policy change in 2024 — now counting weapon displays as reportable use-of-force incidents — accounts for a meaningful share of the statistical increase in use-of-force reports, and that the change reflects more accurate capture of contentious interactions rather than a rise in community violence.
The practical takeaway: if you pull a crime map and see elevated incident markers downtown, zoom out before drawing a conclusion. The same map will show significantly quieter conditions across the residential neighborhoods that make up most of the city's footprint. The City of Ashland operates an interactive crime mapping portal that lets you filter by crime type and area — it's one of the more transparent local tools available and worth bookmarking when you're researching specific neighborhoods.
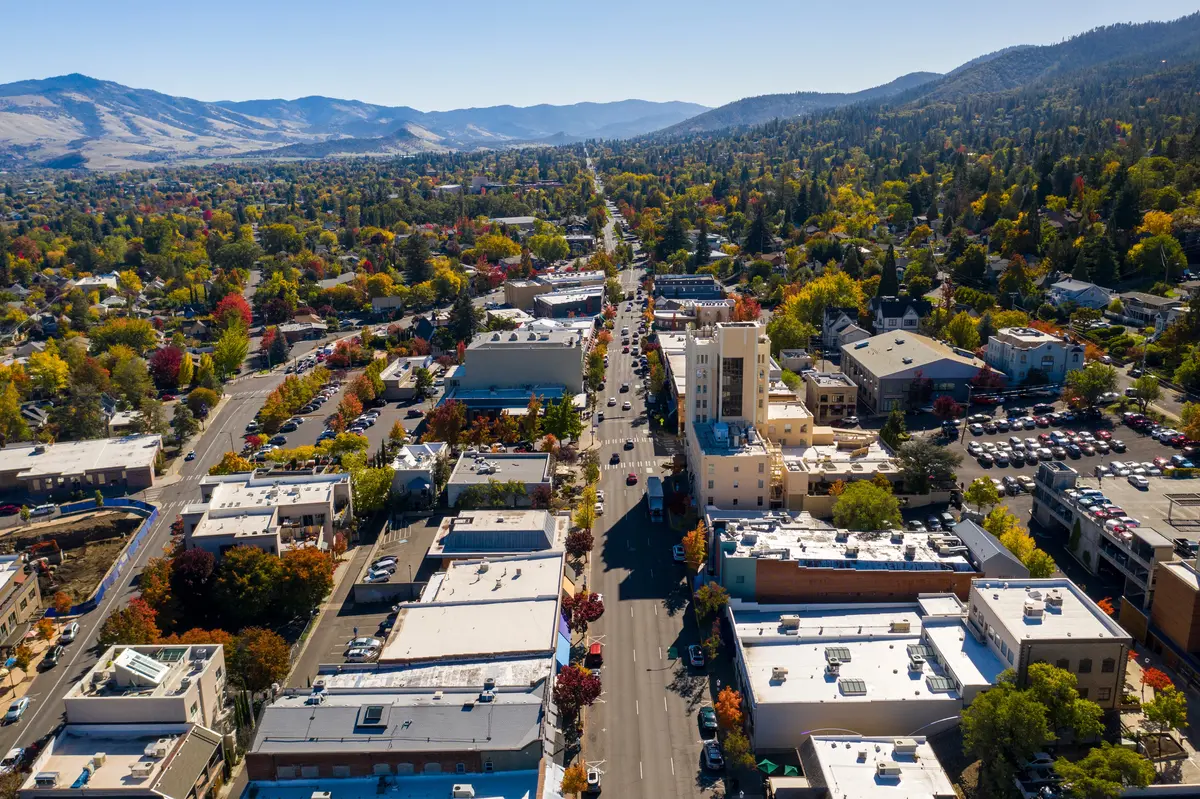
Neighborhood-Level Safety: Where Ashland's Quieter Streets Are
Ashland's safest residential areas are generally concentrated in the south and the hills above town. Oak Knoll and Oak Knoll Meadows, along with the neighborhoods that adjoin them, consistently draw the strongest safety ratings from resident surveys and crime mapping analyses. The distance from the downtown commercial core and the lower pedestrian throughput both contribute to that picture.
Northwest Ashland and North Ashland carry similarly strong safety ratings. Both are largely residential, with the kind of low-turnover, owner-occupied housing stock that tends to correlate with lower property crime. Mountain Meadows, the 55+ community on the north end of the city, operates within its own planned neighborhood structure and sits away from the corridors where most opportunistic crime occurs.
The University District presents the most nuanced read. Southern Oregon University's campus anchors a walkable, active neighborhood, and the mix of student housing and older residential blocks creates some variability. Overall safety ratings for the area remain favorable, but the character differs from the quieter residential pockets to the south.
The Railroad District surprises newcomers. Despite its proximity to downtown, local analyses and resident accounts consistently describe it as peaceful and community-oriented. The historic homes, the walkable street pattern, and the strong neighborhood identity all contribute. It's one of those cases where adjacency to a busy commercial zone doesn't translate into elevated residential risk.
Downtown Ashland itself — the Historic Downtown District — is where the nuance matters most. It's well-lit, heavily trafficked, and policed actively, but it also generates the city's highest incident counts. For residents, that's less a concern about personal safety than it is background awareness about vehicle break-ins and opportunistic property crime near parking areas during festival season.
| Neighborhood | Character | Safety Profile | Best For |
|---|---|---|---|
| Oak Knoll / Oak Knoll Meadows | Quiet residential, hillside setting, lower density | Among the strongest in the city | Families Quiet |
| Mountain Meadows | Planned 55+ community, north end | Low incident profile, planned environment | Quiet |
| Northwest Ashland | Established residential, owner-occupied | Strong safety ratings | Families |
| North Ashland | Residential, lower density than downtown | Strong safety ratings | Families Value |
| Railroad District | Walkable, historic homes, community-oriented | Above average despite downtown proximity | Walkable |
| University District | Campus-adjacent, mixed residential and student housing | Generally favorable, some variability | Renter |
| Downtown Ashland (Historic District) | Commercial core, high foot traffic, festival activity | Highest incident counts; context matters | Walkable |
| Quiet Village | Established residential, southern edge | Residential, lower incident profile | Families Quiet |
Looking to buy in Ashland? Estimate your payment.
Enter your numbers to see an estimated monthly mortgage payment.
Estimate only. Excludes HOA fees and mortgage insurance. The interest rate above is a starting point, not a quoted rate — replace it with your own to see real numbers. Insurance is a flat placeholder, not a Ashland quote.
How Ashland Manages Downtown Safety: The ELEA System
Ashland uses a formal policy tool that most cities its size don't have: Enhanced Law Enforcement Areas, or ELEAs. The first covers most of the downtown business district and has been in effect since 2012. A second, covering the Ashland Street business corridor, was added in January 2025.
Within these zones, police can petition a judge to ban repeat offenders. The threshold is three or more nuisance violations, two or more misdemeanors, or a single assault charge within a six-month window. An exclusion order removes the individual from the zone entirely, not just from a specific block. It's a targeted tool designed to address persistent problematic behavior in commercial areas without relying solely on repeated citation cycles.
The practical effect on residents and visitors is that the downtown core feels more actively managed than you might expect from a city of 21,259. The visible police presence, combined with the ELEA framework, keeps the festival district and the Ashland Plaza area functioning as a genuinely welcoming public space even during peak season when crowds are at their densest.
The flip side is that this level of active management reflects a real underlying dynamic. Downtown does have property crime and periodic disorder issues — the policy exists because the city recognized that a busy commercial zone with significant transient visitor traffic requires deliberate attention. For residents considering the Railroad District or Historic Downtown District, understanding both the management tools and the underlying conditions gives a more accurate picture than either the safety ratings or the raw incident counts alone.
The Safety Risk Most Buyers Don't Research: Wildfire
Wildfire is a real and material safety consideration in Ashland, and it gets far less attention in relocation research than the crime statistics do. The city sits at the wildland-urban interface — where developed residential land meets the forested hillsides and canyons that surround the city on multiple sides.
The city takes this seriously in ways that are measurable. Ashland has established a dedicated emergency-preparedness program with mapped evacuation zones for different parts of the city, a community wildfire protection plan, and a wildfire hotline. In October 2025, Ashland conducted a community-wide wildfire evacuation drill — described at the time as one of only a handful ever conducted in the United States. That drill gave residents in every mapped zone a chance to test actual evacuation routes and communication systems in real-world conditions.
For buyers researching specific neighborhoods, the evacuation zone maps are the single most important tool in this category. Homes at higher elevations and on the edges of town — some of the most attractive properties for views and proximity to Bear Creek Greenway and Ashland Creek Trail — also sit in zones where wildfire response time and evacuation complexity are genuine planning considerations. This isn't a reason to avoid those areas, but it is a reason to look up the zone designation before deciding on a specific location.
Six months after moving here, newcomers are sometimes caught off guard by how concrete the wildfire planning conversations are among neighbors. In a city that hosts the Oregon Shakespeare Festival and Southern Oregon University, you'd expect the dinner-table topics to skew toward arts and academia. Wildfire preparedness turns out to be just as common — and residents who've done the research before arriving are far better positioned to participate in that conversation than those who treated it as an afterthought. The parks and outdoor recreation page covers the trail access and natural areas in more detail.

Local Expert Takeaway: Ashland is genuinely safer than most Oregon cities its size, with a violent crime rate that runs below both the state and national averages. The main honest caveat is property crime concentrated in and around the downtown commercial core — car break-ins near festival parking and opportunistic theft along busy retail corridors are the recurring issues, not the kind of violence that shapes daily residential life. The neighborhoods south of downtown, particularly Oak Knoll and Quiet Village, are where families with kids tend to settle when safety is their first filter. The wildfire piece is real and worth taking seriously: look up your specific evacuation zone before committing to any property on the hillside edges of town.
Quick Takeaways & FAQs
✅ Ashland carries a violent crime rate of 2.6 per 1,000 residents, sitting below both the Oregon state average and the national average and making it one of the safer cities in Southern Oregon.
⚠️ Property crime — especially larceny and vehicle break-ins near the downtown festival district — is the real concern, and buyers should check the city's interactive crime mapping portal before settling on a specific block.
📍 Ashland conducted one of the first community-wide wildfire evacuation drills in the United States in October 2025; every buyer considering a home near the city's hillside edges should look up their evacuation zone designation before choosing a neighborhood.
Is Ashland, Oregon a safe place to live?
Which neighborhoods in Ashland are the safest?
How does downtown Ashland's crime rate compare to the rest of the city?
Is wildfire a serious risk in Ashland?
Where can I find Ashland's crime data to research a specific area?
Moving to Oregon?
Tell us what you need help with and we'll connect you with local resources.
