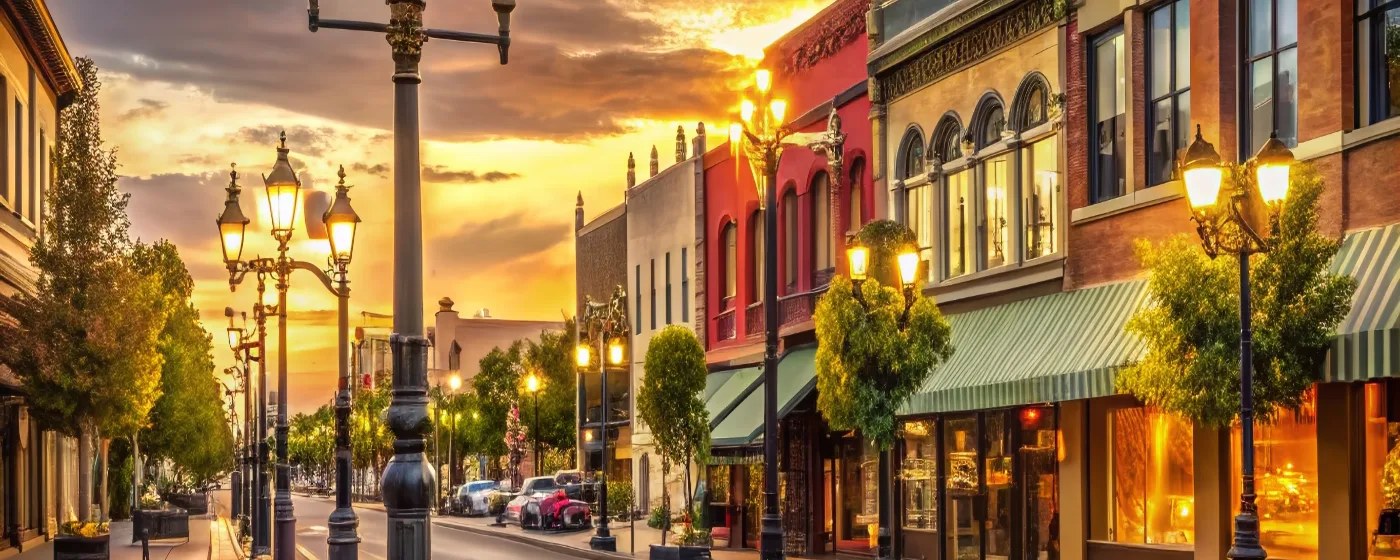
Most people researching Idaho Falls ask the safety question early — and the city's overall numbers hold up well. But the first thing to understand is that Idaho Falls is not one uniform safety picture. The Snake River physically divides the city, and crime risk follows its own geography here, varying enough between the south side, the downtown core, and the northeast that two people can look at the same city-wide statistic and have completely different day-to-day experiences based on where they land.
The city sits at the heart of eastern Idaho, anchored by Idaho National Laboratory — one of the country's largest nuclear research complexes — and Melaleuca Inc., a consumer products company headquartered here. That employer mix draws a steady stream of scientists, engineers, and young professionals. The relative stability of those anchor employers tends to correlate with neighborhood stability across much of the city, and the workforce they attract skews toward long-term residents rather than high-turnover renters.
Living costs here run noticeably below the Boise metro and well below comparable mid-sized cities in the Mountain West, which means Idaho Falls attracts buyers and renters who want the amenities of a real city — the Museum of Idaho, the Snake River Greenbelt, Tautphaus Park Zoo — without the price tag that usually comes with them. That affordability also means the city absorbs growth quickly, and some neighborhoods are changing faster than the crime numbers have caught up with.
Whether you're researching this city seriously or still narrowing down your short list, the sections below break down Idaho Falls's crime figures against state and national context, map the neighborhood-level differences, explain why downtown heat maps mislead first-time researchers, and give you the practical safety filters worth applying before you decide on an area.

Idaho Falls Crime Rates vs. State and National Averages
The headline figures: Idaho Falls recorded a violent crime rate of 3.5 per 1,000 residents and a property crime rate of 12 per 1,000 residents in 2024 — the most recent full year of FBI data.
Put those in context and they look different depending on which benchmark you use.
Against the Nation
The national violent crime rate for 2024 was 3.59 per 1,000 — the lowest recorded since 1969, per FBI and USAFacts reporting released in August 2025. Idaho Falls at 3.5 sits just below that national figure, essentially at the U.S. average for violent crime. That is a reasonable starting point, not a red flag, and not a bragging right.
On property crime, the gap widens more favorably. Idaho Falls's 12 per 1,000 compares well against a national property crime rate of 19.6 per 1,000 — the city's rate is meaningfully lower. CrimeGrade.org's overall city score lands Idaho Falls in the 38th percentile nationally, meaning it's safer than roughly 38% of comparable U.S. cities. That's a middling rank, not a standout, but it puts the city clearly in the functional middle of the pack rather than at the bottom.
Against Idaho
Idaho as a state is an unusually low-crime baseline. The Idaho State Police's 2024 Crime in Idaho Report, released July 2025, recorded just 2.4 violent crimes per 1,000 statewide — noticeably below the national figure — and a property crime rate of 11.1 per 1,000, also well below the national rate. Idaho actually ranked 50th among all states for property crime in 2024, meaning it had the lowest property crime rate in the country that year.
Against that state backdrop, Idaho Falls is somewhat elevated. The city's violent crime rate runs higher than the statewide average, and its property crime rate edges slightly above it. This is typical for any regional hub: Idaho Falls is the largest city in eastern Idaho, drawing retail traffic, services, and transient population from a wide catchment area that includes Blackfoot, Shelley, Rexburg, and beyond. A city that functions as a regional center will almost always show higher raw crime counts than smaller surrounding communities like Ammon or Iona.
| Geography | Violent Crime (per 1,000) | Property Crime (per 1,000) |
|---|---|---|
| Idaho Falls | 3.5 | 12.0 |
| Idaho (statewide, 2024) | 2.4 | 11.1 |
| United States (2024) | 3.59 | 19.6 |
| Idaho Falls vs. National | Slightly below average | Well below average |
| Idaho Falls vs. State | Above state average | Slightly above state average |
| Idaho overall grade (CrimeGrade) | A- — 78th percentile among states | |
Idaho's statewide A- grade from CrimeGrade places the state ahead of 78% of others nationally — a favorable envelope that Idaho Falls sits inside, even if it doesn't lead that envelope.
The Crime Trend: Is Idaho Falls Getting Safer?
The trajectory matters as much as the snapshot. Idaho Falls has seen declining violent and property crime over the past five years, and the 2025 data accelerates that trend sharply.
City-Data.com's June 2026 update reports that Idaho Falls's overall crime index fell 25% between 2024 and 2025. That's a large single-year drop, and it's consistent with a statewide pattern: Idaho's overall crime rate dropped 6.3% from 2023 to 2024 alone, reaching 49.6 offenses per 1,000 — the lowest point in at least 20 years, and roughly half the rate recorded in 2005.
What's Driving the Improvement
Department size matters here. As of 2025, Idaho Falls employed 101 full-time police officers for a city of 72,700 — a staffing ratio that allows meaningful patrol coverage across the city's geographic spread. The department's consistent presence along the Greenbelt corridor and in the downtown zone is a visible part of daily life for residents who use those spaces regularly.
The anchor employer effect is real, too. Idaho National Laboratory and Melaleuca Inc. collectively employ a large share of the local workforce in stable, long-term positions. Economic stability at scale tends to correlate with lower property crime over time — fewer people in desperate short-term situations means fewer opportunistic thefts.
The decline is not a straight line, and a single strong year doesn't guarantee a permanent shift. But the five-year direction and the 25% single-year improvement are both pointing the right way, and that's worth weighing alongside the snapshot figures.

Neighborhood Safety in Idaho Falls: What the Maps Actually Show
City-wide averages flatten the most important thing a relocating family or renter actually needs to know: where in Idaho Falls the risk is concentrated, and where it isn't.
The short version: the south side of Idaho Falls consistently comes out as the lowest-risk area for violent crime. The northeast is the strongest zone for property crime safety. Downtown and the central commercial corridor show elevated counts in both categories — but those figures require careful interpretation before you use them to rule a neighborhood out.
Violent Crime Geography
CrimeGrade's violent crime mapping (updated March 2025) shows the chance of being a victim ranges from roughly 1 in 190 in central neighborhoods to 1 in 478 in the southern part of the city. That's more than a 2:1 difference across a single city. Neighborhoods in the south — including the Sunnyside corridor and areas near Tautphaus Park — generally sit in the lower-risk half of that range.
The Numbered Streets area and parts of the West Side show a more mixed picture. These are older, denser neighborhoods with higher foot traffic and more housing turnover than the newer subdivisions to the south. That doesn't make them dangerous in an absolute sense, but the risk profile is different, and prospective residents should spend time there at different hours before committing.
Property Crime Geography
For property crime, the northeast corner of the city is the resident-level standout: a victimization rate of roughly 1 in 178, compared to 1 in 50 in central neighborhoods. University Place and newer developments near the Snake River Landing corridor tend to attract homeowners who report high satisfaction with neighborhood security — partly because the housing stock is newer and the demographic skews toward dual-income professional households.
Downtown Idaho Falls and the central retail zone log the city's highest property crime counts, with CrimeGrade estimating approximately 182 incidents per year in those areas. But as the next section explains, that number almost always misleads people who see it without context.
| Area of the City | Violent Crime Risk | Property Crime Risk | Best For |
|---|---|---|---|
| South (Sunnyside, Tautphaus Park area) | Lowest in city (≈1 in 478) | Moderate | Families Quiet |
| Northeast (University Place area) | Low to moderate | Lowest in city (≈1 in 178) | Value Families |
| Snake River Landing / Freeman Park | Low to moderate | Low to moderate | Walkable Views |
| West Side / Numbered Streets | Moderate | Moderate to elevated | First-Time Renters |
| Downtown Idaho Falls | Elevated (≈1 in 190) | Highest counts (≈1 in 50) | Walkable Transit |
For a deeper look at how these neighborhoods differ in character and daily feel, see the best neighborhoods in Idaho Falls guide.
Looking to buy in Idaho Falls? Estimate your payment.
Enter your numbers to see an estimated monthly mortgage payment.
Estimate only. Excludes HOA fees and mortgage insurance. The interest rate above is a starting point, not a quoted rate — replace it with your own to see real numbers. Insurance is a flat placeholder, not a Idaho Falls quote.
Why Downtown Crime Numbers Mislead — and How to Read the Maps
If you've pulled up any crime heat map of Idaho Falls and immediately written off the downtown core, you've fallen into the same trap that catches most out-of-town researchers.
High crime counts near downtown, along the Snake River Greenbelt, around Melaleuca Field, and near the Mountain America Center are largely a product of foot traffic, not resident risk. Crime aggregators record incidents where they occur — not where the perpetrator or victim lives. When thousands of people converge on a sports venue, a park, or a commercial strip, the raw incident count rises in that geographic cell. The same effect appears around airports, shopping centers, and entertainment districts in every mid-sized American city.
The Resident vs. Visitor Distinction
If you live in the Numbered Streets neighborhood near downtown, your actual experience of crime risk is different from what a heat map showing 182 property crimes per year in the central zone implies. Those incidents involve visitors, commuters, people passing through, and commercial targets — not just your block. AreaVibes and CrimeGrade both flag this methodology issue explicitly in their 2025–2026 documentation.
This doesn't mean downtown is without risk. Auto break-ins near the Greenbelt parking areas are a real pattern that longtime residents mention — the Snake River corridor draws enough visitors that cars with visible bags or gear get targeted. That's a practical thing to know, not a reason to avoid the area. Lock your car, don't leave valuables in plain sight, and you've eliminated most of the exposure.
How to Actually Use the Data
The most useful safety research for Idaho Falls comes from layering three things: the neighborhood-level maps on CrimeGrade (filter for violent-only, then property-only, separately), conversations with people who already live on a specific street, and a few weekday evening walks in any area you're seriously considering. The maps give you the frame; the walk tells you whether the frame matches reality.
One practical detail locals learn quickly: the stretch of Broadway and Holmes near the downtown transit hub sees the most visible social disorder in the city — not the highest crime counts, but the highest concentration of visible activity that can feel unsettling if you're not used to a downtown environment. That observation doesn't mean it's dangerous. It means that if your threshold for comfort requires zero visible street activity, the downtown neighborhoods will likely disappoint you regardless of what the statistics say.
Practical Safety Tips for Choosing an Area in Idaho Falls
The data is useful, but a few on-the-ground habits will tell you more about a specific block than any crime aggregator can.
Time Your Visits Deliberately
Drive your top-choice neighborhoods after 9 p.m. on a Friday. The gap between how an area presents at 2 p.m. on a Tuesday and how it feels on a weekend evening is where most people get surprised after they've already moved in. The south side neighborhoods near Sunnyside Road tend to feel consistent at both hours. The West Side and Numbered Streets show more variation.
Check the Idaho Falls Police Department Directly
The Idaho Falls Police Department publishes a crime map through their public portal — updated more frequently than the annual FBI cycle. Searching a specific address gives you a 90-day incident radius that no third-party aggregator can match for timeliness. If you're seriously narrowing down between two streets, this is the tool to use.
The Auto Break-In Pattern
Property crime in Idaho Falls is disproportionately vehicle-related. Parking near the Snake River Greenbelt, the Japanese Friendship Garden area, and the Idaho Falls waterfall viewpoints means your car is visible to a high volume of foot traffic. Residents who've lived here more than a year generally don't leave anything in sight — not a gym bag, not a phone mount, not a jacket. It's a minor behavioral adjustment that eliminates the most common property crime exposure in the city.
Newer Construction ≠ Automatically Safer, But It Correlates
The neighborhoods with the lowest property crime per capita in the northeast — areas built primarily in the 2000s and 2010s — benefit from street layouts, lighting standards, and garage-forward housing design that make opportunistic crime harder. Older grid neighborhoods closer to downtown were designed before those considerations mattered. That's not a dealbreaker, but it's a real variable.
What People Don't Expect After Six Months
The thing that surprises most newcomers isn't crime — it's how localized the safety conversation turns out to be. People who land in the south side near Tautphaus Park often say Idaho Falls feels safer than cities they moved from that had better national rankings. People who pick a rental in the older West Side blocks near the rail corridor say the opposite. Both are describing Idaho Falls accurately. The city-wide number doesn't tell you which experience you're signing up for — the specific street does.

Local Expert Takeaway: Idaho Falls sits right at the national average for violent crime and noticeably below the national average for property crime — but neither of those figures matters as much as which part of the city you're in. The south side around Sunnyside and Tautphaus Park consistently records the lowest violent crime risk in the city; the northeast near University Place leads on property crime safety. Downtown's heat-map numbers are real but heavily inflated by retail and event traffic, not resident exposure. The 25% single-year crime index drop in 2025 and five years of declining trends are the most promising signals in the data. Check the Idaho Falls PD's live crime map for any specific address you're considering — it's more current than any aggregator and will tell you more than a city-wide average ever could.
Quick Takeaways & FAQs
✅ Idaho Falls's property crime rate of 12 per 1,000 is meaningfully below the national rate of 19.6 per 1,000, and the city's overall crime index dropped 25% in 2025 alone.
⚠️ Violent crime varies more than 2:1 across the city — central neighborhoods run nearly twice the risk of the south side, so where you land matters far more than the city-wide average.
📍 Downtown crime counts near Melaleuca Field and the Snake River Greenbelt are heavily inflated by visitor and event traffic — auto break-ins in those parking areas are the real, practical exposure for residents.
Is Idaho Falls a safe place to live?
How does Idaho Falls compare to the rest of Idaho for crime?
Which neighborhoods in Idaho Falls have the lowest crime?
Why does downtown Idaho Falls look so dangerous on crime maps?
Is Idaho Falls getting safer over time?
Moving to Idaho?
Tell us what you need help with and we'll connect you with local resources.
