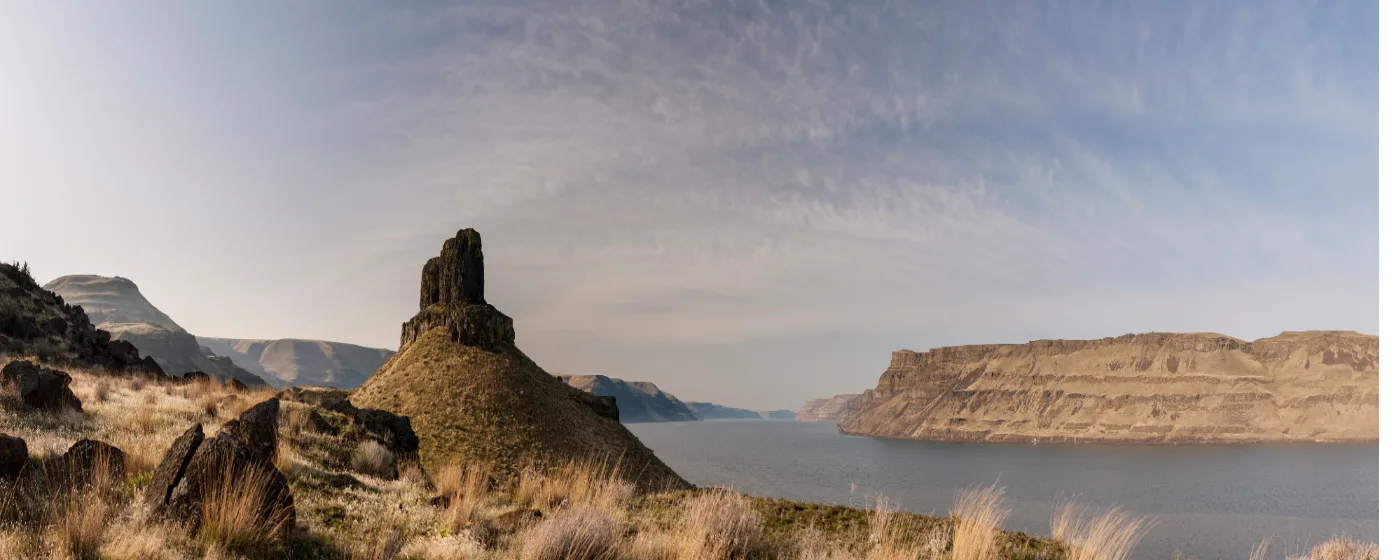
You've probably seen a crime index score for Walla Walla and felt unsure what to do with it. The number looks middling — not alarming, but not reassuring either. What that score doesn't tell you is that Walla Walla draws hundreds of thousands of wine tourists every year through a relatively compact downtown, and those visitors inflate the raw per-capita figures in ways that bear almost no relationship to what daily life feels like for the 34,000 people who actually live here. The city sits in the southeastern corner of Washington, connected to the Tri-Cities metro roughly 45 minutes west via U.S. Route 12, and its character is shaped more by Whitman College, a deep agricultural heritage, and weekend wine-trail crowds than by the dynamics that drive crime in larger urban centers.
The 2024 FBI Uniform Crime Report data — the most current year available, released October 2025 — puts Walla Walla's violent crime rate at 3 per 1,000 residents and its property crime rate at 23 per 1,000. Those figures place the city at or slightly below the Washington state violent crime average, and modestly below the state's property crime rate, which runs noticeably higher than Walla Walla's own number. Washington as a whole ranks among the higher-crime states nationally for property offenses, so landing below the state line is more meaningful than it might initially appear. In a Niche.com resident survey, 82% of Walla Walla respondents described the city as pretty safe or very safe — a sentiment that tracks with the data once you account for the tourism effect on downtown statistics.
The practical safety picture here is dominated by property crime, specifically larceny-theft and vehicle break-ins near commercial corridors, rather than stranger violence. Robbery runs at roughly 0.3 times the national rate — meaning street robbery is genuinely rare. The one violent subcategory that runs above national norms is something prospective residents should be aware of and is addressed directly in the sections below. What newcomers most consistently don't anticipate is how much the rhythm of wine-country weekends — packed tasting rooms on Main Street, overflow parking in commercial lots, a transient visitor population that peaks May through October — shapes the texture of public safety in the downtown core specifically.
Whether you're considering a move or comparing neighborhoods before deciding where to put down roots, the sections below break down Walla Walla's crime data by type and context, compare it against state and national benchmarks, walk through the safety character of each major neighborhood, and give you the practical, ground-level picture that raw statistics miss.
Walla Walla Crime Rates vs. State and National Averages
What the 2024 FBI Data Actually Shows
Walla Walla's violent crime rate of 3 per 1,000 residents sits at or just below Washington state's own rate of approximately 3.29 per 1,000 — a meaningful distinction, since Washington ranks among the higher-crime states nationally. For the average resident, that means Walla Walla's violent crime exposure is roughly in line with living anywhere else in the state, not worse.
Property crime tells an even more favorable story relative to state norms. The statewide property crime rate runs approximately 25 per 1,000; Walla Walla comes in at 23 per 1,000 — modestly below that figure. Both numbers run above the national average, but that reflects Washington's broader property crime profile more than anything specific to Walla Walla.
| Metric | Walla Walla | Washington State | National Avg (approx.) |
|---|---|---|---|
| Violent crime (per 1,000) | 3.0 | ~3.29 | ~4.0 |
| Property crime (per 1,000) | 23 | ~25 | ~19 |
| Larceny-theft (incidents) | 601 | — | — |
| Motor vehicle theft (incidents) | 73 | — | — |
| Robbery rate vs. national | ~0.3× national avg | — | Baseline |
| State safety ranking (WA cities) | #42 of 87 | — | — |
| Year-over-year change (2023→2024) | −9.5% total; −18.7% violent | — | — |
All figures are from the FBI 2024 Uniform Crime Report, released October 2025 — the most recent year available.
The Trend Line Matters
The direction of travel is encouraging. Total crime fell roughly 9.5% from 2023 to 2024, and violent crime specifically dropped 18.7% in the same period. A single year of decline doesn't rewrite the long-term picture, but it does suggest the city isn't trending in the wrong direction.
Walla Walla ranks #42 out of 87 reported Washington cities for safety — squarely in the middle of the state, not clustered near the bottom. That context matters when you're reading a crime index that assigns a score without explaining what it's being measured against.
Understanding What Drives Crime in Walla Walla
The Tourism Effect on Downtown Numbers
Raw per-capita crime figures divide reported incidents by the number of residents. Walla Walla has roughly 34,000 of those. What the denominator doesn't include is the hundreds of thousands of wine tourists who move through downtown tasting rooms, restaurants, and event venues from May through October.
That visitor population parks in commercial lots, leaves valuables in cars, and concentrates in the same blocks of Main Street and surrounding corridors. Vehicle break-ins in those areas account for a disproportionate share of the city's larceny-theft numbers. For residents who park in their own driveways and don't leave bags visible in their cars near busy tasting rooms, the practical exposure is considerably lower than the aggregate rate implies.
What the Numbers Are Actually Measuring
Property crime — primarily larceny-theft — outnumbers violent crime roughly 7.8 to 1 here. That ratio shapes the real safety calculus: Walla Walla's crime story is mostly about opportunistic theft, not personal danger.
Robbery is the clearest indicator of stranger street violence, and Walla Walla's robbery rate runs at approximately 0.3 times the national average. That is genuinely low. This is not a city where you worry about being approached on the street.
One Subcategory Worth Knowing
The one violent crime subcategory that runs above national norms is sexual assault, reported at 69.6 per 100,000 — approximately 1.6 times the national average. This figure is worth naming honestly rather than burying. Elevated rates in smaller college towns often reflect a combination of reporting environment factors and population dynamics, but the number is real and prospective residents — particularly those with college-age family members near Whitman College's campus — should be aware of it. The university has its own campus safety infrastructure and reporting systems, which operate alongside the municipal police department.
The Walla Walla Police Department runs 24 patrol officers and four sergeants across four squads on 12-hour shifts — consistent coverage for a city this size.
Safety by Neighborhood: What to Expect Where
Walla Walla's neighborhoods aren't uniform in their safety character, and choosing where to focus your search based on your priorities makes a real difference. For the full neighborhood profile — geography, housing stock, and character — see the Walla Walla neighborhoods guide. This section focuses on the safety lens specifically.
Downtown Historic District
The downtown core is where the tourism effect is most pronounced. The blocks around Main Street concentrate wine tasting rooms, event venues, and weekend foot traffic that peaks heavily in summer and fall. Vehicle break-ins in commercial parking areas are the most common issue. The neighborhood itself has active street life and good eyes-on-the-street from restaurants and shops, but leaving anything visible in a parked car in a public lot is asking for trouble.
Best for: Walkable residents who understand the tourist-season rhythm and take basic precautions with their vehicle.
Pioneer Park Area
The blocks surrounding Pioneer Park and its rose garden represent one of the more settled, low-incident parts of the city. This is an established residential corridor with long-term owner-occupants, where the texture of the neighborhood feels fundamentally different from the commercial downtown. The park itself draws families through most of the year without the crime concentration typical of urban parks in larger cities.
Best for: Families Quiet residents who want residential calm close to one of the city's anchoring green spaces.
Wa-Hi / College Area
The area surrounding Whitman College carries the nuance you'd expect from any neighborhood organized around a residential college. Student population density, transient rental turnover, and the campus environment all shape what kinds of incidents occur here. The elevated sexual assault figure cited in the citywide data is most relevant to this corridor. The Whitman campus has its own safety resources and reporting infrastructure, but that doesn't eliminate the dynamic entirely.
Best for: Transit residents who are informed about the campus environment and prioritize proximity to the college's academic and cultural offerings.
Mill Creek
Mill Creek runs along the northern and eastern edges of the city's developed areas and gives its name to neighborhoods that tend toward quieter residential character. Distance from downtown commercial corridors means lower exposure to the opportunistic property crime concentrated in tourist zones. This is among the more owner-occupied, stable parts of the city.
Best for: Families Privacy residents seeking lower-traffic residential streets.
Eastside
The Eastside has a more mixed character — a combination of longer-term residents and higher rental turnover than the west side of town. Property crime incidents are somewhat more distributed across this area. It's not an area to avoid categorically, but it rewards more granular research at the block level before settling on a specific street.
Best for: Value First-Time buyers who do block-level research rather than neighborhood-level assumptions.
Blue Mountain Area and Ferndale
The Blue Mountain area and Ferndale, sitting at the outer residential edges of Walla Walla, carry the quietest safety profile of any of the city's neighborhoods. Lower density, more owner-occupied housing, and distance from commercial corridors all contribute. These are the areas where residents most consistently report that the citywide crime statistics feel disconnected from their day-to-day experience.
Best for: Quiet Privacy residents who want the farthest remove from downtown tourist-season dynamics.
Looking to buy in Walla Walla? Estimate your payment.
Enter your numbers to see an estimated monthly mortgage payment.
Estimate only. Excludes HOA fees and mortgage insurance. The interest rate above is a starting point, not a quoted rate — replace it with your own to see real numbers. Insurance is a flat placeholder, not a Walla Walla quote.
What Six Months Here Actually Teaches You
The Wine Season Shift Nobody Mentions
Residents who move here in January often report a mild culture shock when May arrives. The downtown blocks around Colville Street and Main Street fill with visitors from Portland, Seattle, and the Bay Area every weekend from spring through harvest. The safety implication isn't danger; it's that vehicle security in commercial parking shifts from a background thought to an actual habit you develop quickly.
By October, after crush season winds down, the city exhales. The crowds thin, the tasting rooms quiet, and the downtown feels genuinely different. Residents who moved here during the off-season sometimes describe their first wine weekend as a surprise they weren't fully prepared for.
The Vehicle Break-In Habit
The single most consistent safety adjustment new residents make is how they treat their car. Leaving a bag, jacket, or anything remotely valuable visible in a parked vehicle near downtown commercial zones is what consistently generates the incident reports that feed into property crime statistics. Residents who park in their own garages and driveways, and who clear their vehicles before parking in public lots near the tasting room corridor, describe having no meaningful contact with property crime after months or years here.
That's not naivety — it tracks with the data. Larceny-theft accounts for 601 of the reported incidents; it is overwhelmingly opportunistic, not targeted. Simple behavioral adjustments eliminate most of the personal exposure.
Why People Leave — The Honest Version
The residents who move out of Walla Walla rarely cite safety as the reason. The more common drivers are the limited job market for professional careers outside of the institutions — Whitman College, the county government, and local agriculture — and a sense of geographic isolation when the nearest metro is 45 minutes west via Highway 12. Safety concern is almost never the stated reason. That's worth noting when evaluating what the crime statistics actually mean for livability.
Practical Safety Research: What to Look at Before You Choose a Street
The Right Level of Resolution
Citywide crime rates are a starting point, not a destination. Walla Walla is compact enough — 34,000 people across a relatively small footprint — that neighborhood-level and even block-level variation matters more than the aggregate figure. The gap between the downtown commercial corridor on a Saturday in September and a residential street in the Blue Mountain area or Ferndale on any day of the week is significant.
Before settling on a specific area, it's worth spending time there at different hours and on different days of the week, particularly if you're considering streets adjacent to the downtown core or within walking distance of the Whitman College campus. The on-the-ground feel of a block at 9 PM on a Friday in August is genuinely different from a Tuesday afternoon in February.
Tools Worth Using
The Walla Walla Police Department makes incident-level data available through public records. The city is small enough that you can often request block-level incident history without extraordinary effort. Combining that with Washington State Patrol data gives you the most granular picture available.
National platforms like NeighborhoodScout aggregate the same FBI Uniform Crime Report data used throughout this guide, presented in a per-1,000 format that's easier to compare across cities. Washington's statewide law enforcement statistics office publishes annual reports with county-level and city-level figures that allow for year-over-year comparison — useful for confirming whether the 2024 trend line (down 9.5% total, down 18.7% violent) is continuing.
Reading Crime Maps Without Overreacting
Commercial crime mapping tools often display incident-density heat maps that concentrate visually on downtown blocks because that's where incidents are reported — not necessarily because those blocks are the most dangerous for residents. A tasting room parking lot with three vehicle break-ins in a month shows up as a hot spot. A residential street with zero incidents is invisible.
Use density maps to identify which specific commercial corridors see the most property crime activity, then apply that to your parking and storage habits. Don't use them to write off entire quadrants of a city that is, in most of its residential fabric, genuinely quiet.
The One Data Point to Track Annually
The sexual assault rate is the figure most worth monitoring over time rather than treating as fixed. It's the one subcategory that runs meaningfully above national norms, and it's the one where trend data — whether the 18.7% violent crime decline in 2024 is pulling this number down alongside other categories — matters most for a full picture. The FBI releases updated Uniform Crime Report data each October; checking that figure annually gives you the most current read on whether 2024's improvement is holding.
Local Expert Takeaway: Walla Walla's crime profile is shaped more by wine tourism and Washington state's elevated property crime baseline than by anything particular to the city itself. Violent crime runs at or just below the state average; robbery is genuinely rare. The practical precaution that matters most is treating your parked car like you're in a busy commercial district on weekends near downtown — because during crush season, you are. Residential neighborhoods in the Pioneer Park corridor, Mill Creek, Blue Mountain, and Ferndale feel substantially quieter than the raw city aggregate suggests. The one number to watch over time is the sexual assault rate, which runs above national norms and warrants honest awareness, particularly for households with college-age residents near the Whitman campus.
Quick Takeaways & FAQs
✅ Walla Walla's violent crime rate of 3 per 1,000 runs at or below the Washington state average, and robbery is roughly one-third the national rate — street violence is genuinely uncommon here.
⚠️ The city's property crime rate, while modestly below the Washington state average, still runs above national norms, and vehicle break-ins near downtown's wine-tourism corridors are the most practical day-to-day risk residents actually encounter.
📍 Total crime fell 9.5% from 2023 to 2024, with violent crime specifically dropping 18.7% — placing Walla Walla #42 of 87 reported Washington cities for safety, squarely in the middle of the state, not near the bottom.
Is Walla Walla, WA a safe place to live?
How does Walla Walla's crime rate compare to the rest of Washington state?
What type of crime is most common in Walla Walla?
Which Walla Walla neighborhoods are considered safest?
Is the crime rate in Walla Walla getting better or worse?
Moving to Washington?
Tell us what you need help with and we'll connect you with local resources.
