Fife's crime numbers will stop you cold the first time you see them. A violent crime rate of 9.7 per 1,000 residents and a property crime rate of 55.6 per 1,000 — both well above Washington state averages — look alarming on a spreadsheet. But Fife is also one of the most logistics-dense corridors in the South Puget Sound: Interstate 5 bisects it, freight yards and truck stops line Pacific Highway, and the Emerald Queen Casino draws tens of thousands of regional visitors every year. Every incident involving a visitor, a trucker passing through, or a casino patron gets counted against roughly 10,949 residents. That math matters before you draw conclusions.
The gap between Fife's raw statistics and its day-to-day residential experience is real and documented. Crime analysis platforms that map incident density flag the I-5 commercial strip as the primary driver of the city's elevated figures. Resident reviews describe southwest Fife and the hillside neighborhoods as noticeably quieter than the Pacific Highway corridor. The city is not a uniform block of risk — it has a concentrated trouble zone and several genuinely calm residential pockets, and knowing which is which is the most practical thing you can do before deciding on a neighborhood.
The trend line also deserves mention. OpenCrime's five-year analysis of FBI data shows Fife's violent crime dropping roughly 33.6% from the prior year — and Washington state's overall crime rate fell 14.1% between 2023 and 2024, the broadest single-year improvement in recent memory. None of that erases the elevated baseline, but it changes the story from a static crisis to a city with meaningful momentum in the right direction.
This guide breaks down Fife's crime figures against state and national benchmarks, examines what's actually driving the numbers, maps the variation across Fife's neighborhoods, and gives you the practical tools — including the Fife Police Department's public crime mapping portal — to research specific blocks before you decide on a neighborhood.

Fife Crime Rates vs. State and National Benchmarks
The starting point for any honest safety assessment is a fair comparison. Fife's city fact sheet records a violent crime rate of 9.7 per 1,000 residents and a property crime rate of 55.6 per 1,000 for 2024. Washington state's averages for the same year — drawn from FBI Uniform Crime Report data — were 3.3 violent and 24.7 property crimes per 1,000.
| Geography | Violent Crime (per 1,000) | Property Crime (per 1,000) |
|---|---|---|
| Fife, WA (2024) | 9.7 | 55.6 |
| Washington State (2024) | 3.3 | 24.7 |
| National Average (2024) | 3.59 | ~17.6 est. |
| Tacoma, WA (peer city) | Elevated (per SafeHome #2 WA) | Elevated |
| Puyallup, WA (peer city) | Below Fife | Below Fife |
| Milton / Edgewood | Significantly lower | Significantly lower |
Fife's violent crime rate is roughly three times the state average — a gap that is genuinely significant, not a rounding error. SafeHome.org, using FBI 2023 UCR data, ranked Fife first in Washington state for violent crime rate among cities that report data, ahead of Tacoma.
Property crime is the dominant issue. At 55.6 incidents per 1,000, it outpaces the state figure by more than double. Motor vehicle theft is the standout subcategory — consistent with Washington state's broader position near the top of national rankings for vehicle theft. That statewide context is worth holding: Washington ranked second worst in the nation for property crime overall, so Fife's elevated numbers sit inside an already-elevated state environment.
The national violent crime rate in 2024 was 359.1 per 100,000 residents. Fife's translates to approximately 970 per 100,000 — well above that figure. No amount of contextualization erases that gap. What context does is help you understand where that risk is concentrated, which is where the next section picks up.
Why Fife's Numbers Look Worse Than They Feel: The I-5 Effect
The Geographic Reality
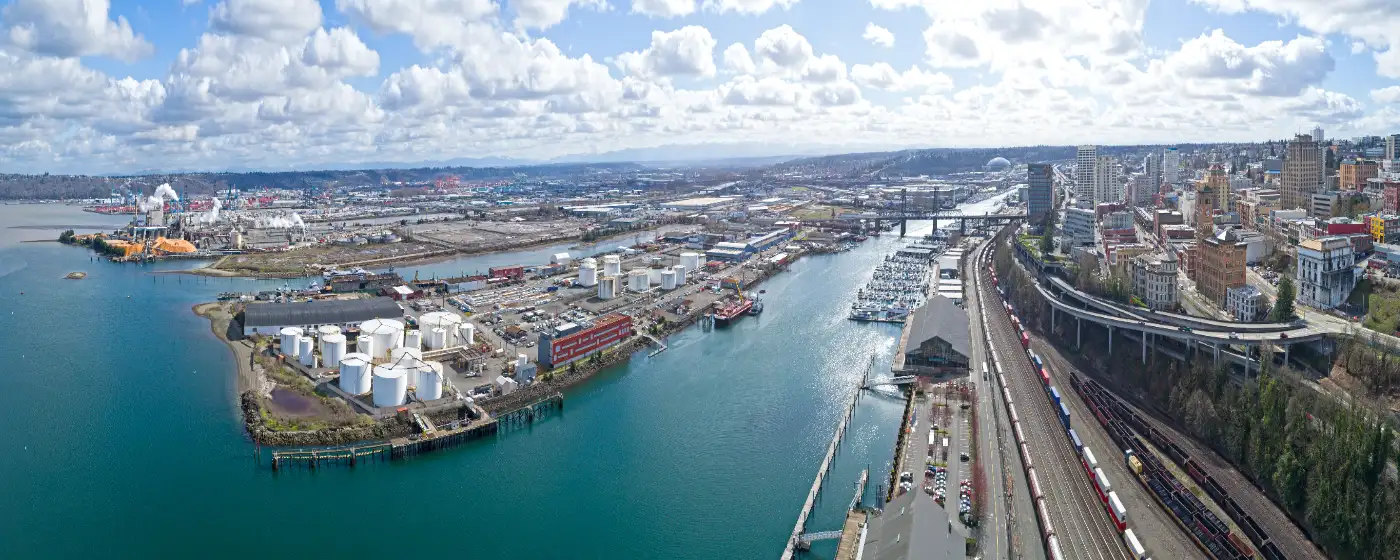
Fife is not shaped like a typical suburb. It is shaped like a logistics hub. Interstate 5 runs straight through it. Pacific Highway East — the old pre-freeway arterial — carries freight traffic, truck stops, budget motels, and the Emerald Queen Casino side by side with fast-food drive-ins and light industrial businesses. That corridor generates the overwhelming majority of reported incidents in the city.
When a casino patron is robbed in the parking structure, that offense is counted against Fife's 10,949 residents — not against the regional population that actually uses the casino. The same logic applies to theft at truck stops, incidents at budget motels catering to travelers, and any crime involving someone just passing through on I-5. Crime analysts who study per-capita methodology explicitly flag this gap: high-traffic venues like casinos inflate per-capita crime figures for small cities because the denominator (residents) is tiny relative to the daily footprint the city actually serves.
What the Per-Capita Math Actually Means
Fife's daytime population — people working in the distribution centers, visiting the casino, using the truck stops — almost certainly exceeds the residential count on any given weekday. If you denominated reported crimes against that fuller population, the per-capita rate would look materially different.
Independent analysis of Washington's most dangerous cities has identified the same dynamic: Fife's I-5 commercial corridor is the primary driver, not the residential grid. That is a meaningful distinction for someone deciding where to live. The risk along Pacific Highway is real. The risk in the quieter residential neighborhoods on either side of that corridor is a different story.
What This Doesn't Excuse
The I-5 effect explains part of the gap — it does not explain all of it. Property crime, particularly motor vehicle theft, is elevated even in residential pockets. If you park a vehicle on the street near Pacific Highway, your risk is genuinely higher than the state average. Understanding the corridor-versus-residential split is the most useful frame; pretending the numbers are purely statistical noise would be misleading.

Neighborhood Safety Breakdown: Where the Risk Concentrates
Fife's neighborhoods vary meaningfully in their safety character — the city is not a uniform risk. Here is how the seven canonical areas break down based on available research and resident reporting.
| Neighborhood | Safety Character | Primary Concern | Best For |
|---|---|---|---|
| Pacific Highway / Interurban Corridor | Highest-risk zone in the city | Property crime, transient activity, proximity to I-5 commercial strip | Commuters |
| West Fife | Moderate; residential buffer from highway | Vehicle theft in street-parked areas | Families Value |
| Fife Heights | Quieter; elevated position above corridor | Limited; mostly residential | Families Quiet |
| Fife Highlands | Among the calmer areas in the city | Low reported incident density | Families School |
| Sunrise | Moderate; mix of residential and light commercial | Property crime near commercial edges | First-Time |
| Alderwood | Quieter residential character | Minimal; largely single-family grid | Quiet Families |
| East Fife | Moderate; closer to industrial zones | Vehicle theft, commercial-area spillover | Commuters Value |
The consistent pattern in resident reviews: the farther you get from Pacific Highway and the I-5 interchange, the more the neighborhood feels like a conventional South Puget Sound suburb. Resident survey data specifically flags southwest Fife — which includes Fife Heights and Fife Highlands — as noticeably calmer.
One honest caveat: Fife is a small city. Even its quietest neighborhoods are within a short drive of the commercial corridor. That proximity means the distinction is about your immediate block environment, not complete insulation from the city's broader challenges.
What Locals Know About Pacific Highway
Anyone who has lived in Fife for more than a few months will tell you the same thing: Pacific Highway itself is a different experience from the residential streets that run parallel to it. The budget motels clustered between the Emerald Queen Casino and the freight yards have a persistent association with property crime and occasional more serious incidents. Choosing a home more than a few blocks off that corridor is the single most practical decision you can make to improve your day-to-day safety experience in Fife.
Looking to buy in Fife? Estimate your payment.
Enter your numbers to see an estimated monthly mortgage payment.
Estimate only. Excludes HOA fees and mortgage insurance. The interest rate above is a starting point, not a quoted rate — replace it with your own to see real numbers. Insurance is a flat placeholder, not a Fife quote.
Property Crime in Fife: The Real Day-to-Day Risk
If you are moving to Fife, property crime is the category that will affect your daily life most directly — not violent crime. At 55.6 incidents per 1,000 residents, the property crime rate is where Fife diverges most sharply from neighboring cities.
Motor Vehicle Theft: The Standout Risk
Motor vehicle theft is the subcategory that earns the most resident commentary. Washington state is already near the top of national rankings for vehicle theft — third worst in the nation by one recent multi-year assessment — and Fife's commercial corridor amplifies that baseline. Residents parking near Pacific Highway or the I-5 interchanges report higher theft frequency than those in the residential grid further from the highway.
The practical implication is straightforward: if your home has a garage, use it. If you park on the street, the block you choose matters more in Fife than it would in Puyallup or Edgewood. A steering wheel club is not an unusual sight on residential streets here in a way it might not be two miles east in Milton.
What Drops Significantly Away from the Corridor
Break-ins and theft from vehicles also concentrate around the commercial strip — the truck stops, the casino parking areas, and the motels on Pacific Highway. Residential neighborhoods away from that zone see a materially lower incident density, according to the Fife Police Department's Community Crime Mapping data.
That portal — available publicly at fifewa.gov/crime-mapping — lets you filter reported incidents by address and category. Pulling up the specific blocks you are evaluating before you decide on a neighborhood is genuinely useful and takes about five minutes. It is the most direct way to see whether a particular street is in a quiet patch or near a cluster.
The Seasonal Surprise Few Newcomers Expect
One thing people who move to Fife in summer often don't anticipate: the Emerald Queen Casino's event calendar accelerates in fall and winter, drawing larger regional crowds when there is less outdoor competition for entertainment. That means parking-lot incidents and Pacific Highway activity can actually increase in the colder months — the opposite of what you might expect from a city that quiets down seasonally. If you are evaluating a home near the casino end of the city, a late-October or November walkthrough gives you a more representative picture than a July visit.
The Trend Line and Practical Safety Research Tools
Is Fife Getting Safer?
The directional evidence is genuinely encouraging, even if the absolute numbers remain elevated. OpenCrime's five-year analysis of FBI data for Fife shows violent crime improving, with a roughly 33.6% drop from the prior year. Washington state's overall crime rate fell 14.1% between 2023 and 2024 — a single-year improvement that analysts describe as the most significant in recent memory.
Neither figure means the work is done. A 33% drop in violent crime from an elevated baseline still leaves the rate above state and national averages. But it does distinguish Fife from cities where crime is static or worsening — and for someone deciding whether this is a city worth betting on over a five-to-ten year horizon, that trajectory matters alongside the snapshot.
How to Research a Specific Block Before You Decide
Three tools give you the most actionable picture for any specific address in Fife:
- Fife PD Community Crime Mapping (fifewa.gov/279/Crime-Mapping) — the city's own portal, drawing on reported incidents. Filter by incident type and date range to see what has happened on a specific street in the last 90 days.
- CrimeGrade.org's Fife map — a heat-map visualization that shows how incident density shifts as you move away from Pacific Highway. The southwest residential areas appear consistently lighter than the corridor.
- The Niche resident review section for Fife — less useful for statistics, highly useful for understanding which specific streets and intersections longtime residents flag as areas to avoid.
One ground-truth check that no database replaces: drive Pacific Highway between the I-5 interchange and the Emerald Queen Casino on a weekday evening, then drive two blocks off it into a residential street. The contrast is immediate and visceral. You will understand the city's safety geography in about fifteen minutes that no crime map fully conveys.
Why People Move Out — and Why Some Stay
The honest reason people leave Fife for Puyallup or Edgewood after a year or two is usually property crime — specifically a car break-in or a theft that, combined with the ambient energy of Pacific Highway, tips the scales. It is rarely a violent incident; it is the cumulative friction of living adjacent to a high-traffic commercial corridor. The people who stay long-term tend to be in the residential neighborhoods with garages, away from the highway, where the day-to-day experience is much closer to a conventional Pierce County suburb than the raw statistics suggest.

Local Expert Takeaway: Fife's crime statistics are real and should not be minimized — but they are also substantially driven by the I-5 commercial corridor, the Emerald Queen Casino, and the truck stops on Pacific Highway, all of which generate incidents counted against a residential population of under 11,000. Before deciding on a neighborhood, spend five minutes with the Fife PD's Community Crime Mapping portal at fifewa.gov to pull incident data for the specific blocks you are considering. Fife Heights and Fife Highlands in the southwest consistently show the lowest incident density. East Fife and anything adjacent to Pacific Highway show the highest. The city is trending in the right direction on violent crime, but motor vehicle theft remains the daily reality that new residents most consistently underestimate.
Quick Takeaways & FAQs
✅ Fife's violent crime dropped roughly 33.6% year-over-year per OpenCrime's five-year FBI analysis — the trend line is moving in the right direction even as absolute rates remain above state averages.
⚠️ At 55.6 property crimes per 1,000 residents, motor vehicle theft is the category that hits Fife residents most directly — especially those parking near Pacific Highway or the I-5 interchanges.
📍 The Fife PD's free public Community Crime Mapping portal at fifewa.gov/279/Crime-Mapping lets you filter incidents by specific block and date range — the most practical tool for evaluating any address before you decide on a neighborhood.
Is Fife, WA a safe place to live?
How does Fife's crime rate compare to Tacoma and Puyallup?
What type of crime is most common in Fife?
Which neighborhoods in Fife are the safest?
Is Fife's crime rate improving?
Moving to Washington?
Tell us what you need help with and we'll connect you with local resources.
