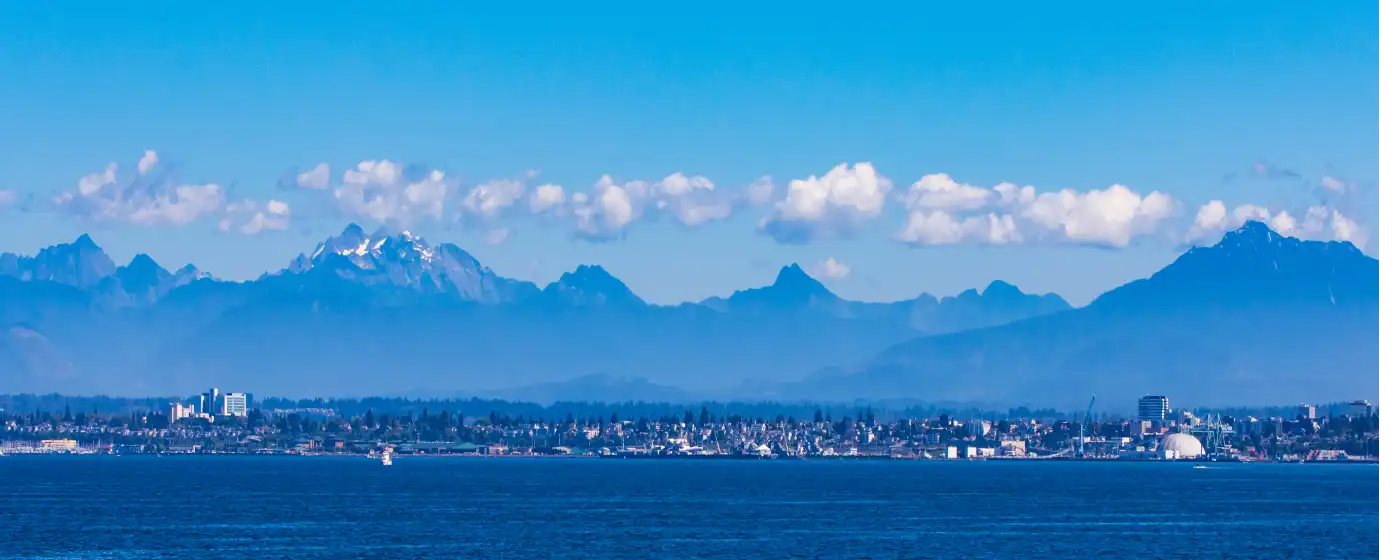
People sizing up Everett for a move often land on the same question fast: is this actually a safe city, or is it one of those places where the price looks right until you understand why? The honest answer is more layered than either a reassuring yes or a cautionary no. Everett is a working port city of about 112,000 people, anchored on the north end of Puget Sound along I-5, and it carries the real-world complexity that comes with that — a mix of waterfront investment and industrial history, military presence and transit corridors, longtime working-class neighborhoods and newer residential growth on the fringes.
The top-line numbers tell a story worth reading carefully. Everett's violent crime rate of 2.65 per 1,000 residents (FBI Uniform Crime Report, 2024) comes in below Washington state's rate of 3.29 per 1,000 and below the U.S. national figure of 3.59 per 1,000. That's not what most people expect when they've heard Everett described as gritty. Property crime is the genuine concern — at 32.19 per 1,000, it runs well above the national norm — and that gap is something any buyer or renter needs to understand before deciding on a neighborhood.
The direction of travel matters as much as the snapshot. Everett's violent crime fell approximately 17% year-over-year in 2024, with property crime dropping roughly 21% over the same stretch — the largest single-year decline the city had recorded in recent history. City-Data.com's 2025 figures show an additional 26% overall decline, and violent crime has been on a decreasing trend for five consecutive years. None of that erases the property crime reality, but it does put it in a different frame than a static number alone would suggest.
The sections below break down Everett's crime statistics against state and national benchmarks, explain where within the city risk is concentrated, walk through what's actually driving the property crime figures, and describe what the Everett Police Department has deployed to address the gap — so you can make a grounded, specific decision about which part of Everett works for you.

How Everett's Crime Rate Compares to the State and Nation
The Numbers in Context
Everett's violent crime rate of 2.65 per 1,000 residents places it below both Washington state (3.29 per 1,000) and the U.S. national average (3.59 per 1,000), based on FBI Uniform Crime Report data for 2024. For a port city of its size, that's a meaningful position — many comparable Pacific Northwest cities with similar industrial and transit footprints run higher.
Property crime is where the picture shifts. At 32.19 per 1,000, Everett's rate is noticeably higher than the national figure of 17.60 per 1,000. That gap is real, and anyone who tells you otherwise is doing you a disservice.
The Washington State Effect
It's essential to understand that Everett's property crime challenge is not unique to Everett — it reflects a statewide pattern. Washington ranked 3rd worst in the nation for property crime in 2024, driven by larceny-theft (66.3% of all property crimes statewide) and motor vehicle theft (17.6%). Moving from, say, suburban Colorado or the Midwest to anywhere in Washington means adjusting your baseline expectations for property crime.
| Geography | Violent Crime (per 1,000) | Property Crime (per 1,000) |
|---|---|---|
| Everett, WA | 2.65 | 32.19 |
| Washington State | 3.29 | 24.67 |
| U.S. National Average | 3.59 | 17.60 |
* Sources: FBI UCR 2024 via USAFacts and PlainCrime; Everett figures from city fact sheet, consistent with FBI UCR 2024 direction.
On violent crime specifically, Everett actually outperforms its own state. The property crime figure, while elevated, needs to be read against Washington's broader context — not just a national benchmark that reflects states with fundamentally different legal and socioeconomic conditions.
Where Crime Is Concentrated: The Geographic Reality
Southwest vs. Southeast — Two Different Experiences
One of the most important things to understand about Everett is that crime is dramatically uneven across the city. This is not a place where a single citywide number tells you anything useful about a specific street.
The southwest part of the city sees the highest concentration of violent crime — approximately 212 incidents per year based on CrimeGrade.org's March 2025 analysis. The northwest, by contrast, reports roughly 4 violent incidents per year. That's not a rounding error; it's a fundamental geographic divide. Residents consistently describe the southeast as the safest part of the city, a characterization that aligns with the data.
What This Means for the Neighborhoods You're Researching
The eight neighborhoods most relevant to buyers and renters — Silver Firs, Twin Creeks, Port Gardner, Riverside, Bayside, Northwest Everett, Pinehurst, and Glacier View — sit across very different parts of this map. Silver Firs and Twin Creeks anchor the southeastern residential fringe and carry notably lower incident rates. Port Gardner, Riverside, and Bayside cluster near the waterfront and downtown core, where property crime is more active. Northwest Everett's low violent crime count reflects its quieter character, though proximity to certain transit corridors affects the picture there too.
For neighborhood-level character details beyond the safety angle, the full neighborhoods breakdown covers each area's feel and trade-offs in depth.
The Downtown and Transit Corridor Question
The areas immediately surrounding the Everett Station transit hub and portions of Hewitt Avenue have historically shown higher property crime activity — this is consistent with transit corridors in most mid-sized Pacific Northwest cities, not a quirk unique to Everett. If a specific address puts you within a few blocks of a transit center, that's worth factoring in before you commit to a neighborhood, not just after.

Understanding the Property Crime Number: It's Mostly Vehicle Theft
What's Actually Driving the Statistic
Property crime in Everett is elevated, and the primary driver is motor vehicle theft — not burglary, not home invasion. Washington's vehicle theft rate increased 110.2% between 2019 and 2023, more than twice the national increase of 44.9% over the same period. Everett's elevated property crime rate largely reflects participation in that statewide surge.
This distinction matters practically. The risk profile for a family weighing neighborhood safety is meaningfully different from the risk profile for a car owner without a secure garage. Both are real concerns — but they're different concerns requiring different responses.
What This Means Day-to-Day
If you're moving from a state where car theft barely registers as a concern, Washington in general — and Everett in particular — will require a habit adjustment. Covered or secured parking matters more here than it does in most of the country. The city has deployed a 71-camera Flock Safety license-plate-reader network specifically targeting vehicle theft, and it has produced recoveries, but the underlying trend is broad enough that individual precaution remains the most reliable protection.
Home burglary and personal property theft are real but not the outsized driver the topline number might suggest. Violent crime against persons — assault, robbery — runs below both state and national norms, which most newcomers find surprising given Everett's reputation in regional real estate conversations.
Six Months In: The Surprise Nobody Mentioned
People who move to Everett from lower-crime-rate metros consistently report the same friction point after about six months: it's not personal safety that catches them off guard, it's the car. Packages left in vehicles overnight, unlocked cars on residential streets, and poor parking choices near Colby Avenue after dark all produce consequences here that they didn't in Phoenix or Sacramento. The adjustment isn't dramatic — it's the kind of behavioral recalibration that becomes second nature — but it tends to catch newcomers who weren't warned.
Looking to buy in Everett? Estimate your payment.
Enter your numbers to see an estimated monthly mortgage payment.
Estimate only. Excludes HOA fees and mortgage insurance. The interest rate above is a starting point, not a quoted rate — replace it with your own to see real numbers. Insurance is a flat placeholder, not a Everett quote.
The Trend Line: Everett's Crime Is Moving in the Right Direction
Five Consecutive Years of Decline
Crime trends matter more than any single year's snapshot, and Everett's trajectory is unambiguous. Violent crime has been on a decreasing trend for five consecutive years, based on City-Data.com's compilation of EPD data through 2025. The 2024 single-year drop — approximately 17% for violent crime and 21% for property crime — was the largest the city had recorded in recent memory.
The 2025 figures extend that pattern: overall crime fell roughly 26% compared to 2024. That pace of improvement is not something you see in cities where the underlying conditions aren't changing.
What Changed
The Everett Police Department added 100 officers over the past five years. As of 2025, EPD employs the highest number of patrol officers per 1,000 residents compared to peer Washington cities, and has more officers on active patrol than at any point in over a decade. Staffing levels in police departments have a documented relationship with response times and deterrence — this is a real operational shift, not a press release claim.
Alongside the staffing increase, the city deployed 71 Flock Safety license-plate-reader cameras and 3 pan-tilt-zoom cameras across the city, funded in part through state and federal grant programs focused on auto theft prevention. The license-plate-reader network is specifically calibrated to address vehicle theft — the dominant property crime driver — with real-time alerts to patrol units.
What Hasn't Changed Yet
Five years of declining violent crime and a single strong year of property crime reduction don't erase an elevated baseline. Everett's property crime rate remains well above the national norm. The trend is the story to watch — but residents who evaluate a neighborhood only on momentum risk overweighting what could still reverse. Use the trend as context, not a substitute for checking current incident maps for a specific street before you settle on an address.
Practical Safety Research: What to Check Before You Decide on a Neighborhood
Go Granular, Not Citywide
A citywide crime rate tells you almost nothing about the specific block you're considering. In Everett's case, the gap between the southwest quadrant and the southeast residential neighborhoods is so wide that the average obscures more than it reveals. Before deciding on any neighborhood, pull the incident-level map for that specific address rather than relying on neighborhood-level aggregates.
CrimeGrade.org, SpotCrime, and the Snohomish County Sheriff's public incident data all offer address-level or block-level filtering. These tools take fifteen minutes to use and will tell you whether a given address sits in a high-density incident zone or well outside one.
Secured Parking Is a Real Factor
Given that motor vehicle theft is the primary driver of Everett's property crime rate, whether a home or apartment has a garage or secured off-street parking is a practical safety variable — not just a convenience one. This is not typical advice for most U.S. markets. In Everett, and in Washington generally, it belongs in your evaluation criteria alongside commute time and school proximity.
Community Watch and Neighborhood Associations
The City of Everett operates a Community Watch program — a city-funded update to the traditional Block Watch model — that works alongside existing Neighborhood Associations to strengthen block-level connections and support safety. For neighborhoods where this program is active, participation rates correlate with lower property crime in the immediate area. It's worth asking whether the specific neighborhood you're considering has an active association before you finalize a decision.
Time Your Site Visits
One thing long-term Everett residents will tell you: visit a neighborhood on a weekday evening, not just a sunny Saturday afternoon. The feel of Riverside or downtown-adjacent blocks at 7 p.m. on a Tuesday gives you a more accurate read than a weekend daytime walk. Stopping into an independent bar or restaurant on Hewitt Avenue draws a neighborhood crowd that tells you something about who actually uses a street regularly — that kind of ground-truth observation is harder to fake than any map overlay.
What Longtime Residents Know
The single most consistent piece of advice from people who've lived in Everett long enough to form an opinion: the city's reputation among people who don't live here is meaningfully worse than the reality in most of its residential neighborhoods. Silver Firs and Glacier View read very differently on the ground than a citywide crime rate would lead you to expect. The data supports that read — and so does spending an afternoon there.
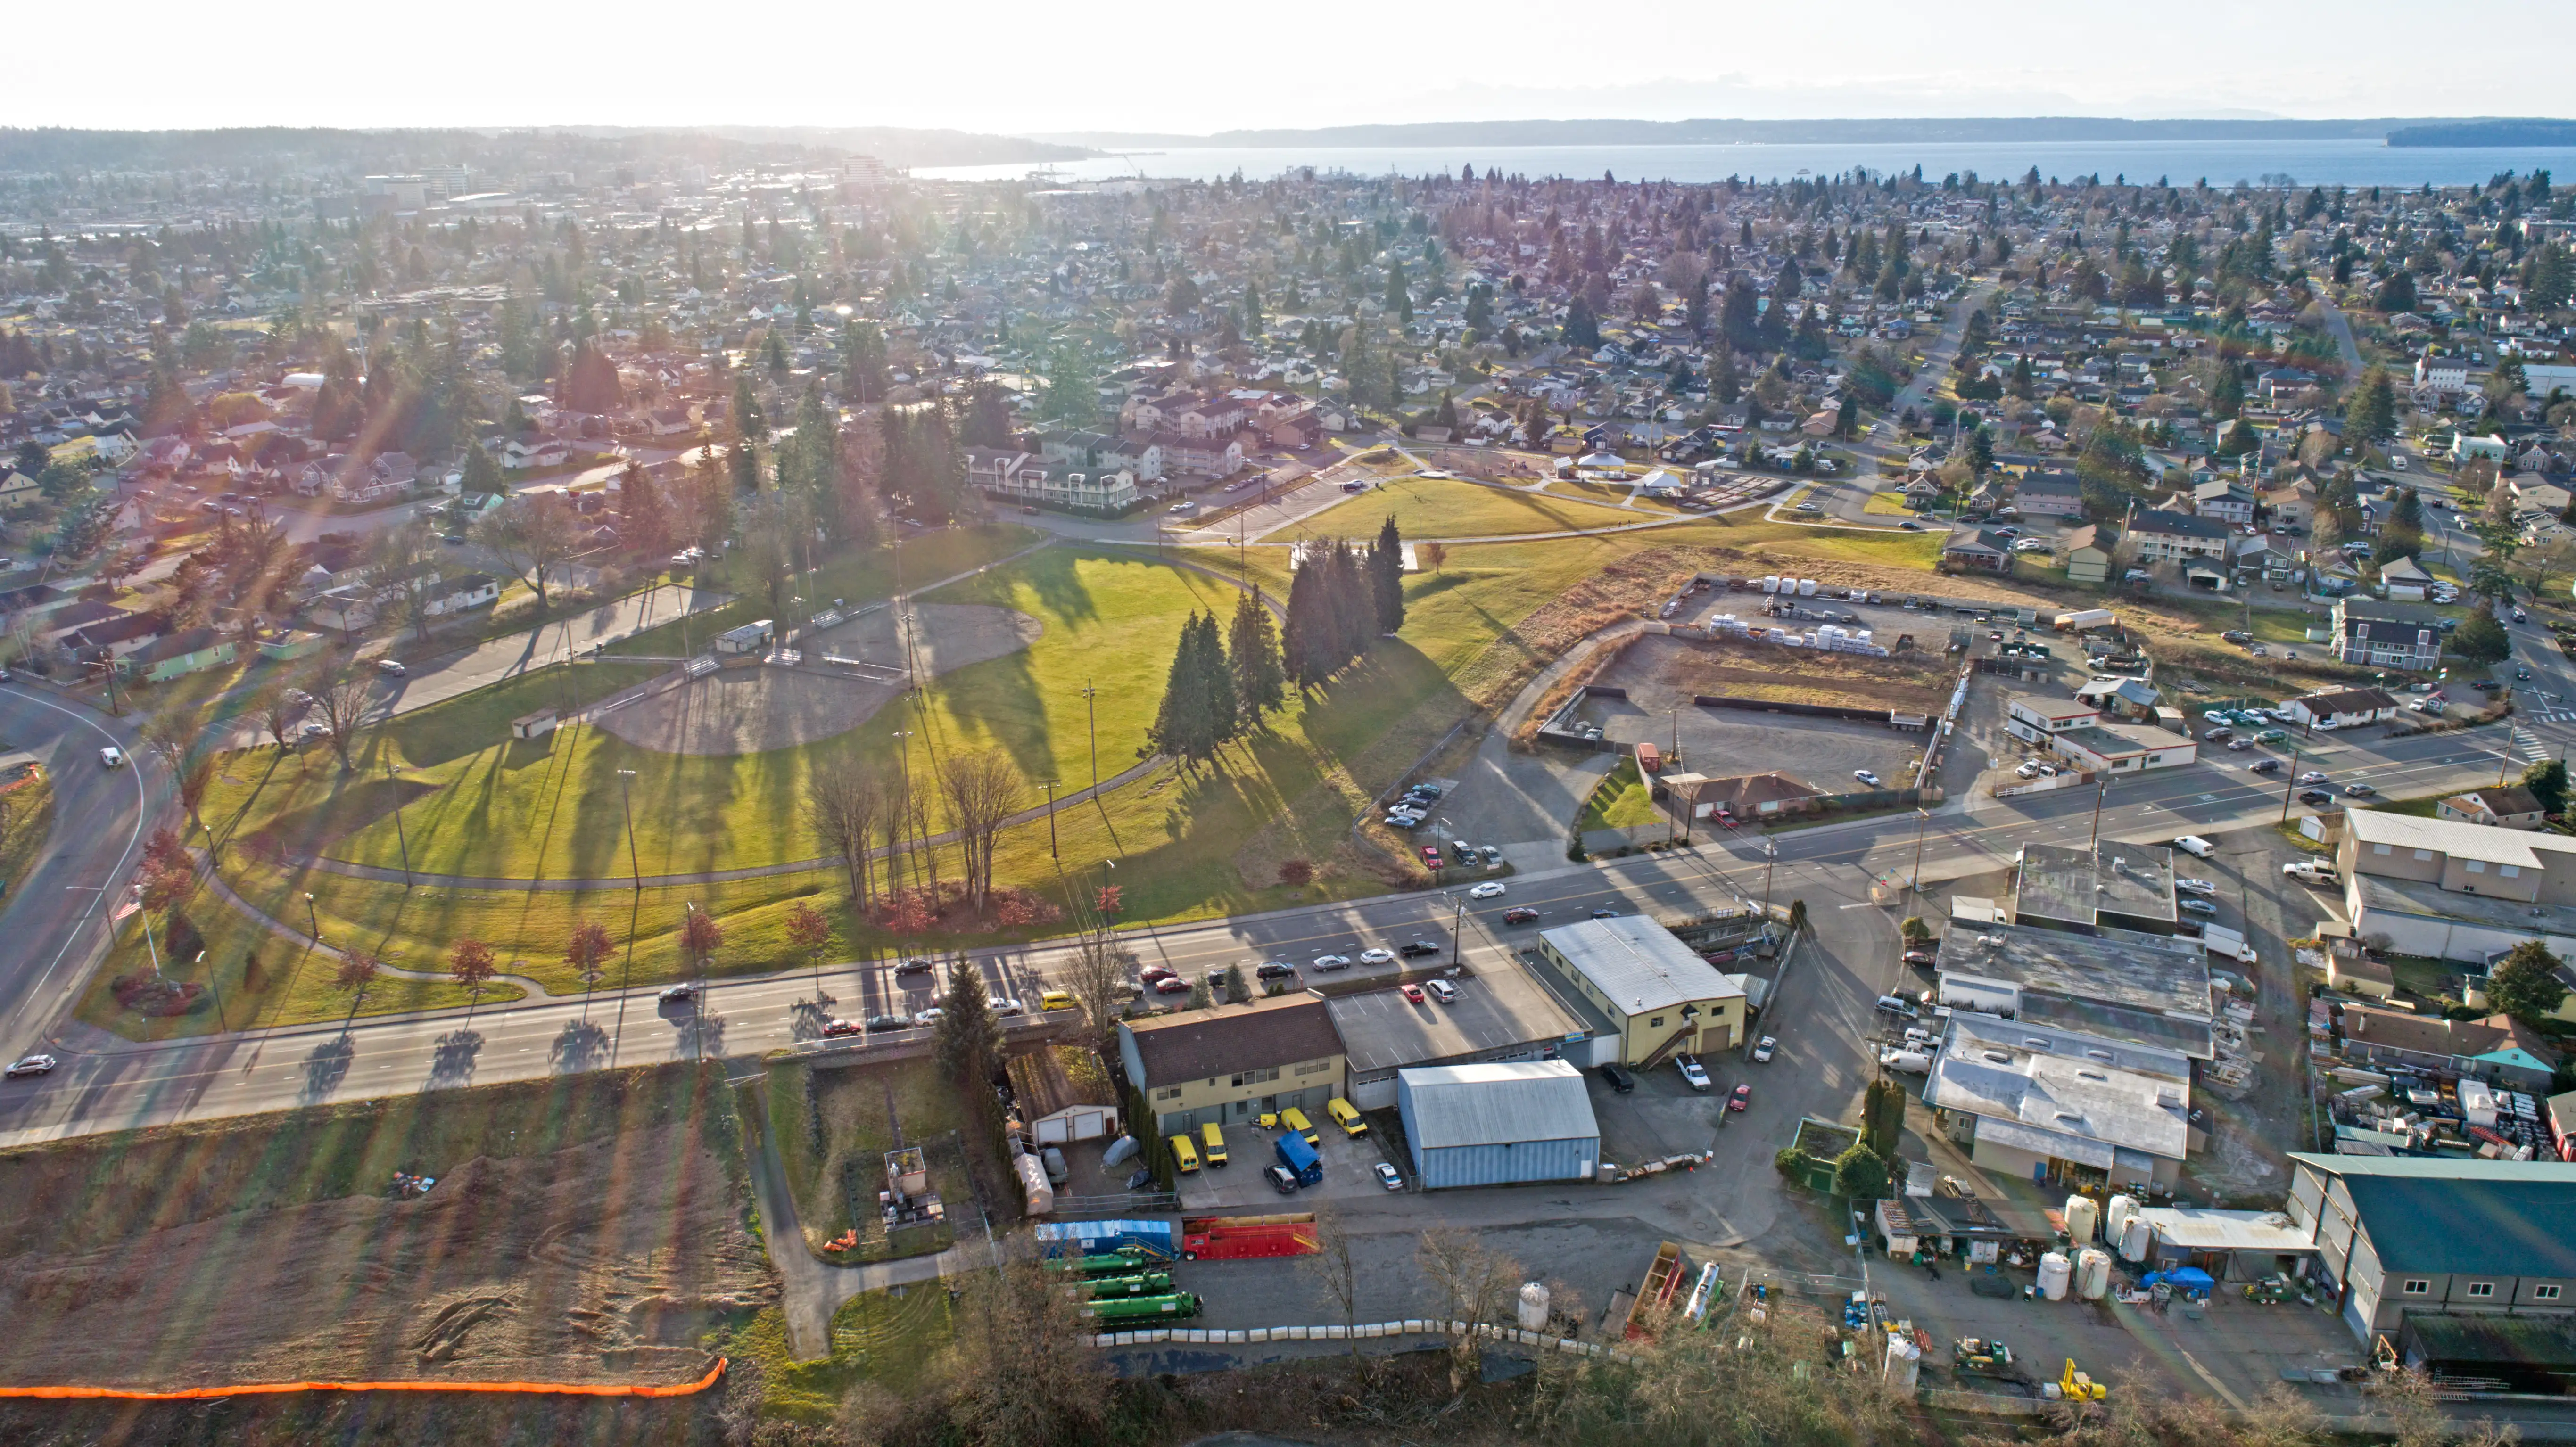
Local Expert Takeaway: Everett's violent crime sits below both the Washington state average and the U.S. national average — a fact that surprises most people who've heard the city described as rough. The real challenge is property crime, dominated by motor vehicle theft in a state that ranks 3rd worst nationally for that category. The southeast neighborhoods like Silver Firs and Glacier View feel and measure as meaningfully safer than the southwest corridor. Violent crime has declined five consecutive years, and the EPD's 71-camera Flock Safety license-plate-reader network plus 100 new officers over five years represent genuine operational investments. If you're evaluating a specific address, pull the block-level incident data — the citywide average will either undersell or oversell the safety picture depending on exactly where you're looking.
Quick Takeaways & FAQs
✅ Everett's violent crime rate of 2.65 per 1,000 residents is below both Washington state's average and the U.S. national rate, based on FBI UCR 2024 data.
⚠️ Property crime — driven mainly by motor vehicle theft — runs well above the national norm, and secured parking should be a real factor in your neighborhood evaluation.
📍 Crime in Everett is sharply geographic: the southeast (Silver Firs, Glacier View) runs far quieter than the southwest corridor, and the citywide average obscures that divide almost entirely.
Is Everett, WA a safe city to live in?
Which part of Everett has the most crime?
Is Everett's crime getting better or worse?
How does Everett's crime rate compare to nearby cities like Marysville or Lynnwood?
What's the biggest crime risk for someone moving to Everett?
Moving to Washington?
Tell us what you need help with and we'll connect you with local resources.
