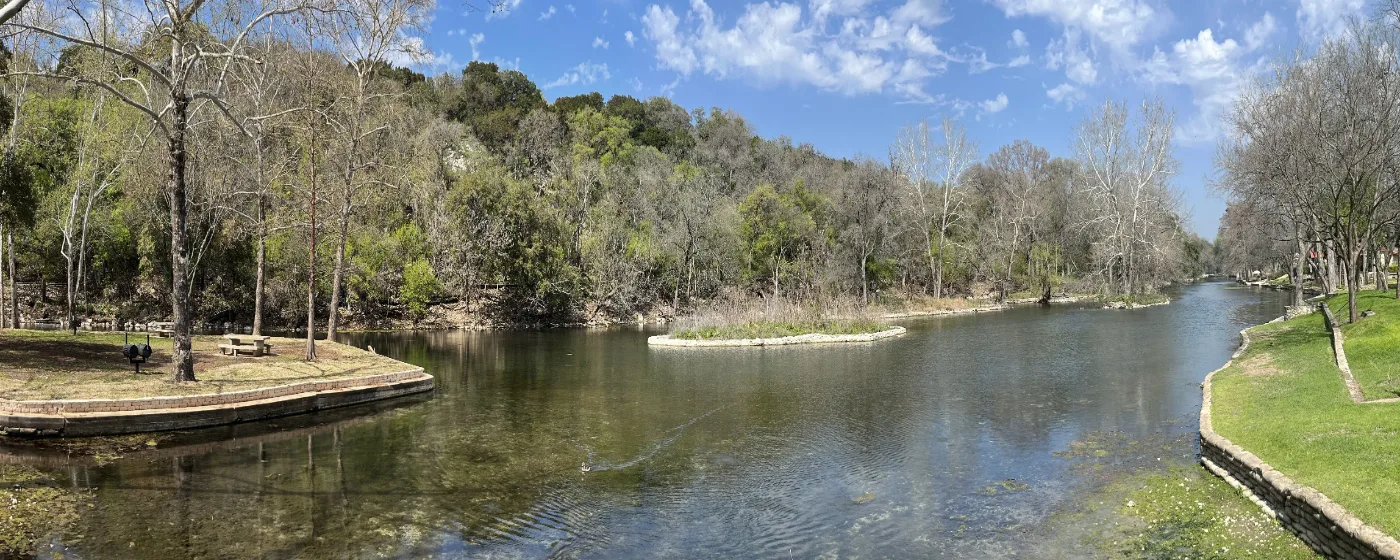
People moving to New Braunfels from the Houston suburbs or the Dallas–Fort Worth corridor often say the same thing after a few months: they stopped locking their car in the driveway. That's not a safety guarantee — it's a feeling, and feelings don't hold up on their own. What does hold up is the data. With a population of 122,492 and a city that has roughly tripled in size over two decades, New Braunfels sits at an interesting crossroads: a fast-growing Texas city that has somehow managed to keep crime trending downward even as the population climbs. I-35 threads through the eastern edge, carrying both commuters headed about 35 minutes to San Antonio and the summer tubing crowd arriving for the Comal and Guadalupe rivers. The city's character — part Hill Country escape, part San Antonio suburb, part tourism engine — shapes its safety picture in ways that raw numbers alone don't explain.
The short version: New Braunfels posts a violent crime rate of 2 per 1,000 residents and a property crime rate of 13 per 1,000 residents (Bureau of Justice Statistics, Crime Known to Law Enforcement, 2024). Both figures sit well below Texas and national benchmarks. The New Braunfels Police Department's 2025 Annual Report, presented to City Council in March 2026, documented a 5% overall crime decrease — 235 fewer reported incidents — and a 14% decline in total crime since 2022. That trend matters as much as any single-year snapshot, especially for a city adding residents at the pace New Braunfels is. Independent studies that weigh violent crime, property crime, traffic fatalities, and FEMA natural disaster risk together consistently place New Braunfels among the safer midsize cities in Texas — a picture the NBPD's own data supports.
None of that means every block is identical. New Braunfels is a tourism-driven city, and the areas that concentrate retail, restaurants, and river-access parking naturally see more reported incidents — not because they're dangerous to live near, but because more people move through them. The northwest quadrant of the city, anchored by master-planned communities like Vintage Oaks at the Vineyard and River Chase, consistently draws the most favorable safety perception from residents. The neighborhood guide goes deeper on each area's character; this page focuses on what the crime data actually shows and how to read it before you decide on a neighborhood.
The sections below walk through the city-wide numbers and how they compare to state and national figures, the neighborhood-level safety picture, what the tourism factor does to per-capita crime statistics, what the police department is doing on the ground, and the natural disaster risk piece that most safety conversations skip entirely.

New Braunfels Crime Rates vs. Texas and National Averages
New Braunfels carries a violent crime rate of 2 per 1,000 residents. Texas as a whole runs at a state violent crime rate of 4 per 1,000 residents, and the national violent crime rate sits at 3.7 per 1,000 residents (Bureau of Justice Statistics, Crime Known to Law Enforcement, 2024, tables 2 and 3). New Braunfels lands at roughly half the state rate and meaningfully below the national figure.
The property crime picture is just as favorable. New Braunfels posts a property crime rate of 13 per 1,000 residents, while the state property crime rate is 20.7 per 1,000 residents and the national property crime rate is 18.4 per 1,000 residents. That gap is substantial — a third below the national figure and nearly 40% below the Texas average.
This page shows a full comparison table from those figures directly below this section. What prose can add is context: these numbers come from the same reporting series, which matters more than it sounds. Different crime-rate aggregators you'll encounter while researching — neighborhood scoring sites, real estate portals — often pull from a different series that produces figures that can't be meaningfully compared to BJS data. The figures here are consistent and comparable across all three jurisdictions.
What's Actually Driving the Numbers
Larceny-theft is the most commonly reported crime type in New Braunfels, consistent with what FBI 2024 data shows for most Texas cities its size. Burglary and motor vehicle theft follow, though both declined sharply in 2025 — burglaries dropped 21% and vehicle thefts fell 18% according to the NBPD 2025 Annual Report. Robbery is a particular standout: it runs at approximately 0.1 times the national rate, making it one of the lowest robbery rates among cities in this population range.
The one category that moved in the wrong direction in 2025 was crimes against persons, which rose 7%, driven primarily by aggravated assaults and domestic violence incidents. That's worth watching. It's also worth noting that a 7% increase in a category that starts low in absolute terms looks different than the same percentage in a city starting from a higher base.
Neighborhood Safety: Where the Differences Show Up
New Braunfels is not uniformly safe or uniformly risky — it distributes like most fast-growing Texas cities, with the newer residential areas on the city's edges posting the most favorable numbers and the older, more commercial core showing higher per-capita figures.
The Northwest and Outer Ring
The northwest portion of the city consistently receives the most favorable safety assessments from residents and analysts alike. Communities in this part of town — including Vintage Oaks at the Vineyard and River Chase — are newer construction, lower-traffic, and largely residential in character. Havenwood at Hunters Crossing and Copper Ridge sit in a similar position: established enough to have community fabric but removed from the retail and tourist corridors where incidents concentrate. Veramendi, one of the city's larger master-planned developments, draws the same profile.
Voss Farms sits on the growing edge of the city, where development is still filling in around it. For families with school-age children evaluating the New Braunfels ISD, the northwest and outer residential areas check both the safety and the school-proximity boxes simultaneously.
The Central Core and Tourist Corridors
The Downtown/Landa Park area and Gruene Historic District are genuinely pleasant places to spend time. Gruene Hall draws regional visitors year-round, and the Gruene district has a walkable, historic quality that newer subdivisions can't replicate. But per-capita crime figures for these areas run higher than the city average — not because residents there are more at risk, but because incidents are counted against a residential population while occurring in spaces that serve thousands of daily visitors.
This is a recognized pattern in tourism-driven cities: commercial and tourist zones inflate per-capita crime statistics without necessarily making them unsafe to live near. A resident in the Downtown/Landa Park area is not experiencing crime at the rate the per-capita figure implies — the denominator (resident population) is small, and the numerator (reported incidents) includes a lot of tourist-area larceny that has nothing to do with neighborhood character. That said, if minimizing any exposure to higher-incident areas is a priority, the outer residential communities are the cleaner answer.
Best for families prioritizing safety perception: Families Quiet Vintage Oaks at the Vineyard, River Chase, Havenwood at Hunters Crossing, Veramendi — all in the northwest and outer ring. See the full neighborhood breakdown for character detail on each.

The Tourism Factor: Why Per-Capita Crime Numbers Can Mislead
| Measure | New Braunfels | Texas | National | vs. national |
|---|---|---|---|---|
| Violent crime (per 1,000) | 2 | 4 | 3.7 | 46% lower |
| Property crime (per 1,000) | 13 | 20.7 | 18.4 | 29% lower |
State and national figures — Bureau of Justice Statistics, Crime Known to Law Enforcement, 2024 (tables 2 and 3). City figures — NeighborhoodScout. City rates come from a different reporting series than the state and national benchmarks, so read the comparison as a direction, not a precise multiple.
New Braunfels draws millions of visitors each year to Schlitterbahn, the Comal River, Guadalupe River tubing, and the Gruene Historic District. That volume of foot traffic is the city's economic engine — and it's also the main reason any crime-rate comparison requires a closer read.
How Tourism Inflates the Numbers
Crime statistics are almost universally reported on a per-resident basis. In a city where the resident count is 122,492 but the summer weekend population in certain areas might be multiples of that, per-capita figures around those corridors become difficult to interpret. A fender-bender in a parking lot off the river access points, a wallet lifted at a busy waterpark, a DWI arrest on a Friday night — all reported incidents, none of them telling you much about whether the people who actually live nearby are unsafe.
The NBPD recognized this dynamic and responded with a dedicated DWI Unit launched in late 2024, which the city cited as having a significant impact on road safety within its first year. That's a direct response to tourist-season traffic patterns, not a symptom of a structural crime problem.
What This Means for Neighborhood Research
When you're reading crime maps or scoring tools for New Braunfels, apply extra skepticism to any area that overlaps with a major commercial or tourist corridor. The Downtown/Landa Park area, the Schlitterbahn vicinity, and the Gruene district will consistently score lower than the residential northwest on those tools — not because something is wrong with those neighborhoods, but because the tools divide incident counts by residents and don't account for floating population.
The practical takeaway: if a scoring site grades a neighborhood a C or D but the area is anchored by a major tourist attraction, you're likely reading tourist-area incident density, not residential risk. The NBPD's own data — a 14% drop in total crime since 2022 across the city as a whole — is the more useful frame.
Looking to buy in New Braunfels? Estimate your payment.
Enter your numbers to see an estimated monthly mortgage payment.
Estimate only. Excludes HOA fees and mortgage insurance. The interest rate above is a starting point, not a quoted rate — replace it with your own to see real numbers. Insurance is a flat placeholder, not a New Braunfels quote.
Police Department and Community Safety Programs
A low crime rate is easier to maintain when a police department is operationally healthy. The NBPD's 2025 Annual Report included a patrol staffing study confirming that response times for both Priority 1 emergency calls and non-emergency calls are strong — a notable finding at a time when many similarly sized departments nationally are contending with staffing shortages and slower response.
Community Engagement
The department runs a Citizens Police Academy — an 11-week course open to residents who want a ground-level look at how the department operates. Coffee with a Cop sessions take place at rotating locations around the city. The Kops & Kids Safety Picnic at Landa Park has become a genuine community gathering, not just a PR exercise. Complimentary self-defense courses are offered to residents through community outreach programming.
National Night Out participation grew substantially in 2025, earning New Braunfels recognition among similarly sized communities nationally. The department also launched Faith & Blue events that year and supported Blue Santa, a holiday program serving children and families across Comal County. These aren't vanity metrics — they reflect a department that has made resident relationships a measurable priority alongside enforcement.
What This Looks Like Day to Day
One thing longtime residents mention — and newcomers don't expect — is how visible the community policing programs are. The Citizens Police Academy has a waitlist. Coffee with a Cop sessions fill tables. That engagement doesn't appear in a crime rate figure, but it's part of why the trend line has moved in the right direction since 2022.
New residents sometimes worry most about summer weekends, when the river corridors are at capacity and the city feels like a different place. The DWI Unit's focus on exactly those patterns addresses the most realistic seasonal risk. The underlying residential neighborhoods remain stable through the tourist season in a way that a property-crime rate alone doesn't fully convey.
Natural Disaster Risk and Flood Awareness in New Braunfels
Most safety conversations for New Braunfels start and end with crime statistics. A fuller picture adds a dimension that matters just as much for long-term residents: natural disaster risk. New Braunfels carries a relatively moderate natural disaster risk profile based on Comal County's FEMA National Risk Index score — not the lowest tier, but not the elevated designation that parts of coastal Texas carry.
Flash Flooding Is the Primary Risk
The Comal and Guadalupe rivers are what makes New Braunfels what it is — and they are the primary natural hazard. The Texas Hill Country is flash-flood country. Rainfall that falls miles upstream arrives fast and with little warning, and both rivers have a documented history of rising rapidly during severe storms. This is not a theoretical risk; it's a regional reality that shapes how homes near the waterways are insured and, in some cases, built.
Before settling on any property near the rivers, checking the relevant FEMA flood zone designation is a necessary step — not because flooding is certain, but because it directly affects what insurance is required and what costs are unavoidable. Properties in designated flood zones carry insurance requirements that don't apply to higher-ground neighborhoods. The outer residential communities — Vintage Oaks at the Vineyard, Copper Ridge, Voss Farms, Veramendi — sit on elevated terrain away from the river corridors and carry a different flood risk profile than properties closer to the water.
What Newcomers Don't Expect
People who move to New Braunfels from drier climates are sometimes caught off guard by how quickly storm conditions escalate in Comal County. The same river that makes a summer afternoon at Cypress Bend Park memorable can look completely different forty-eight hours after heavy Hill Country rainfall. Local emergency management issues flood watches and warnings that are worth taking seriously, and established residents follow river gauges during storm systems as a matter of routine. It's a genuine seasonal quirk — not a reason to avoid the city, but a practical reality that doesn't appear in any crime rate table and is worth understanding before you decide on a neighborhood's location relative to the water.
For the full picture on what living here looks like day to day — commute patterns, employer base, and who tends to thrive in New Braunfels — the living in New Braunfels guide covers that ground.
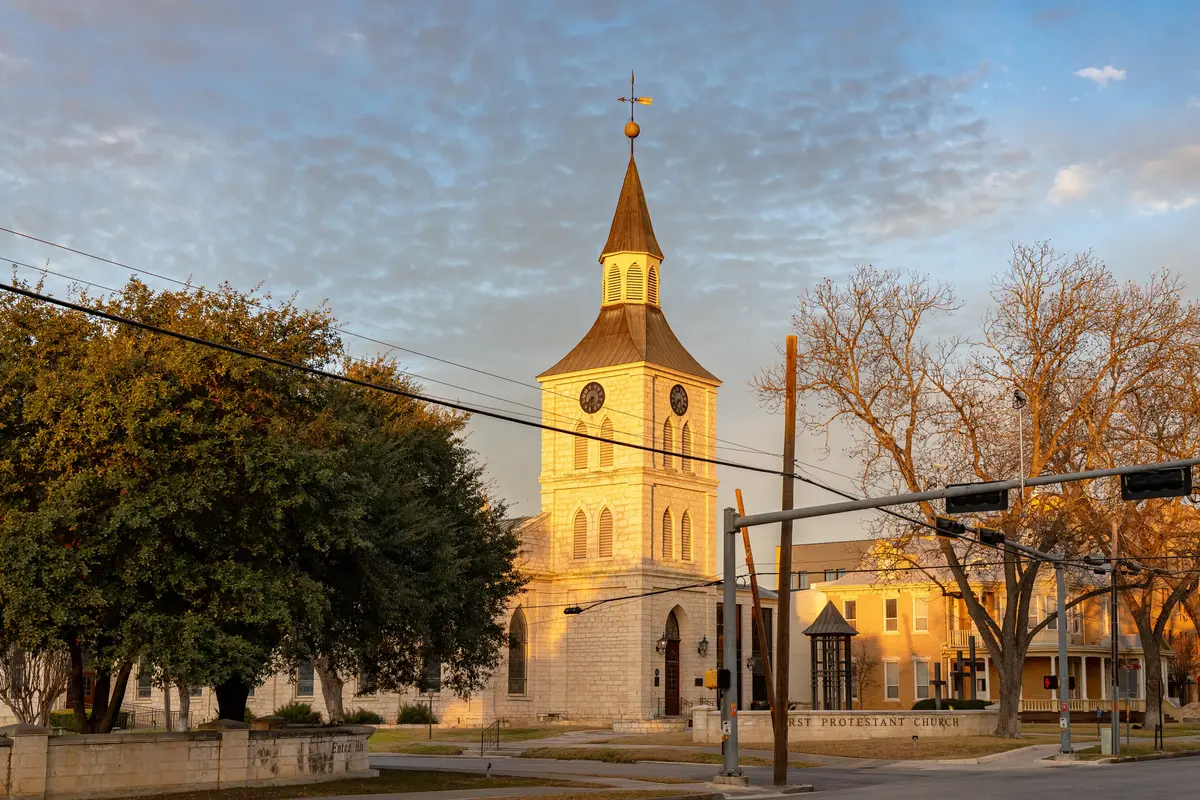
Local Expert Takeaway: New Braunfels is, by the numbers, one of the safer midsize cities in Texas — and the trend has moved in the right direction since 2022, with total crime down 14% over three years even as the city has grown. The meaningful nuance is geographic: the northwest residential areas like Vintage Oaks at the Vineyard and River Chase post the most favorable picture, while the downtown core and Gruene corridor show higher per-capita figures that largely reflect tourist-area incident density rather than residential risk. The one genuine hazard that no crime statistic captures is flash flooding along the Comal and Guadalupe — check the flood zone designation for any property near either river before you commit to a neighborhood location. The NBPD's community engagement programs, strong response times, and a dedicated DWI Unit suggest a department that is operationally healthy, which matters as much for long-term safety as any single-year crime rate.
Quick Takeaways & FAQs
✅ New Braunfels posts a violent crime rate of 2 per 1,000 residents — roughly half the Texas state average and well below the national figure.
⚠️ Per-capita crime numbers in the downtown core and Gruene corridor are inflated by tourist foot traffic, not residential risk — context matters when reading neighborhood scoring tools.
📍 Flash flooding along the Comal and Guadalupe rivers is the most underappreciated safety consideration in New Braunfels; always check the FEMA flood zone designation before choosing a neighborhood near the water.
Is New Braunfels safe to live in?
Which part of New Braunfels has the lowest crime?
Why do some crime maps show New Braunfels looking worse than I expected?
What is the most common type of crime in New Braunfels?
Is flooding a safety concern in New Braunfels?
Moving to Texas?
Tell us what you need help with and we'll connect you with local resources.
