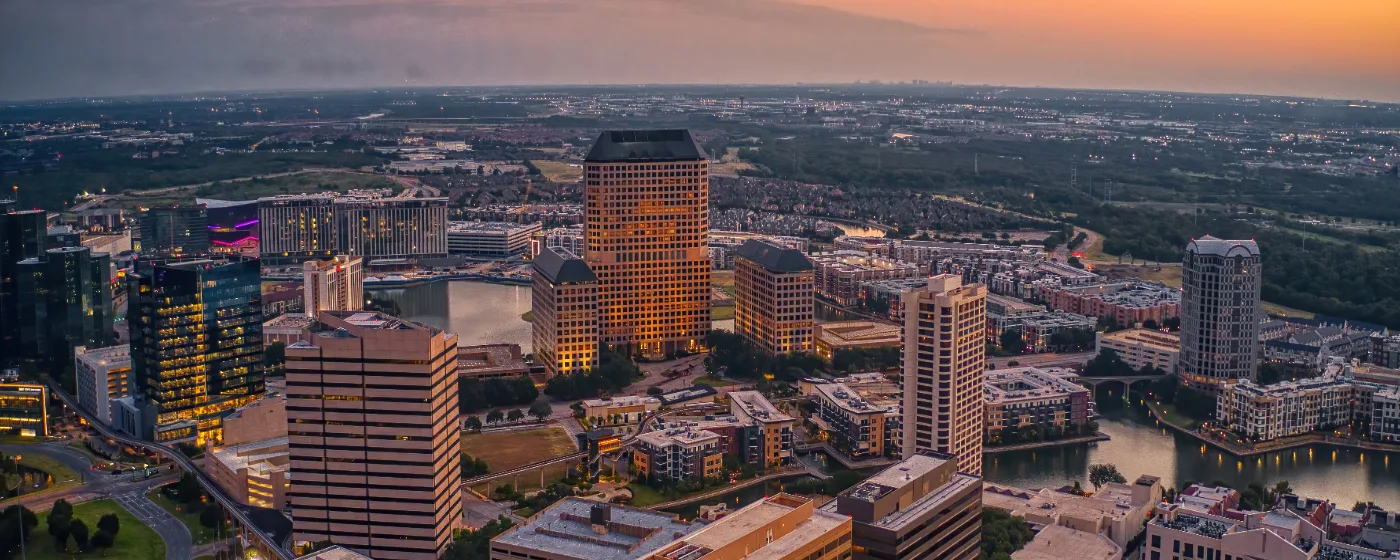
Irving's reputation for safety gets scrambled by its geography. With 257,076 residents spread across a city that runs from glassy corporate corridors in Las Colinas to working-class blocks along the southern and western edges, asking "is Irving safe?" is a little like asking whether Dallas/Fort Worth traffic is bad — the answer depends entirely on where you're standing. The city sits between two interstates and carries the kind of mixed-use density that makes raw crime totals look alarming until you start reading them by neighborhood.
The headline figures actually land better than many newcomers expect. Irving carries a violent crime rate of 3.4 per 1,000 residents — below both the Texas state rate of 4 per 1,000 and the national rate of 3.7 per 1,000 (Bureau of Justice Statistics, Crime Known to Law Enforcement, 2024). Property crime tells a more complicated story, with a property crime rate of 22 per 1,000 residents, which is modestly above the Texas state figure of 20.7 per 1,000 and noticeably above the national figure of 18.4 per 1,000. Larceny-theft drives most of that number, and vehicle theft is a real and specific concern this guide addresses directly.
What the top-line figures don't capture is the city's internal divide. The northeast corridor — Valley Ranch, Hackberry Creek, and the Las Colinas employment district — carries a crime profile that compares favorably with many of the quieter north-suburb cities in the Dallas-Fort Worth Metroplex. The southern and western portions of the city run measurably higher. Choosing a neighborhood here without understanding that divide is the most common mistake people make when they relocate to Irving.
This guide breaks down Irving's crime rates in context, maps the safety picture neighborhood by neighborhood, explains what's behind the property crime numbers, and gives you concrete steps for researching any specific block before you decide on an area.

How Irving's Crime Rates Compare to Texas and the Nation
Irving carries a violent crime rate of 3.4 per 1,000 residents, landing below the Texas average of 4 per 1,000 and below the national average of 3.7 per 1,000 — both figures from Bureau of Justice Statistics, Crime Known to Law Enforcement, 2024. For a city of 257,076 people sitting at the edge of one of the country's largest metropolitan areas, that's a meaningful result.
Property crime is the real caveat. Irving carries a property crime rate of 22 per 1,000 residents, running above the state figure of 20.7 per 1,000 and noticeably above the national figure of 18.4 per 1,000. Understanding what's behind that number matters more than the number itself.
What Drives the Property Crime Figure
Larceny-theft is the most commonly reported crime in Irving by a wide margin, followed by aggravated assault and burglary. Vehicle theft runs above the national norm and is worth treating as a concrete, practical concern rather than a statistical footnote — Irving sees a disproportionately high rate of auto theft relative to comparably sized cities nationally.
Part of the property crime elevation is structural. Irving is home to Toyota Music Factory, the Irving Convention Center, major corporate campuses, and dense retail corridors along SH-183 and I-635. Crime heat maps consistently read higher in high-traffic commercial zones because incidents follow crowds, not necessarily residents. A theft in a shopping center parking lot reads the same in the data as one on a residential street, even though the risk profile for a homeowner is entirely different.
Compared with other U.S. cities of similar population size, Irving's overall crime rate is noticeably lower than the national average for its size class, according to NeighborhoodScout's analysis of FBI 2024 data. That context gets lost when people compare Irving against smaller, quieter suburbs rather than against cities in its actual population tier.
The Neighborhood Safety Map: Where Irving Divides
Irving does not have a uniform safety profile. The clearest pattern in the data: crime concentrations are highest in the southern and western portions of the city, while the northeast corridor runs consistently lower. That geographic divide shapes where families with school-age children and remote workers tend to land.
The Safer Northeast Corridor
Valley Ranch, in Irving's northeast corner, consistently appears among the city's lower-crime areas. The neighborhood's suburban layout — winding streets, cul-de-sacs, established HOAs — creates natural friction for opportunistic crime. It carries a crime profile that compares favorably with many of the north-suburb cities in the Metroplex. For a detailed look at what Valley Ranch offers beyond safety, see the Irving neighborhoods guide.
Hackberry Creek sits between Valley Ranch and Las Colinas and operates as a gated community. It's consistently described as one of the safest neighborhoods in Irving for families — the gate matters less as a physical barrier than as a signal about the community's maintenance and cohesion. The tradeoff is that entry-level access is limited, and the price point runs above the city median.
Las Colinas, Irving's corporate and entertainment center, is more complex. The daytime and weekend population swells with office workers and Toyota Music Factory visitors, and the commercial corridors around Lake Carolyn read higher on crime maps than the residential pockets within the same ZIP code. If you're weighing Las Colinas as a place to live rather than work, the residential sections closer to the water and away from the main retail strips tend to have a quieter profile than the raw numbers suggest.
The Hospital District and Heritage Area
The Hospital District and Heritage District occupy Irving's older central core. Crime here runs at an intermediate level — not the city's highest, but not the profile of Valley Ranch either. These neighborhoods attract buyers who want Irving's urban character and proximity to employment without the price premium of Las Colinas; the safety picture is part of what keeps that price accessible.
Southern and Western Irving
University Hills, Northgate Heights, and Bear Creek, along with other areas in the city's southern and western portions, carry higher crime concentrations than the northeast. That doesn't mean these neighborhoods are dangerous in an absolute sense — it means the risk is measurably elevated compared with the rest of the city. Bear Creek's price point sits at the city median, and that relative affordability reflects both the housing stock and the safety profile. Anyone choosing a home in these areas should spend meaningful time with the Irving Police Department's real-time crime map before deciding on a specific block.
| Neighborhood | Safety Profile | Key Context | Best For |
|---|---|---|---|
| Valley Ranch | Lower crime, consistently | Northeast corridor; suburban layout | Families Quiet |
| Hackberry Creek | Among city's lowest | Gated community between Valley Ranch and Las Colinas | Families Privacy |
| Las Colinas | Mixed — residential pockets lower, commercial corridors higher | High foot traffic inflates map readings | Commuters Walkable |
| Hospital District | Intermediate | Older core; urban character | First-Time Value |
| Heritage District | Intermediate | Central Irving; mixed residential | First-Time |
| Bear Creek | Higher than city average | Southwest; price at city median | Value |
| University Hills | Higher than city average | Southern portion; research specific blocks | Renters |
| Northgate Heights | Higher than city average | Western edge; variable block to block | Renters |
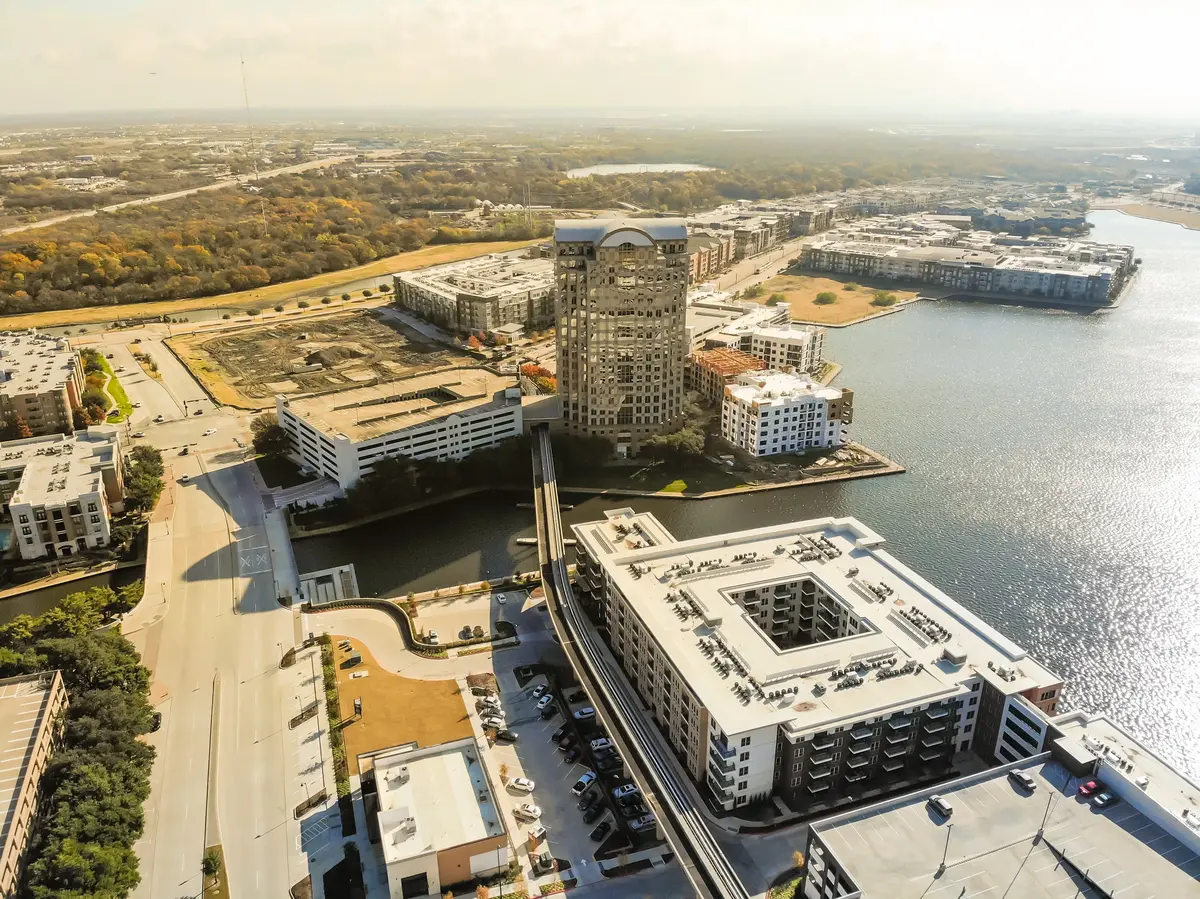
Vehicle Theft: The Specific Risk to Know Before You Move
Vehicle theft is the one category where Irving's numbers stand out in a way that deserves direct attention. The city's auto theft rate runs above the national norm by a meaningful margin — enough that it shows up in multiple independent analyses of FBI 2024 data. This is not a diffuse property crime concern spread evenly across the city; it's a specific, concentrated risk.
What This Means Practically
Older model Hyundais and Kias have been disproportionately targeted in the Dallas-Fort Worth area, consistent with a national pattern. If you're moving to Irving with a vehicle in that category, a steering wheel club and a garage or well-lit off-street parking situation are worth prioritizing when you're evaluating a home or apartment.
The Irving Police Department has a real-time crime mapping tool through the city's website — using LexisNexis Community Crime Map — that lets you filter incident types by location and date range. Pulling up vehicle theft incidents in the specific blocks you're considering gives you a far more accurate picture than any neighborhood-level generalization. The IPD also operates a Neighborhood Watch program and community engagement initiatives including Shop Talk (officer conversations in barbershop settings) and Unidos, which focuses on Hispanic community outreach — both of which carry practical information about local crime patterns.
The practical mitigation is straightforward: covered or secured parking, steering-wheel deterrents for high-risk vehicles, and choosing a home where overnight parking is off the street rather than on it. Valley Ranch and Hackberry Creek — both of which tend to have garages and more structured residential layouts — present a meaningfully lower vehicle theft risk than open surface lots in the commercial corridors.
Looking to buy in Irving? Estimate your payment.
Enter your numbers to see an estimated monthly mortgage payment.
Estimate only. Excludes HOA fees and mortgage insurance. The interest rate above is a starting point, not a quoted rate — replace it with your own to see real numbers. Insurance is a flat placeholder, not a Irving quote.
How to Research Safety for a Specific Block in Irving
The biggest mistake people make when evaluating Irving's safety is treating neighborhood generalizations as block-level truth. Valley Ranch is safer on average, but that average contains variation. Northgate Heights runs higher, but that average also contains quieter pockets. The city is too large and too internally diverse for any generalization to substitute for block-specific research.
The Tools That Actually Help
The Irving Police Department's real-time crime map is the most granular tool available. Accessible through irvingtx.gov, it lets you filter by crime category — vehicle theft, burglary, aggravated assault — and set a date range for any address you're evaluating. Spending twenty minutes with that map before settling on a neighborhood tells you more than any ranking service.
Crime heat maps from services like CrimeGrade and AreaVibes are useful for orientation but have a consistent flaw in a city like Irving: commercial and retail corridors read dramatically higher than residential streets even when the residential risk is modest. The area around Toyota Music Factory and the Irving Convention Center, for example, generates incident reports at a volume that overwhelms the nearby residential profile. When you're using a heat map, zoom in far enough that you're looking at the residential blocks specifically, not the commercial buffer around them.
What Longtime Residents Notice After Six Months
People who move to Irving from quieter suburbs often say the same thing after half a year: the city feels significantly safer day-to-day than the crime statistics initially suggested, because those statistics are heavily influenced by the commercial and transit corridors they rarely visit as residents. The flip side is that vehicle security requires more active attention than it would in a lower-theft city — that's a real adjustment, and one that catches newcomers off guard if they leave a car unlocked in a surface lot out of habit.
The Irving Police Department maintains a visible patrol presence across the city's neighborhoods and runs community engagement programs — Neighborhood Watch, Unidos, Shop Talk — that give residents practical channels for staying current on local patterns beyond what the crime map shows. National Night Out events in Irving consistently draw participation from across the city's neighborhoods, including areas that tend to be underrepresented in civic engagement.
The Honest Summary: Who Irving Works for Safety-Wise
Irving is not a city where safety is a binary yes or no. It's a city where safety is a function of which part of it you choose — and that distinction matters more here than in a smaller, more homogeneous suburb like Coppell or Grapevine to the north.
Families with school-age children who want the lowest practical risk should focus on Valley Ranch and Hackberry Creek. Both carry crime profiles that hold up well against north-suburban alternatives, and both offer the residential infrastructure — garages, HOAs, cul-de-sac layouts — that makes day-to-day living feel settled. The price point in those neighborhoods runs above the city median; that premium is partly a safety premium, and it's a real one.
Buyers drawn to Las Colinas for its walkable access to Lake Carolyn, the Irving Arts Center, and the employment corridor should look at the residential pockets specifically rather than reading the neighborhood's commercial crime numbers as representative of its residential streets. The gap between those two profiles is larger in Las Colinas than almost anywhere else in Irving.
The Hospital District and Heritage District offer a middle path: lower price point than the northeast, more urban character, and an intermediate crime profile that many buyers find acceptable once they research specific blocks. For a complete picture of what each neighborhood costs and who it suits beyond safety, the Irving neighborhoods guide covers those details in full.
The one category that applies city-wide regardless of neighborhood: vehicle theft. Treat it as a practical logistics issue — parking, deterrents, vehicle model — rather than a reason to avoid Irving. Every part of the city carries elevated auto theft risk relative to the national norm, and proactive habits close most of that gap.
The broader context for people coming from higher-cost metros: Irving carries a violent crime rate of 3.4 per 1,000 residents, sitting below both the Texas and national averages, and its property crime figure, while above average, is driven by categories that careful habits can substantially mitigate. For anyone weighing Irving against Dallas proper — roughly a similar or modestly lower home price market — Irving's safety numbers are, on balance, a point in its favor rather than a concern.
Local Expert Takeaway: Irving's safety picture is genuinely split by geography, and the split runs northeast-to-southwest in a way that's consistent across every data source. Valley Ranch and Hackberry Creek are where families land when safety is the top priority — those neighborhoods compare favorably with north-suburb alternatives at a lower price than Coppell or Grapevine. The one city-wide issue to address regardless of neighborhood: vehicle theft runs above the national norm, and anyone moving here should treat garage parking and a steering-wheel deterrent as standard equipment rather than optional. The Irving PD's real-time crime map at irvingtx.gov is the single most useful research tool available — pull it up for any specific address before you decide on an area.
Quick Takeaways & FAQs
✅ Irving carries a violent crime rate of 3.4 per 1,000 residents, sitting below both the Texas average of 4 per 1,000 and the national average of 3.7 per 1,000 — a meaningful edge for a city of 257,076 in the heart of the DFW Metroplex.
⚠️ Vehicle theft runs above the national norm city-wide, and property crime overall is modestly elevated compared with state and national averages — auto security habits matter more here than in most comparable suburbs.
📍 The northeast corridor (Valley Ranch, Hackberry Creek) and the residential pockets of Las Colinas carry crime profiles that compare favorably with much quieter north-suburb cities; the southern and western portions of Irving run noticeably higher — neighborhood choice matters enormously here.
Is Irving, Texas a safe place to live?
Which neighborhoods in Irving have the lowest crime rates?
Is vehicle theft a serious problem in Irving?
How do I research crime for a specific street or block in Irving?
How does Irving's crime rate compare to nearby cities like Dallas, Coppell, and Grapevine?
Moving to Texas?
Tell us what you need help with and we'll connect you with local resources.
