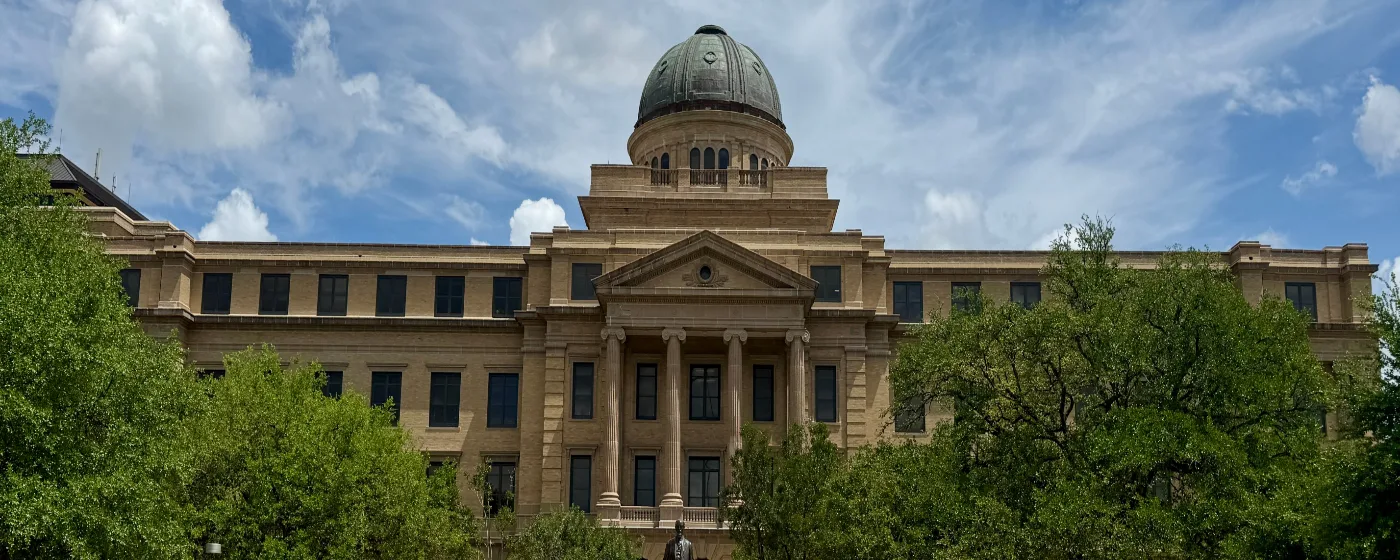
Most people researching College Station come in through Texas A&M — the university dominates the city's identity, its economy, and its daily rhythm in ways that shape everything, including how crime plays out here. A city of 127,472 that swells with students every fall is a different kind of place than a comparably sized Texas suburb. The honest question isn't whether College Station has crime — every city of this size does — but whether the type and distribution of that crime matches where you're planning to live.
The short answer: College Station compares well. The city registers a violent crime rate of 2 per 1,000 residents and a property crime rate of 15 per 1,000 residents. Both figures sit below the Texas state averages and below national figures — a picture that holds up across multiple reporting periods and is consistent with the direction the College Station Police Department's own data has been moving. The more nuanced answer is that the city's crime is heavily concentrated in specific zones, and most residential neighborhoods — especially those south and east of campus — look very different from the areas that drive the aggregate numbers up.
What surprises most people after six months here is how safe the residential side of the city feels day-to-day. The areas that show elevated incident counts on crime maps are almost entirely commercial and entertainment corridors, not the neighborhoods where families buy homes. Understanding that geography is the most useful thing this guide can give you. Whether you're weighing Southwood Valley against Pebble Creek, or trying to make sense of a crime map that lights up near campus, the sections below break down College Station's safety picture by the numbers, by neighborhood, and by what the data actually means for someone choosing where to live.
College Station Crime Rates: The Numbers in Context
| Measure | College Station | Texas | National | vs. national |
|---|---|---|---|---|
| Violent crime (per 1,000) | 2 | 4 | 3.7 | 46% lower |
| Property crime (per 1,000) | 15 | 20.7 | 18.4 | 18% lower |
State and national figures — Bureau of Justice Statistics, Crime Known to Law Enforcement, 2024 (tables 2 and 3). City figures — NeighborhoodScout (FBI crime data analysis). City rates come from a different reporting series than the state and national benchmarks, so read the comparison as a direction, not a precise multiple.
College Station carries a violent crime rate of 2 per 1,000 residents — meaningfully below the Texas state average of 4 per 1,000 and below the national figure of 3.7 per 1,000. On the property crime side, the city records a property crime rate of 15 per 1,000 residents, again below the state average of 20.7 per 1,000 and below the national average of 18.4 per 1,000.
Those figures already tell a reassuring story. What makes them more credible is the direction of travel. The College Station Police Department's 2025 annual report, presented to City Council in February 2026, documented a substantial reduction in crime across nearly all categories in 2025. Early data from the first quarter of 2025 showed both the College Station and Bryan police departments reporting decreases in violent crimes compared with the same period in 2024, a pattern that mirrors broader downward trends tracked by federal law enforcement reporting programs.
The regional picture points the same way. Texas Department of Public Safety data for the area around College Station recorded an overall decline in reported incidents in recent reporting periods. None of this means the city is crime-free — but it does mean the trend lines point in the right direction, and the baseline is already well below state and national norms.
What the Numbers Don't Tell You
Aggregate crime rates smooth over a geographic reality that matters a lot when you're choosing a neighborhood. In 2024, the College Station Police Department handled 89,142 calls for service. Burglary of a vehicle was the single most common offense category that year, with 379 calls — and Police Chief Billy Couch pointed out that many of those incidents involved residents simply leaving car doors unlocked.
That detail matters: the dominant crime type in College Station is largely preventable, and it clusters in specific areas. Property crimes, particularly theft and burglary, concentrate in university-adjacent and commercial zones, while violent crime remains comparatively rare across the city as a whole. The practical implication is that your personal risk profile in a residential neighborhood south or east of campus looks very different from what the city-wide rate implies.
Where Crime Concentrates: Understanding the Map
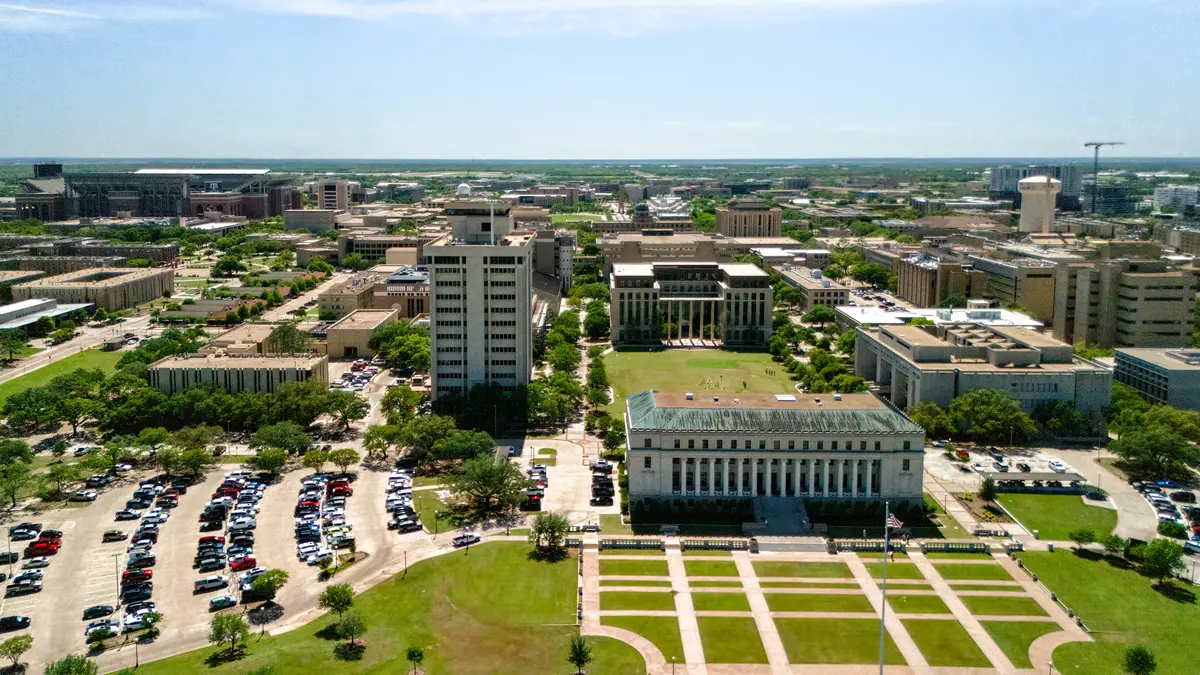
Crime-mapping analysis finds a clear geographic split: the northwest parts of College Station, which hold the highest density of retail establishments and the Northgate entertainment district, record the highest total incident volume. The southeast reports the lowest victimization rates in the city.
This pattern is worth understanding before you write off a neighborhood based on a colored heat map. Crime statistics are measured per resident, but crime itself follows people — and commercial corridors and entertainment zones draw thousands of visitors who aren't counted in the denominator. A block that reads red on a crime map because it sits next to a strip of bars is a very different situation than a residential street with genuinely elevated risk.
Northgate: High Volume, Specific Context
The Northgate entertainment district, directly adjacent to the Texas A&M campus, sees the highest incident volume in the city. The concentration of bars, late-night foot traffic, and student density drives that number. The incidents there are largely nightlife-related rather than the kind of violent crime that concerns families choosing a neighborhood. If your household isn't centered on Northgate, the activity there has little bearing on your day-to-day safety picture.
The Northwest-Southeast Gradient
The practical takeaway from the geographic data: neighborhoods in the southeast quadrant of College Station consistently record the lowest victimization rates. The northwest, anchored by retail and entertainment, records the highest raw incident counts. Buyers who understand this gradient can read a crime map accurately instead of reacting to aggregate color-coding that mixes commercial and residential risk.
For a closer look at which specific neighborhoods fall in which part of that gradient — and how the residential fabric differs across the city — the neighborhoods guide goes deeper on character and geography.
Neighborhood-by-Neighborhood Safety Picture
College Station's residential neighborhoods vary considerably in feel and safety profile. The data points consistently in one direction: the established, owner-occupied communities away from the university entertainment corridor tend to be the quietest.
Southwood Valley
Southwood Valley earns consistent recognition as one of College Station's safer residential areas. The neighborhood has organized watch programs, well-lit streets, and steady policing. Its distance from the Northgate zone keeps incident levels low, and the community presence here is real — residents who've lived here long enough to know their neighbors notice when something is off.
Best for: Families Quiet
Pebble Creek
Pebble Creek is recognized for a peaceful environment, high owner-occupancy rates, and lower crime. High owner-occupancy is a meaningful signal in a college town: it means less rental turnover, more stake in the neighborhood's condition, and more stable community fabric. The area sits comfortably away from the student-heavy corridors.
Best for: Families Value of stability
Castlegate and Castlegate II
Castlegate and its newer sister section are described consistently as calm, organized, and suburban. The housing stock here is newer, the streets are well-maintained, and the community has the feel of a planned residential development that has matured well. Incident levels reflect the quiet, owner-occupied character of the area.
Best for: Families Quiet
The Village of Indian Lakes
The Village of Indian Lakes is a gated community with large lots and a tranquil atmosphere. The gated access adds a layer of physical separation from through traffic that most College Station neighborhoods don't have. It suits buyers who prioritize privacy alongside safety.
Best for: Privacy Upscale
Southside Historic District
The Southside Historic District sits closest to campus of any established residential neighborhood and carries a different character as a result. The housing stock is older, the mix of owner-occupants and renters is more balanced, and its proximity to university life is both an appeal and a trade-off. Its safety profile is shaped by its location more than its housing type, and the neighborhoods guide goes deeper on what that location means for buyers.
Best for: Walkable Campus access
Edelweiss and Edelweiss Gartens
Edelweiss and its companion section offer a quieter, more suburban feel on the west side of the city. The neighborhood sits away from the major commercial corridors and sees little of the incident volume that characterizes the northwest zone. It's a solid choice for buyers who want to be in College Station proper without living near the entertainment density.
Best for: Families Quiet
Emerald Forest and Williams Creek
Both neighborhoods have a residential, settled character. Emerald Forest has mature trees and an established community feel; Williams Creek runs similarly quiet. Neither is far enough south to reach the lowest-crime southeast tier, but both sit well away from the commercial and nightlife zones that dominate the incident maps.
Best for: Families Nature feel
Looking to buy in College Station? Estimate your payment.
Enter your numbers to see an estimated monthly mortgage payment.
Estimate only. Excludes HOA fees and mortgage insurance. The interest rate above is a starting point, not a quoted rate — replace it with your own to see real numbers. Insurance is a flat placeholder, not a College Station quote.
Two Safety Layers: CSPD and Texas A&M UPD
College Station benefits from something most cities its size don't have: two active police departments covering overlapping geography. The College Station Police Department handles the city at large, while the Texas A&M University Police Department operates 24/7 across campus with resources that spill over into the surrounding streets.
Texas A&M's Campus Safety Infrastructure
The Texas A&M University Police Department maintains over 100 blue-light emergency phones across campus, a Code Maroon emergency notification app available on both iOS and Android, and a Corps of Cadets escort program available on weekday evenings and all weekend. For residents who live near campus or whose households include students, this parallel safety layer is a genuine and meaningful addition to the city's coverage.
CSPD's Community Investment
The College Station Police Department has been investing in the kind of infrastructure that shapes long-term safety outcomes. In December 2024, the City Council unanimously authorized acceptance of a $464,552 state grant to fund two full-time officers dedicated exclusively to mental health crisis response — covering a vehicle, equipment, and training, with those officers joining the department's Mental Health Crisis Response Team in 2025. Mental health calls are a significant driver of police workload in any city with a large student population, and dedicated response capacity is a meaningful operational improvement.
The department also runs a Citizens Police Academy, offering community members direct insight into police operations, and participates in National Night Out to strengthen the relationship between neighborhoods and the officers who patrol them. In a city where the residential and university populations can feel like parallel worlds, those touchpoints matter.
What a High Call Volume Actually Means
The 89,142 calls for service the department handled in 2024 sounds like a large number — and it is, for a city of 127,472. But call volume includes welfare checks, noise complaints, parking issues, and minor disputes alongside actual criminal incidents. A high call volume in a college town is partly a function of a young, dense, and socially active population. It's not a proxy for danger, and it shouldn't be read as one.
Practical Safety Research for Anyone Choosing a Neighborhood
The city-level crime rate is a reasonable starting point. The neighborhood-level picture is where the decision actually gets made. Here's how to read College Station's safety data without being misled by it.
Read Crime Maps Carefully
Crime maps for College Station will almost always show elevated incident density near the Texas A&M campus and along the commercial corridors in the northwest. That pattern is driven by the concentration of people in those areas — retail employees, shoppers, students, and visitors — not by risk to permanent residents. When you're evaluating a map, look at the residential blocks specifically, not the commercial zone adjacent to them.
Ask About Owner-Occupancy
In a college town, owner-occupancy rate is one of the most useful safety proxies available. Neighborhoods with high owner-occupancy — Pebble Creek is a clear example — tend to have more invested, longer-term residents, more active watch programs, and less of the turnover that can destabilize a block. When you're comparing two neighborhoods that look similar on paper, the tenure and ownership mix often explains the difference in how they feel.
What Locals Notice After Six Months
The thing most people don't expect: car burglaries are the dominant property crime, and they are almost entirely opportunistic. Unlocked doors, valuables left on seats, and vehicles parked in poorly lit areas account for a disproportionate share of College Station's property crime incidents. Locking your car is not a throwaway tip here — Police Chief Billy Couch specifically flagged unlocked vehicles as the root cause of a substantial portion of vehicle burglaries in 2024. It is genuinely the single most effective safety habit in this city.
The Seasonal Pattern Worth Knowing
College Station's rhythm is tied to the academic calendar in ways that affect everything, including crime patterns. When Texas A&M is in session, the city's population swells and activity in the Northgate district intensifies. When students leave for the summer, the city quiets substantially. If you're visiting neighborhoods to get a feel for them, the experience in July is not the same as the experience in October during football season. Both are real, and both are College Station — but they're worth experiencing at different times before you settle on an area.
Use the City's Own Resources
The College Station Police Department's annual reports to City Council are publicly available and provide the most credible neighborhood-level context available. Those reports reflect actual CSPD data rather than third-party aggregators, and they give you the trend picture alongside the snapshot. Combined with a direct look at the neighborhoods in this guide, they give you a grounded, current picture rather than a generalized score.
Local Expert Takeaway: College Station's violent crime rate sits well below both state and national averages, and the property crime that does occur clusters in commercial and entertainment zones rather than residential neighborhoods. The city's southeast quadrant — including Southwood Valley, Pebble Creek, and Castlegate — consistently records the lowest incident levels. The single most practical safety habit here is locking your car: Police Chief Billy Couch named unlocked vehicles as the leading driver of vehicle burglaries in 2024, and that pattern holds across the city. The dual police presence — CSPD and Texas A&M's University Police Department — provides a level of coverage unusual for a city of 127,472, and the department's 2025 data shows crime declining across nearly all categories.
Quick Takeaways & FAQs
✅ College Station records a violent crime rate of 2 per 1,000 residents, sitting below both Texas state and national averages and making it one of the safer large cities in the Brazos Valley.
⚠️ Property crime — particularly vehicle burglaries — is the real risk in College Station, and it concentrates heavily in commercial and campus-adjacent zones rather than residential neighborhoods.
📍 The city's southeast quadrant consistently records the lowest victimization rates, while the northwest — home to retail corridors and the Northgate entertainment district — drives most of the elevated incident numbers on crime maps.
Is College Station safe compared to other Texas cities?
Which neighborhoods in College Station are the safest?
Is it safe to live near Texas A&M?
What is the most common crime in College Station?
How does College Station's crime rate compare to Bryan?
Moving to Texas?
Tell us what you need help with and we'll connect you with local resources.
