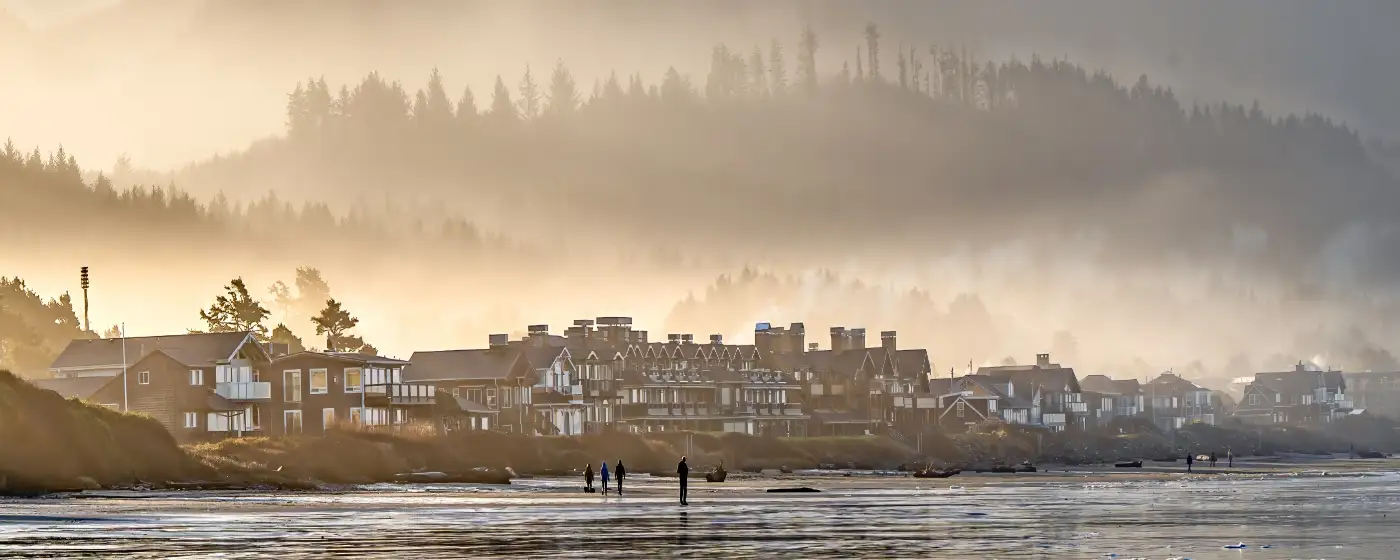
Everyone who looks up Seaside's crime statistics for the first time has the same reaction: the property crime rate looks alarming on paper, and then you read it more carefully and realize it says almost nothing about what life in a residential neighborhood actually feels like. Seaside sits on the northern Oregon coast, connected to Portland and the rest of the state by US-101 (Oregon Coast Highway), and its permanent population of 7,192 is vastly outnumbered by tourists, day-trippers, and weekend visitors for much of the year. That gap between who lives here and who is physically present is the single most important context for reading any crime number attached to this city.
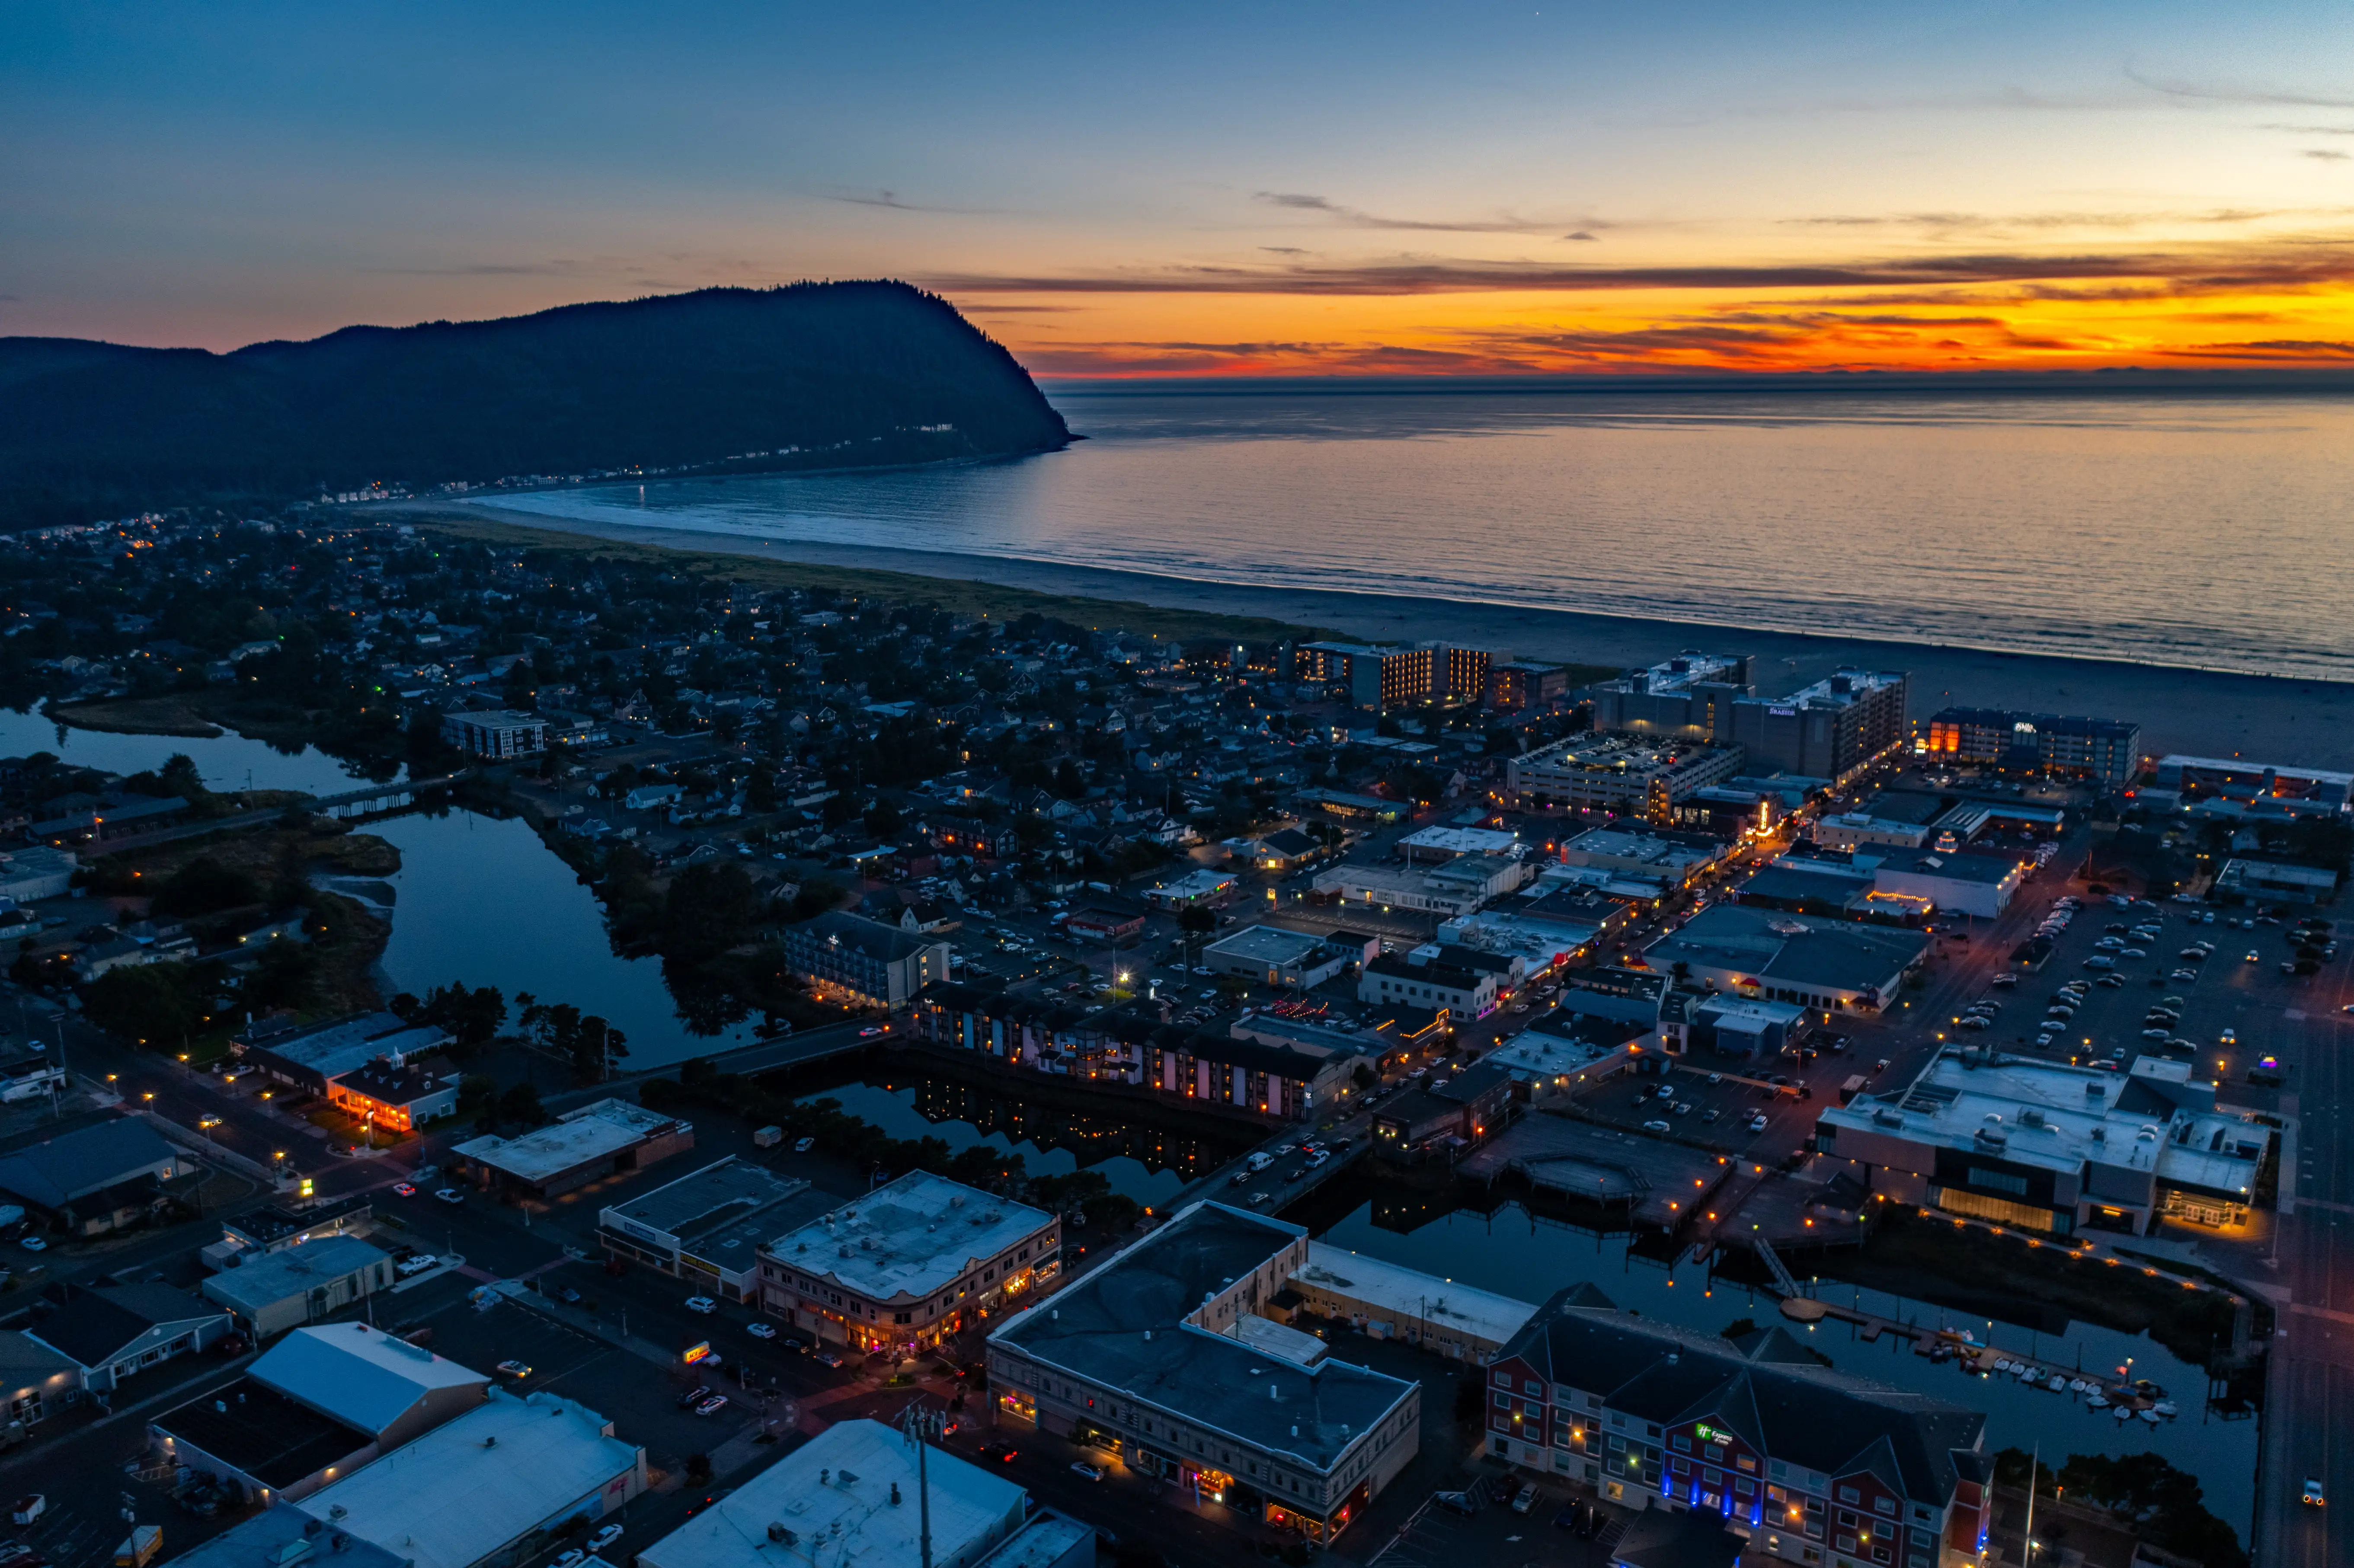
The tourism economy that drives Seaside — the Broadway Street arcades, the Seaside Promenade, the Turnaround and its Lewis and Clark Monument, the Seaside Aquarium — concentrates foot traffic and vehicle density in a tight commercial corridor for months at a stretch. Crime rates calculated per resident treat a city of 7,192 as though those 7,192 people are the only ones ever present. They are not. When visitor volume is factored in, Seaside's crime index sits just below the national average — a substantially different picture than the raw per-capita figures suggest.
Understanding where Seaside sits on safety requires separating two distinct realities: the commercial tourist zone, which generates the overwhelming majority of the city's property crime reports, and the residential neighborhoods — North Seaside, The Cove, Stanley Acres, Blue Heron Pointe, Thompson Falls Estates — where year-round, owner-occupied households experience something far closer to a quiet small-town Oregon life. There is also a third safety dimension unique to this stretch of coast: natural hazard exposure, specifically earthquake and tsunami risk, which matters in ways that don't show up in any crime table. This guide works through all of it, neighborhood by neighborhood and risk category by risk category, so you can make a genuinely informed decision about where in Seaside to put down roots.
The sections below cover Seaside's crime statistics in context, where property crime actually concentrates, the residential neighborhoods that sit well outside that pattern, the city's tsunami inundation risk and what it means for where you choose to live, and practical safety considerations for anyone relocating here.
What the Crime Numbers Actually Mean for Seaside
| Measure | Seaside | Oregon | National | vs. national |
|---|---|---|---|---|
| Violent crime (per 1,000) | 2.23 | 3.3 | 3.7 | 40% lower |
| Property crime (per 1,000) | 37.84 | 24.5 | 18.4 | 106% higher |
State and national figures — Bureau of Justice Statistics, Crime Known to Law Enforcement, 2024 (tables 2 and 3). City figures — AreaVibes (based on FBI crime data). City rates come from a different reporting series than the state and national benchmarks, so read the comparison as a direction, not a precise multiple.
Seaside carries a violent crime rate of 2.23 per 1,000 residents — below both the Oregon state rate of 3.3 per 1,000 and the national rate of 3.7 per 1,000. That figure holds up well against peer comparisons and is genuinely reassuring for anyone worried about personal safety in daily life.
A property crime rate of 37.84 per 1,000 residents is where things look harder. Oregon's state property crime rate is 24.5 per 1,000 and the national figure is 18.4 per 1,000. Seaside runs well above both. That gap deserves honest explanation rather than dismissal — but it also demands context before it drives a decision.
The Visitor Distortion
Roughly 77% of vacant housing units in Seaside are used part-time as seasonal, recreational, or occasional-use housing, according to city planning documents. The year-round resident count of 7,192 is the denominator in every per-capita crime calculation — but on a summer weekend, the actual human population of Seaside can be many times that. A vehicle break-in near the Turnaround gets counted against 7,192 people even if the car belongs to a visitor from Portland.
When visitor volume is factored in through an adjusted crime index, Seaside scored 232 in 2024 against a U.S. average of 235.3 — essentially at the national baseline. That is not a license to ignore the property crime picture, but it reframes what is driving the number and where the risk actually lives.
A Meaningful Trend
Total crime in Seaside dropped substantially in the most recent reporting period, with violent crime falling particularly sharply. The direction is encouraging, and the Seaside Police Department maintains 24-hour dispatch and patrol coverage year-round. The city council has also been actively discussing a Public Property Exclusion Ordinance aimed at managing conduct in public spaces — a signal that civic leadership is engaged with the problem, not passive about it.
Where Property Crime Concentrates — and Where It Doesn't
The Broadway Street corridor, the Promenade, and the retail and restaurant cluster near the Turnaround account for the bulk of Seaside's property crime. This is the city's commercial spine: the arcades, the souvenir shops, the packed parking lots in July. Theft and vehicle break-ins dominate the report log here, and they are almost entirely property-related rather than violent.
If you are driving into Seaside for a beach day, the practical advice from people who know the city is simple: take your belongings with you. Leaving anything visible in a parked car near the commercial core is, by local consensus, an invitation. That habit costs nothing and eliminates most of the personal risk in this zone.
The Residential Difference
North Seaside, The Cove and South Seaside, Stanley Acres, Blue Heron Pointe, and Thompson Falls Estates operate in a fundamentally different safety environment. These are low-density, predominantly owner-occupied neighborhoods removed from the commercial corridors that generate city-wide statistics. Annual crime counts in these zones run in the single digits — not as a per-thousand rate, but in total.
Stanley Acres and the eastern neighborhoods sit away from the beachside tourist traffic entirely, with larger lots and a full-time-resident character that feels more like a quiet inland Oregon town than a coastal resort. The Cove and South Seaside, near Tillamook Head, attract people drawn to nature and the ocean rather than the commercial strip — lower-traffic, view-oriented, and consistently described by residents as the calmer end of the city. For more on the character and housing stock of each of these areas, the neighborhoods guide goes deeper.
Downtown Seaside and the Promenade
Living in Downtown Seaside or immediately adjacent to the Promenade means accepting proximity to the tourist economy — which brings noise, seasonal density, and elevated property crime risk that the residential neighborhoods simply don't share. For year-round residents who choose this zone, the trade-off is walkability to everything the city offers at the cost of a less quiet daily environment. That is a lifestyle question as much as a safety question, and it is worth weighing honestly before settling on a neighborhood.
Neighborhood-by-Neighborhood Safety Snapshot
| Neighborhood | Safety Character | Primary Risk Type | Best For |
|---|---|---|---|
| Downtown Seaside | Most active; tourist-zone exposure | Property crime (theft, vehicle break-ins) | Walkable |
| The Promenade (Prom) | High foot traffic; elevated property crime | Property crime; seasonal crowds | Renters |
| The Cove / South Seaside | Quiet, nature-oriented; well removed from tourist core | Minimal; low-density residential | Nature Quiet |
| North Seaside | Calm residential; owner-occupied | Minimal; single-digit annual counts | Families Quiet |
| East Hills / Seaside Heights | Elevated terrain; removed from commercial zone | Minimal; low traffic | Views Privacy |
| Stanley Acres | Suburban, quiet; full-time resident base | Minimal; larger lots, low density | Families Value |
| Blue Heron Pointe | Newer development; bluff location, low crime | Minimal; owner-occupied, newer construction | First-Time Families |
| Thompson Falls Estates | Quiet, established residential | Minimal; low-density owner-occupied | Quiet Privacy |
The clearest pattern across this table is the distance from Broadway Street and the Promenade. Every neighborhood that sits physically removed from that commercial corridor operates at a fundamentally different risk level — not modestly lower, but categorically different.
Blue Heron Pointe sits on a bluff and benefits from newer construction, a predominantly owner-occupied character, and proximity to the school campus and a regional health system. For families with kids evaluating safety holistically — both crime and natural hazard exposure — that bluff location carries additional significance, which the next section covers directly.
Looking to buy in Seaside? Estimate your payment.
Enter your numbers to see an estimated monthly mortgage payment.
Estimate only. Excludes HOA fees and mortgage insurance. The interest rate above is a starting point, not a quoted rate — replace it with your own to see real numbers. Insurance is a flat placeholder, not a Seaside quote.
Tsunami and Natural Hazard Risk: The Safety Conversation Unique to Seaside
No honest safety guide for Seaside can stop at crime. The city sits on the Oregon coast in the direct path of a Cascadia Subduction Zone earthquake and tsunami scenario that geologists have studied intensively. Oregon's Department of Geology and Mineral Industries models estimate that tsunamis could reach 70 feet or more in Seaside, and that roughly 80% of residents live only 15 feet above sea level. That is the single most consequential long-term safety fact for anyone choosing where in this city to live.
What the Elevation Question Means Practically
Most of Seaside's housing stock — including a significant portion of the attractive beachfront and Promenade-adjacent properties — sits within the tsunami inundation zone. That does not make those homes uninhabitable or uninsurable in ordinary times. It does mean that neighborhood elevation should factor into a long-term decision about where to put down permanent roots, particularly for families.
The most tangible civic response to this risk was the school district's decision to relocate its middle and high schools to a new hilltop campus that opened in 2021. The campus was designed explicitly as an earthquake and tsunami refuge for the broader community — not just for students. For families, the combination of school proximity and out-of-zone elevation makes the hilltop area a meaningful anchor when thinking about where to live.
Neighborhoods That Sit Above the Inundation Zone
Blue Heron Pointe is specifically sited on a bluff outside the tsunami inundation zone — that is not incidental to its appeal but central to why it attracts families thinking long-term. East Hills and Seaside Heights, given their elevated terrain, similarly offer more natural hazard separation than the flat coastal core. Stanley Acres and Thompson Falls Estates, sitting further inland and at higher elevation than the beachfront, also reduce tsunami exposure relative to the Promenade corridor.
This is not a reason to dismiss the lower-elevation neighborhoods — many residents live there for decades without incident, and Oregon's emergency management infrastructure has invested seriously in public education and warning systems. But if you are choosing between two neighborhoods and the elevation question matters to you, the data here is clear and worth factoring in before you settle on an area.
Emergency Preparedness as a Resident Habit
Long-term Seaside residents treat tsunami preparedness the way earthquake-country residents treat having a go-bag: it is part of the background hum of coastal living rather than a source of daily anxiety. The city has marked evacuation routes, and the Cascadia Subduction Zone risk is a fixture of public conversation rather than a suppressed fact. New arrivals almost universally say they were aware of the risk before moving — and that awareness, rather than surprise, is what separates comfortable long-term residents from those who leave within a few years.
Practical Safety Tips for Living in or Relocating to Seaside
The single most useful thing to know before choosing a neighborhood in Seaside is that the city's crime statistics are almost entirely a property crime story, and that story is almost entirely a tourist-corridor story. If your daily life will not involve parking near the Broadway arcades or leaving a bag in a car near the Turnaround, most of what drives Seaside's headline numbers is not your problem.
What to Research Before Choosing a Neighborhood
Before settling on a specific block or street, pull the DOGAMI tsunami inundation maps for Seaside — they are publicly available and show clearly which parcels sit within and outside the modeled inundation zone. Pair that with the city's elevation data, and you have the two most useful inputs that do not show up in any standard crime report.
For the commercial-zone neighborhoods — Downtown Seaside and the Promenade — ask specifically about ground-floor versus upper-floor units if you are looking at any multi-unit situation, and about covered versus street parking. Vehicle break-ins follow opportunity; a covered parking spot in the tourist core changes the risk calculus meaningfully.
Seasonal Patterns Worth Understanding
Summer in Seaside is not a quiet-beach-town summer. The Promenade fills, Broadway Street is dense with visitors, and the commercial core runs at a completely different intensity than the rest of the year. People who move here expecting a tranquil coastal retreat and then experience their first July often describe a genuine shock — not because anything dangerous happened, but because the crowd and noise level is far beyond what they pictured when they chose a small city of 7,192.
That seasonal swing also means that any crime data from a summer month will look worse than a February figure. Year-round residents in the residential neighborhoods barely notice it; residents in the tourist core live through it and make a deliberate peace with it, or they don't stay long.
The Police Department and Community Presence
The Seaside Police Department maintains 24-hour dispatch and patrol coverage throughout the year, including the tourist season when staffing demands are highest. Community outreach is an active part of how the department operates — not a tagline. For a city this size, that consistent coverage is meaningful, and the drop in both total and violent crime in the most recent reporting period suggests the engagement is producing results.
For a fuller picture of how Seaside's neighborhoods compare in terms of housing stock, character, and who tends to end up where, the neighborhoods guide is the right next read. If cost of living and what you get for the typical home price is what you are weighing, the cost of living page covers that ground.
Local Expert Takeaway: Seaside's property crime rate looks alarming until you understand where it comes from: a handful of blocks around Broadway Street and the Turnaround, driven almost entirely by visitor-related theft in a city whose tourist population dwarfs its permanent resident count of 7,192. The residential neighborhoods — Stanley Acres, Blue Heron Pointe, The Cove, North Seaside — are genuinely quiet, with annual crime counts in the single digits. The more consequential safety question for anyone buying here long-term is not the crime map but the DOGAMI tsunami inundation map. Blue Heron Pointe and the hilltop neighborhoods around the school campus are the clearest out-of-zone anchors in the city. Know which zone your property sits in before you decide on a neighborhood — it is the one piece of local safety research that most relocators wish they had done first.
Quick Takeaways & FAQs
✅ Seaside carries a violent crime rate of 2.23 per 1,000 residents — below both the Oregon state average and the national average, meaning personal safety in daily life is not a serious concern for most residents.
⚠️ A property crime rate of 37.84 per 1,000 residents runs well above state and national averages, but is almost entirely concentrated in the Broadway Street and Promenade tourist corridor rather than spread across residential neighborhoods.
📍 Tsunami inundation zone maps from Oregon's DOGAMI are publicly available and show which Seaside neighborhoods sit outside the modeled risk area — Blue Heron Pointe and the East Hills terrain are among the clearest examples of elevated, out-of-zone locations.
Is Seaside, Oregon a safe place to live?
Why is Seaside's property crime rate so high?
Which Seaside neighborhoods are the safest for families?
Is tsunami risk a real safety concern when buying in Seaside?
Does Seaside have active police coverage year-round?
Moving to Oregon?
Tell us what you need help with and we'll connect you with local resources.
