
Most people who move to Gig Harbor from somewhere else say it feels immediately calmer than they expected from a South Puget Sound city. That instinct is backed up by data. Gig Harbor's violent crime rate came in at 2 per 1,000 residents in 2024 — well below the Washington state average and noticeably below the national figure. What surprises people once they start digging into the numbers is the property crime rate, which reads higher and can stop a search cold. The honest answer is that the property crime picture in Gig Harbor is almost impossible to read fairly without first understanding what's happening at the state level across all of Washington.
Gig Harbor sits at the western end of the Tacoma Narrows Bridge on the Kitsap Peninsula, a 12,000-person city where the median household income runs at $118,395. That economic profile shapes the safety picture in a specific way: the city deals with opportunistic theft — retail and vehicle-related — far more than it deals with the kinds of violent crime that drive residents out of other South Puget Sound communities. The Gig Harbor Police Department presented its 2024 crime data to the city council in August 2025, and the headline was a 10% drop in overall crime year over year, with zero murders recorded in the city for the full year.
Context matters enormously here. Washington state ranks among the worst in the nation for property crime, with vehicle theft rates more than twice the national rate. A city in Washington that scores above the national property crime benchmark isn't necessarily struggling — it may simply be operating inside a state where even well-run, affluent communities carry that elevated baseline. Gig Harbor is a clear example of that pattern. Its violent crime numbers suggest a genuinely safe community; its property crime numbers reflect the state it's in, not a red flag specific to Gig Harbor.
Whether you're weighing a specific neighborhood or just trying to get a clear-eyed read on the city as a whole, the sections below break down Gig Harbor's crime statistics against state and national benchmarks, explain the property crime picture honestly, profile the neighborhood safety landscape, and cover what the Gig Harbor Police Department is actually doing about it.

Gig Harbor Crime Stats vs. State and National Benchmarks
The most important number to start with is the violent crime rate: 2 per 1,000 residents, or approximately 203 per 100,000. The 2024 U.S. national rate was 359 per 100,000. Washington state's 2024 rate was 326 per 100,000 — itself below the national figure but elevated compared to pre-pandemic levels. Gig Harbor sits well below both.
| Geography | Violent Crime (per 100k) | Property Crime (per 100k) | vs. Gig Harbor Violent |
|---|---|---|---|
| Gig Harbor, WA (2024) | 203 | 2,964 | — |
| Washington State (2024) | 326 | Elevated (top 5 nationally) | ~38% higher |
| U.S. National (2024) | 359 | 1,760 | ~43% higher |
| Tacoma, WA (general) | Significantly higher | Significantly higher | Notably above GH |
| University Place, WA | Comparable range | Comparable range | Similar profile |
| Steilacoom, WA | Low (small city) | Low (small city) | Comparable |
Zero murders were recorded in Gig Harbor in 2024, and overall crime fell 10% from 2023 to 2024 — fitting a broader national trend where violent crime dropped roughly 5% and property crime dropped around 9% year over year nationally.
The Property Crime Number Needs Context
Gig Harbor's property crime rate of approximately 2,964 per 100,000 reads as high against the national benchmark of 1,760. But Washington state as a whole ranks second-worst in the nation for property crime, with vehicle theft rates more than double the national rate. Comparing any Washington city's property crime rate directly to the national average without that context produces a misleading picture.
The dominant crime category in Gig Harbor is theft — primarily retail and vehicle-related — confirmed by the city's interim police chief in the August 2025 council presentation. That category was trending downward from 2023 to 2024. Violent confrontation is not the pattern here.
What the Numbers Actually Mean Day to Day
Violent Crime: The Short Version
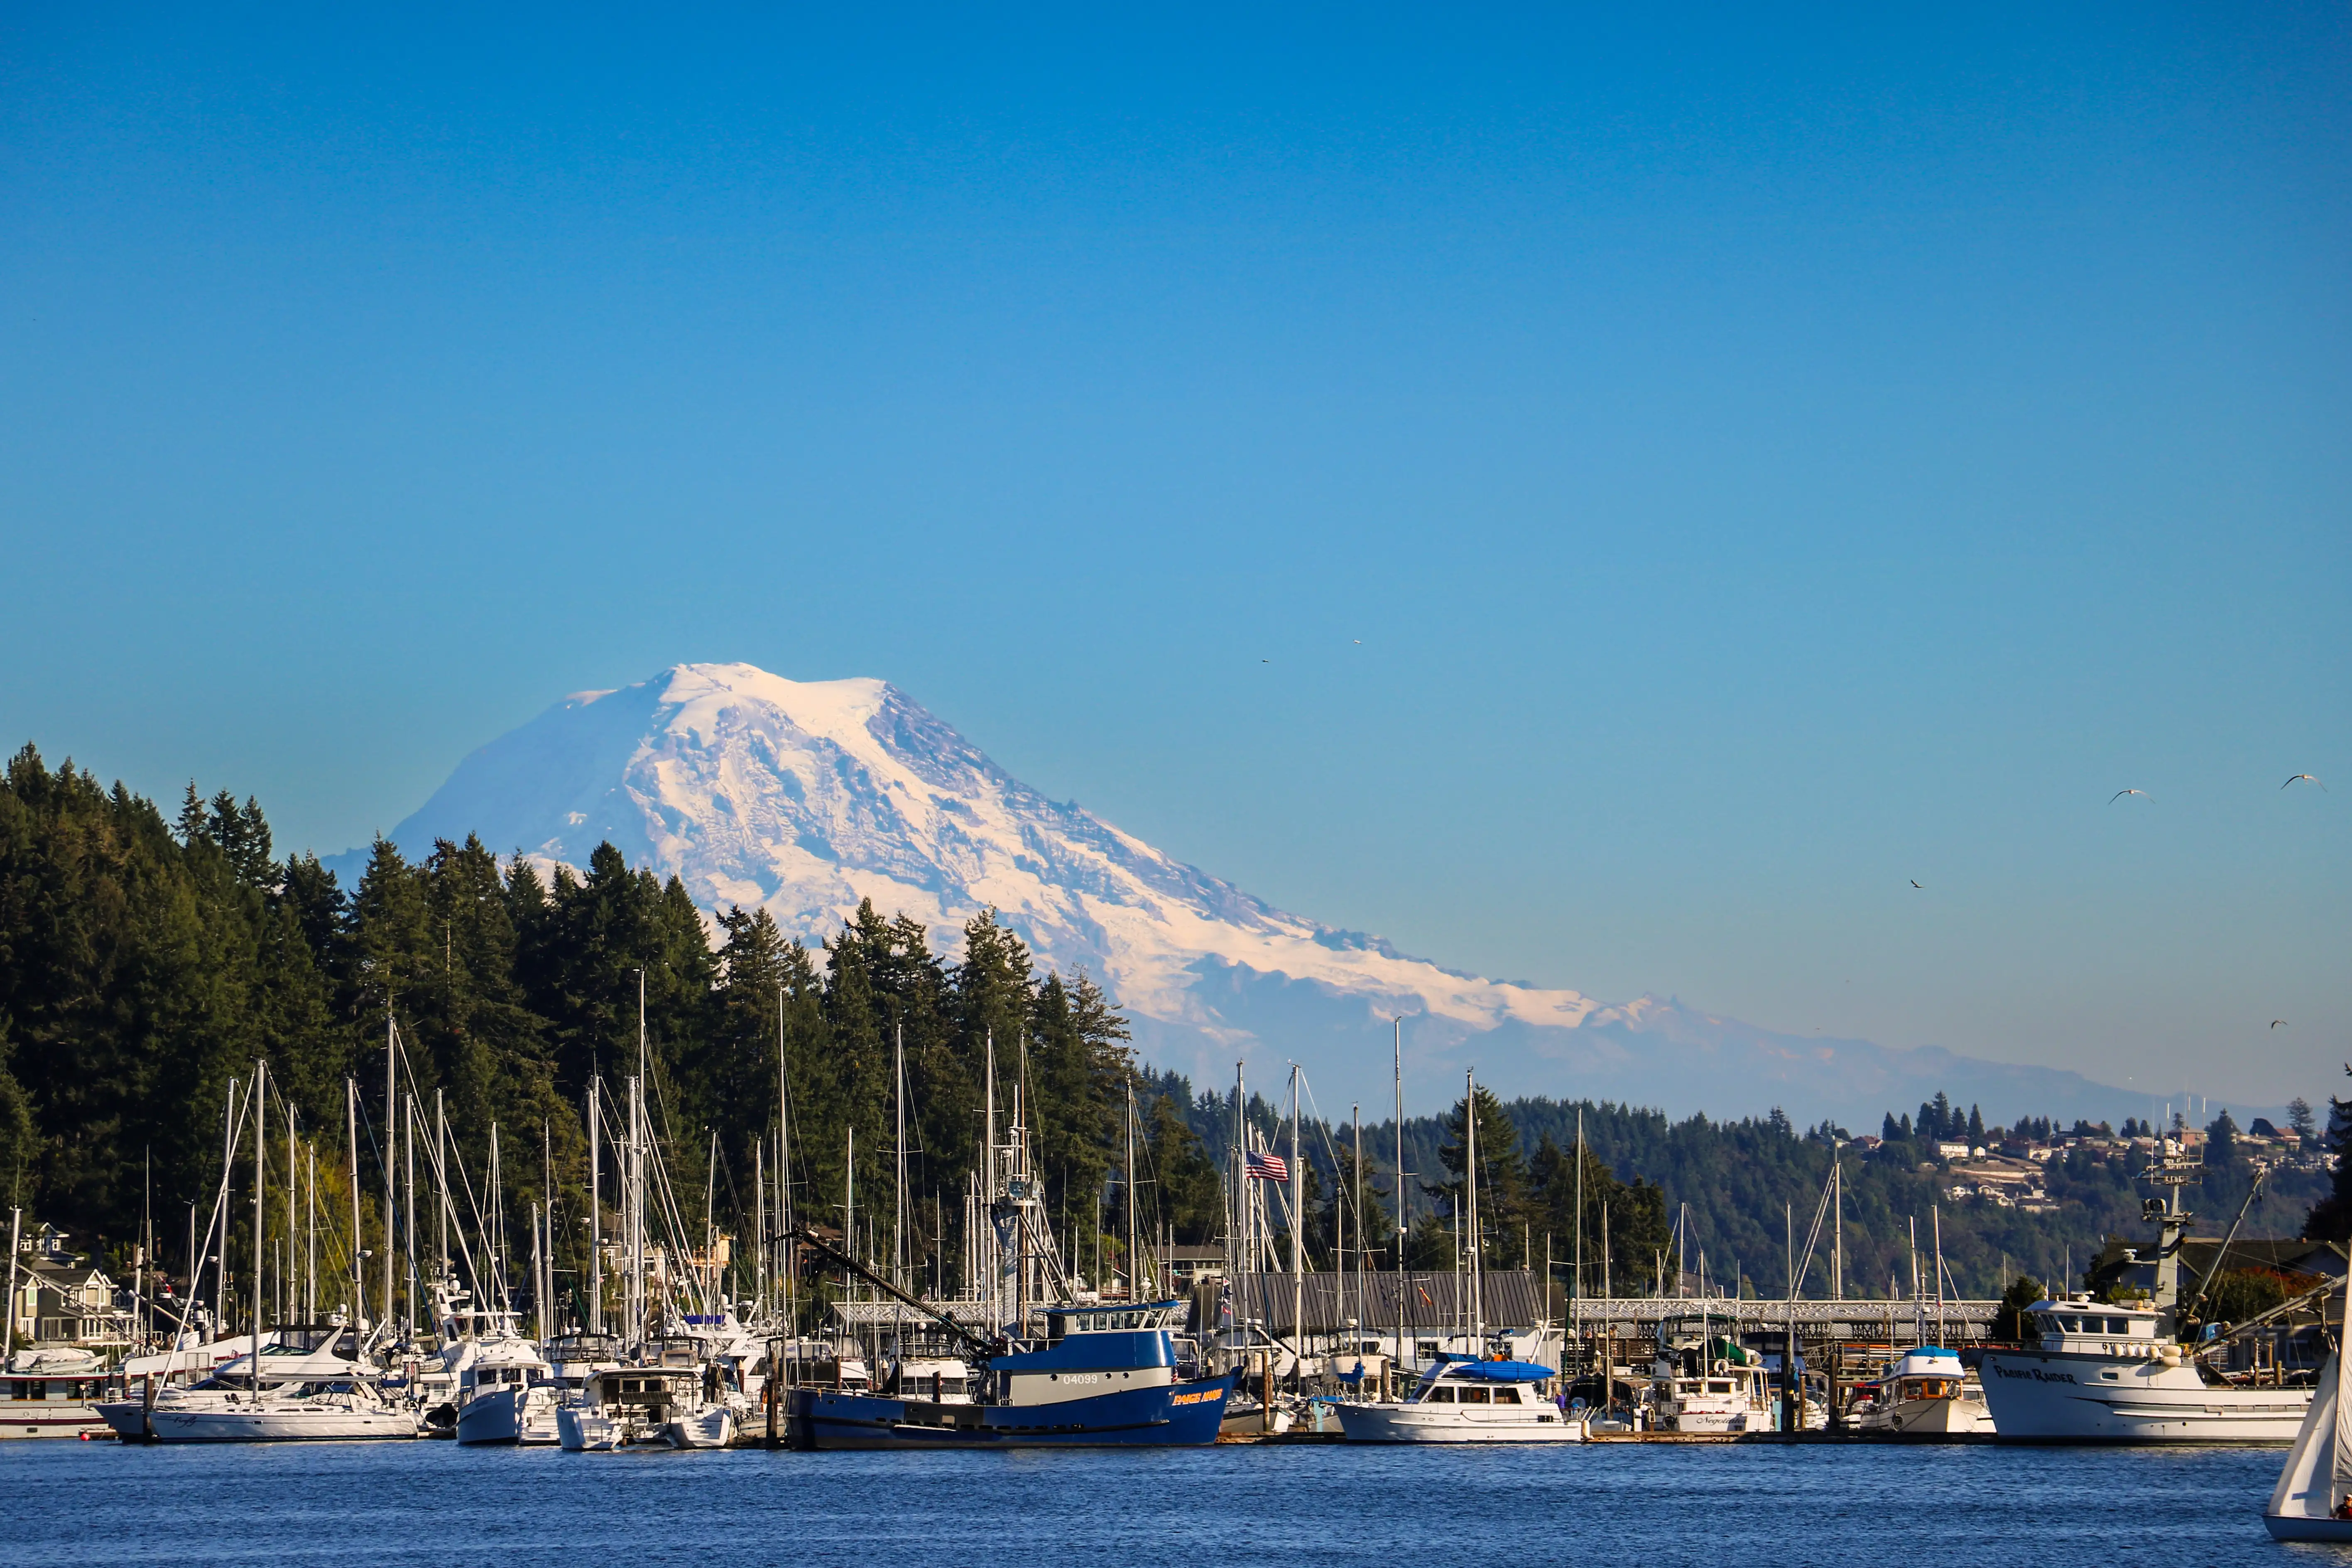
A violent crime rate of 2 per 1,000 means that in a city of roughly 12,600 people, the number of reported violent incidents is very low in absolute terms. For residents, this translates to a city where walking the waterfront along Harborview Drive at dusk, grabbing dinner near Skansie Brothers Park, or letting kids play at Eddon Boat Park doesn't carry the background anxiety that residents in higher-crime South Puget Sound cities describe.
That's not a marketing claim — it's consistent with what the numbers show and what the city's own police data confirms.
Property Crime: What You're Actually Managing
Property crime is the real story, and here the answer is: lock your car, don't leave valuables visible, and be thoughtful about where you park near commercial areas. Vehicle theft and larceny-theft are the specific categories driving Gig Harbor's elevated property crime rate — both are also the categories driving Washington's statewide problem.
This matters practically. If you're choosing between a home near Gig Harbor North's commercial corridor along Pt. Fosdick Drive versus a quieter residential street in Artondale or Rosedale, the exposure to retail and parking-lot-adjacent theft is meaningfully different. Areas with denser retail and higher vehicle traffic carry more of that risk than established residential neighborhoods where most streets don't have public parking lots attached to them.
What Surprises People After Six Months
New residents almost universally say they underestimated how casual property crime awareness becomes a habit here — not paranoia, but a specific reflex: don't leave a laptop bag on a car seat, don't assume a residential street is zero-risk just because it's quiet. The city itself trends safe, but Washington state's vehicle theft climate is a real backdrop. Neighbors talk about it openly at block association meetings and through the police department's neighborhood watch program. Joining one of those networks early gives you a ground-level picture no crime statistic can fully replace.
Neighborhood Safety Landscape in Gig Harbor
No public dataset breaks Gig Harbor's crime down to the neighborhood level with statistical reliability — the city's population is small enough that neighborhood-specific figures would fluctuate too much year to year to mean anything. What can be characterized is the general risk profile by area type, based on the nature of land use and community character. For a deeper look at what distinguishes each area to live in, see the full neighborhood guide.
Downtown / Harbor Historic District
The waterfront stretch — Harborview Drive, the net sheds, Tides Tavern, 7 Seas Brewing — is the city's most visited corridor and carries the property crime exposure that comes with any high-traffic commercial area. Parking areas near the waterfront are the most common venue for vehicle-related incidents. It's still a place where locals walk comfortably day and night; the risk is opportunistic, not predatory.
Best for: Walkable — with eyes-open awareness of retail and parking-lot theft.
Gig Harbor North / Point Fosdick
The commercial growth along the Point Fosdick Drive corridor — big-box retail, grocery anchors, the kind of shopping that didn't exist in Gig Harbor twenty years ago — brings the same retail-theft and parking-lot patterns that follow dense commercial development everywhere in Western Washington. Residential streets in Gig Harbor North, set back from the commercial strip, have a quieter profile.
Best for: Families Commuters — convenient but worth knowing which streets back up to retail.
Canterwood
Canterwood is a gated golf community on the western edge of the city. Controlled access limits the opportunistic property crime exposure that affects more open neighborhoods. The trade-off is that it's a self-contained enclave — residents who want to feel insulated from even the ambient property crime pattern of the broader city often point here.
Best for: Privacy Luxury
Artondale, Rosedale, and Peacock Hill
These established residential areas — mostly single-family homes on larger lots, limited through-traffic, no commercial anchors — represent the lowest property crime exposure in the city. Artondale along Artondale Drive NW, Rosedale near the Fox Island Bridge approach, and Peacock Hill's elevated lots all share the same profile: quiet streets with little reason for strangers to be passing through.
Best for: Quiet Families Views
Wollochet
Wollochet Bay sits at the southern end of the city, a mixed waterfront and residential area with a distinctly local feel. Lower commercial density than Gig Harbor North, less visitor traffic than downtown. Property crime exposure here tracks closer to the residential neighborhoods than to the commercial corridor.
Best for: Nature Quiet
Looking to buy in Gig Harbor? Estimate your payment.
Enter your numbers to see an estimated monthly mortgage payment.
Estimate only. Excludes HOA fees and mortgage insurance. The interest rate above is a starting point, not a quoted rate — replace it with your own to see real numbers. Insurance is a flat placeholder, not a Gig Harbor quote.
How Gig Harbor's Police Department Approaches Safety
With 22 sworn officers serving a city of roughly 12,600 residents, Gig Harbor PD operates at a staffing ratio of approximately 1.5 to 2.5 officers per 1,000 residents depending on methodology — above the Washington state average of 1.36 per 1,000 and in a range that most community policing experts consider adequate for a city of this size and crime profile.
A Neighborhood-Focused Model
The department runs active neighborhood watch programs, crime prevention education, and juvenile crime prevention efforts — not as checkbox programs but as the actual operational framework the interim police chief referenced in the August 2025 council presentation. Victim support services, including immediate assistance and legal process guidance, are part of the department's standard response model.
In 2024, Gig Harbor PD maintained regional assignments to the Pierce County Force Investigation Team (PCFIT) and the Metro Collision Response Team (MCRT). These partnerships matter for a city of Gig Harbor's size: they provide access to specialized investigative resources that a 22-officer department wouldn't be able to sustain independently.
The Bridge Factor
One structural reality that shapes policing in Gig Harbor: the Tacoma Narrows Bridge is the only direct link to Tacoma and the broader Pierce County road network. That geographic isolation cuts both ways for safety. It limits the casual through-traffic that drives property crime in more connected suburban cities. It also means that when something does happen, response resources from Pierce County Sheriff's Office are on the other side of the bridge. In practice, for the kinds of crimes that actually occur here — primarily theft — this hasn't been a material issue in the data. But it's worth understanding the geography before assuming that "county backup" means the same thing here as it would in University Place or Fircrest.
How to Research Safety Before Choosing a Neighborhood
Go Beyond City-Level Averages
City-level crime figures — Gig Harbor's 2 per 1,000 violent, 29.6 per 1,000 property — are the right starting point, but they mask meaningful variation within the city. A home three blocks from the Point Fosdick commercial corridor carries different day-to-day property crime exposure than a home on a quiet residential street in Artondale, even though both are in the same city and share the same headline statistic.
When you're narrowing down a specific neighborhood, drive the streets at multiple times of day. Note how many commercial parking lots back up to residential blocks, whether streets are through-routes or cul-de-sac patterns, and how much foot and vehicle traffic moves through at night. Those observations tell you more than any aggregate crime rate.
Tools Worth Using
- Gig Harbor Police Department crime map — the department's neighborhood watch infrastructure means officers are active in specific areas; contacting the non-emergency line to ask about activity patterns in a street you're considering is a reasonable step.
- NeighborhoodScout and AreaVibes — the sources behind the city-level figures cited in this guide; both allow you to look at sub-city geographies, though small-city data fluctuates.
- Nextdoor and neighborhood Facebook groups — for Gig Harbor specifically, these surface the on-the-ground property crime incidents that aggregate data lags by a year. Vehicle break-ins near the waterfront commercial areas show up in neighborhood posts weeks before they'd appear in any official dataset.
What a Safety-Focused Neighborhood Search Actually Looks Like
If minimizing property crime exposure is a priority, focus your search on residential areas with limited commercial adjacency and low through-traffic: Artondale, Rosedale, and Peacock Hill consistently fit that profile. If you want walkable access to the waterfront and can manage the property crime reality of any busy commercial area, the Downtown and Harbor Historic District offers something most South Puget Sound cities don't — a genuinely walkable, visually distinctive neighborhood with a low violent crime backdrop.
The one thing to avoid: dismissing Gig Harbor based on its property crime rate without running that figure against the Washington state baseline. Doing that comparison in isolation, against the national number alone, produces a picture of the city that doesn't match what residents actually experience on the ground.
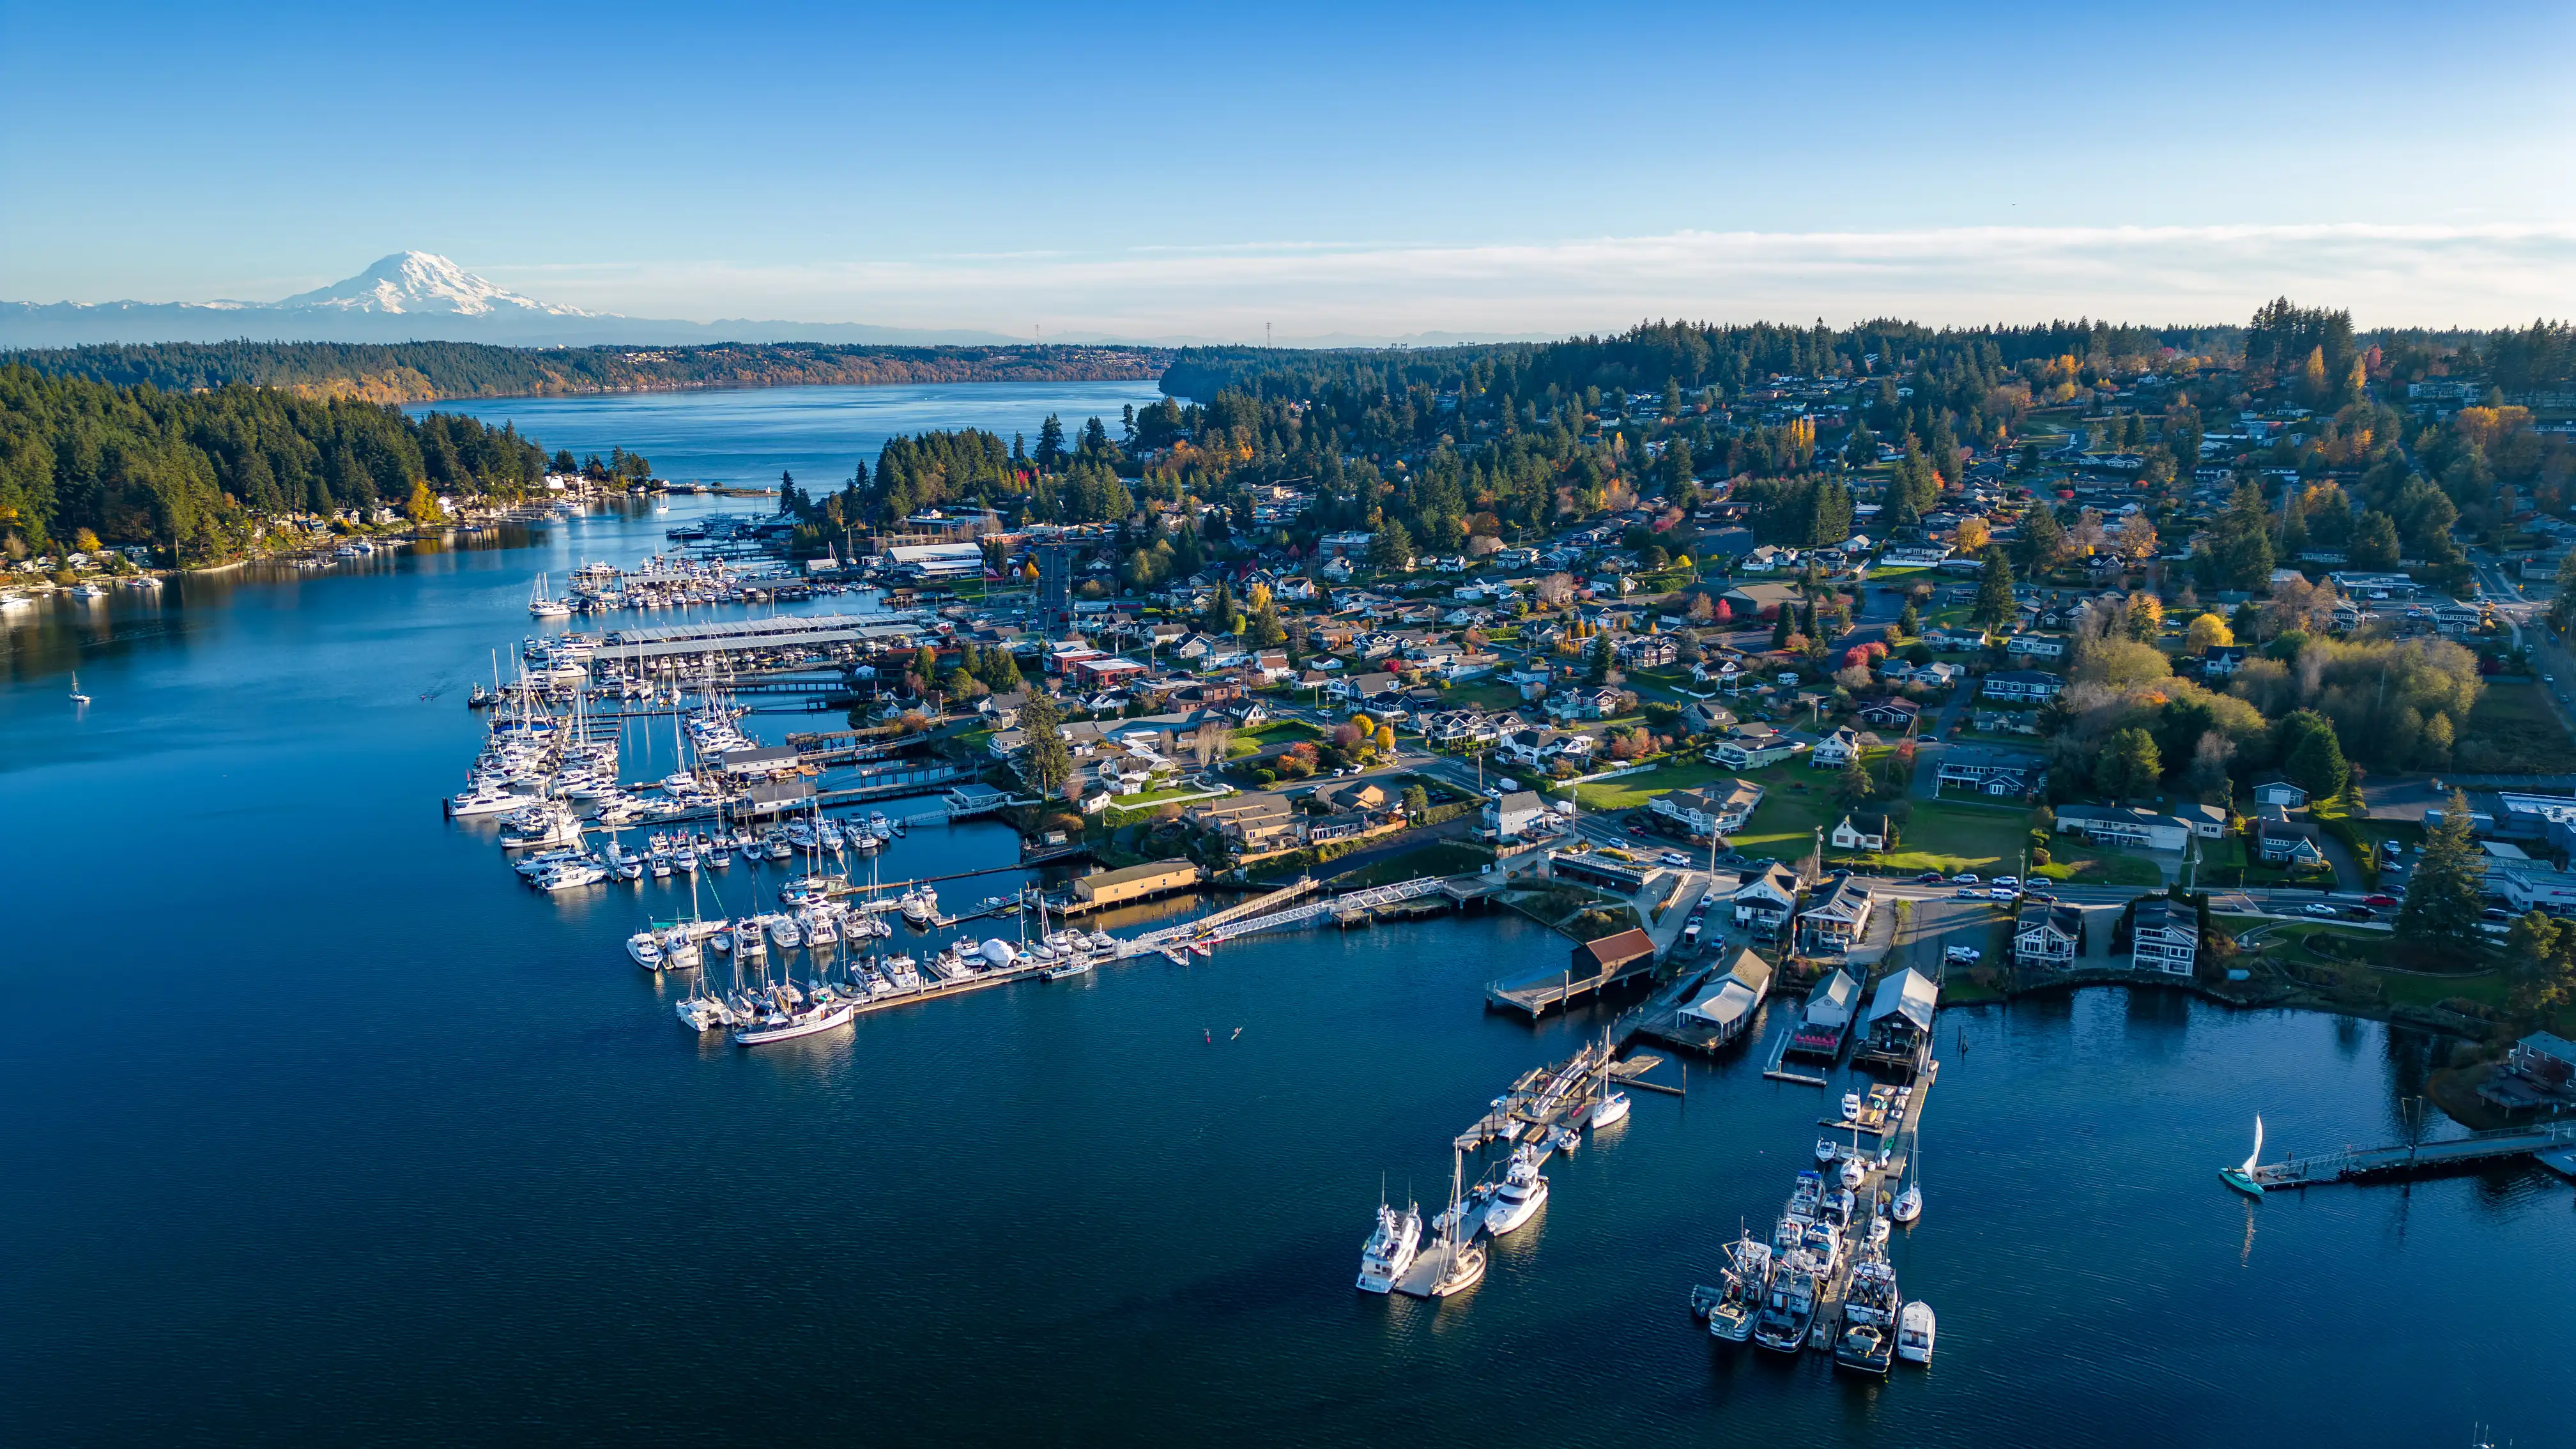
Local Expert Takeaway: Gig Harbor's violent crime rate is legitimately low — well below both the Washington state and national figures, with zero murders recorded in 2024. The property crime rate looks alarming until you run it against Washington's statewide baseline, where even well-managed cities carry elevated numbers driven by vehicle theft and retail larceny. The practical safety advice here is specific: residential streets in Artondale, Rosedale, and Peacock Hill are the lowest-exposure areas in the city; the waterfront commercial corridor and the Gig Harbor North retail strip carry the property crime risks you'd expect from any busy suburban commercial zone in Western Washington. Lock your car everywhere, join a neighborhood watch group early, and use the police department's non-emergency line to ask direct questions about specific streets you're considering — the department's community-focused model means those conversations are genuinely useful.
Quick Takeaways & FAQs
✅ Gig Harbor's violent crime rate of 2 per 1,000 residents is approximately 43% below the 2024 U.S. national rate — one of the cleaner safety pictures in South Puget Sound.
⚠️ The property crime rate of 29.6 per 1,000 reads high against the national average, but Washington state ranks second-worst in the nation for property crime — this is a statewide pattern Gig Harbor shares, not a city-specific red flag.
📍 Residential neighborhoods like Artondale and Rosedale have meaningfully lower property crime exposure than the waterfront commercial corridor and the Gig Harbor North retail strip — within-city variation matters as much as the city-wide headline number.
Is Gig Harbor a safe place to live?
How does Gig Harbor's crime rate compare to Tacoma?
What kind of crime actually happens in Gig Harbor?
Which Gig Harbor neighborhoods are the safest?
Is Washington state's high property crime rate a reason to avoid Gig Harbor?
Moving to Washington?
Tell us what you need help with and we'll connect you with local resources.
