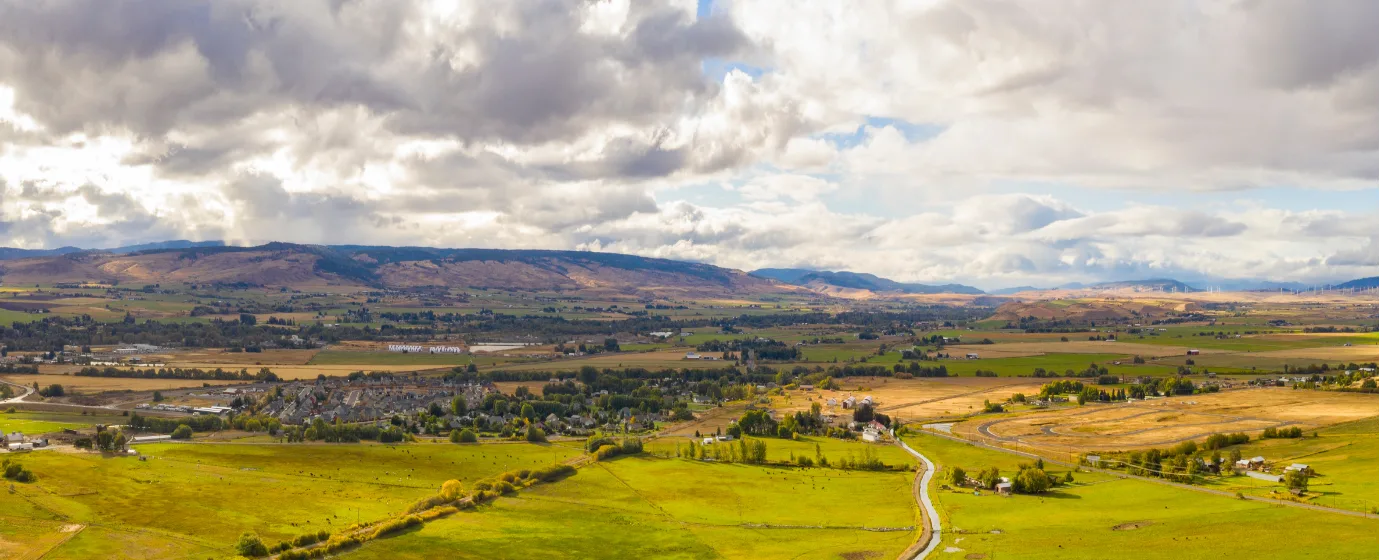
Most people researching Ellensburg start with the university and the rodeo, then get to the safety question as an afterthought. That's worth reversing. Ellensburg is a small city of roughly 21,000 people anchored by Central Washington University, sitting at the junction of I-90 and Highway 97 in Kittitas County. It functions as a regional hub, pulling in foot traffic, transient populations, and all the complexity that comes with that role. The safety picture here is genuinely better than you might expect for a town of this size and profile, but it's not without nuance.
The headline numbers from FBI 2024 NIBRS data are a reasonable starting point. Ellensburg's violent crime rate stands at 2 per 1,000 residents, which places it below both the Washington state average and the national average — a meaningful distinction for a town that draws a rotating student population and hosts major public events like the Ellensburg Rodeo. Property crime, at 21 per 1,000 residents, is the more honest concern: it sits above the national average, driven primarily by larceny and theft rather than more serious offenses. The 2024 trend, however, moved sharply in the right direction. The city recorded its lowest overall crime level since it began reporting under the FBI's current NIBRS system, with a 20% drop in property crimes and a 70% plunge in motor vehicle thefts specifically.
What sets Ellensburg's recent trajectory apart is that the decline isn't purely cyclical. The Ellensburg Police Department adopted a Precision Policing strategy in 2022 — an evidence-based approach that targets patterns rather than simply responding to calls — and the department's own data shows a 28% reduction in overall crime through 2024 since that shift. The department runs 29 sworn officers alongside community programs including a Citizen's Academy, National Night Out, and a Handle With Care initiative launched in late 2024 that connects first responders with schools to buffer kids from trauma. Mental health referrals by the department rose 191% over ten years, from 171 in 2015 to 497 in 2024, reflecting a deliberate move toward non-enforcement intervention on calls that don't require a law enforcement response.
Whether you're considering a neighborhood near the CWU campus, eyeing a house in West Ellensburg or Ridgeview, or trying to calibrate risk before deciding on an area, the sections below break down Ellensburg's crime data in context, explain what the numbers mean neighborhood by neighborhood, call out the honest concerns the police department itself flags, and give you practical guidance for researching safety on the ground.

Ellensburg Crime by the Numbers: Violent vs. Property Crime
The single most important distinction in Ellensburg's safety profile is the gap between its violent crime rate and its property crime rate — because they tell very different stories.
Violent Crime: Below the Bar
Ellensburg's violent crime rate of 2 per 1,000 residents (FBI 2024 NIBRS data, released October 2025) sits notably below Washington state's own 2024 rate of approximately 3.29 per 1,000. For a college town that regularly fills up for rodeo weekend and Eburg events, that's a meaningful result.
Domestic offenses — one of the more telling indicators of a community's baseline stress level — dropped 15% in 2024 to 176 incidents, down from 206 the prior year. Juvenile crime arrests fell 20%, from 92 to 74. Neither figure signals a community in crisis.
Property Crime: The Real Conversation
Property crime at 21 per 1,000 residents is where Ellensburg earns its asterisk. The national average sits around 20 per 1,000, so Ellensburg is above it — not dramatically, but honestly above it. Larceny and theft are the dominant category, which in a university town with high foot traffic in commercial areas is a familiar pattern. The 2024 correction was substantial: property crimes fell 20% year over year, and motor vehicle theft specifically dropped from 48 incidents in 2023 to just 14 in 2024 — a 70% reduction in a single year.
| Crime Category | Ellensburg (per 1,000) | WA State (per 1,000) | 2024 Trend |
|---|---|---|---|
| Violent Crime | 2.0 | ~3.29 | ↓ (improving) |
| Property Crime | 21.0 | ~varies by city | ↓ 20% year-over-year |
| Motor Vehicle Theft | Included in property | — | ↓ 70% (48 → 14 incidents) |
| Domestic Offenses | 176 total incidents | — | ↓ 15% (206 → 176) |
| Juvenile Crime Arrests | 74 total arrests | — | ↓ 20% (92 → 74) |
| Overall Crime Rate | Lowest since NIBRS reporting began | ↓ 14.1% statewide | ↓ 11% year-over-year |
The statewide context matters here: Washington's overall crime rate also dropped 14.1% between 2023 and 2024, outpacing the national average decline of 8.4%. Ellensburg's improvement tracks — and in several categories exceeds — the broader positive state trend.
Neighborhood Safety Patterns: What the Data Can and Can't Tell You
No public source produces neighborhood-level crime statistics tied to Ellensburg's specific named areas — not the police department's public reports, not aggregator heat maps. What does exist is a reliable general pattern based on land use, foot traffic, and the type of activity that concentrates in commercial versus residential zones. Use this as directional context, not hard data, and check the neighborhood guide for a fuller character breakdown of each area.
Downtown Ellensburg and the University District: Higher Activity, Higher Exposure
Historic Downtown Ellensburg and the blocks surrounding Central Washington University generate the most foot traffic in the city, and that concentration correlates with higher incidence of the property crimes — theft, vehicle break-ins, opportunistic larceny — that drive Ellensburg's property crime rate. The downtown restaurant corridor and the blocks between campus and Pearl Street see the most commercial activity, which means more targets and more people who aren't local regulars.
The gang-related homicide the Ellensburg Police Department flagged in its 2024 Annual Report occurred at a downtown establishment in March 2024. The department explicitly noted that locally based gangs should not be dismissed as a concern. That's a sober acknowledgment from the department itself, and it's worth taking seriously — even as the overall violent crime rate remains below state and national benchmarks.
Residential Areas: Northridge, West Ellensburg, Ridgeview, Craig's Hill
The residential neighborhoods away from downtown and campus — Northridge to the north, West Ellensburg toward the hills, Ridgeview and Craig's Hill on the southern and elevated edges of the city — follow the quieter pattern typical of low-density residential areas in small Washington cities. No neighborhood-specific crime rate can be quoted here, but these areas have minimal commercial activity, lower foot traffic from non-residents, and the general character of established single-family neighborhoods.
South Ellensburg and Radio Hill sit at the city's edges with similar low-traffic residential profiles. Radio Hill, elevated above the valley floor, is particularly removed from the activity patterns that generate downtown's property crime numbers.
University District: The Student Variable
The blocks immediately adjacent to the CWU campus behave like most university-adjacent neighborhoods — turnover is high, a transient student population cycles through, and rental properties cluster here. Petty theft and vehicle-related property crime are the predominant risk categories. The area isn't unsafe in any absolute sense, but it carries the familiar rhythms of a college neighborhood: quieter summers, more activity from September through May.
How Ellensburg Compares to Nearby Cities
Benchmarking Ellensburg against its nearest neighbors gives you a more honest frame than comparing it to Seattle or Spokane, which operate at a completely different scale.
| City | Violent Crime (per 1,000) | Property Crime (per 1,000) | Context |
|---|---|---|---|
| Ellensburg | 2.0 | 21.0 | Regional hub, university town |
| Washington State Avg. | ~3.29 | — | State-level benchmark (FBI 2024) |
| Cle Elum | Small sample — rates vary widely | Small-sample context | Much smaller; tourism-driven |
| Kittitas (town) | Very small sample | Very small sample | Rural, minimal commercial activity |
| Yakima | Notably higher | Notably higher | Larger regional city; different risk profile |
| Thorp / Vantage | Unincorporated / minimal data | Rural character | Not comparable by size |
The most useful comparison for most relocating residents is Ellensburg versus Yakima, since many people considering a move here weigh the two cities. Yakima runs noticeably higher on both violent and property crime rates — Ellensburg's figures look meaningfully safer in that regional context, not just against an abstract national average.
Cle Elum and the smaller Kittitas County communities are too small to produce statistically stable per-1,000 crime rates; a single incident in Cle Elum swings the rate dramatically. The honest comparison for Ellensburg is against the state average and against Yakima, where the data is robust enough to be meaningful.
Looking to buy in Ellensburg? Estimate your payment.
Enter your numbers to see an estimated monthly mortgage payment.
Estimate only. Excludes HOA fees and mortgage insurance. The interest rate above is a starting point, not a quoted rate — replace it with your own to see real numbers. Insurance is a flat placeholder, not a Ellensburg quote.
What the Police Department Is Actually Doing — and What to Watch
The Ellensburg Police Department's recent trajectory is worth examining because it explains why the 2024 numbers improved, not just that they did.
Precision Policing Since 2022
The department shifted to a Precision Policing strategy in 2022 — an evidence-based model that identifies specific patterns, locations, and behavioral drivers of crime rather than deploying resources reactively. By 2024, the department's own data showed a 28% overall crime reduction since that shift began. That's a three-year trend, not a single good year.
Community-Based Programs
The EPD runs a Citizen's Academy that lets residents understand how policing decisions are made — a transparency measure that also builds community relationships. National Night Out events create consistent informal contact between officers and neighborhoods. In November 2024, the department adopted the Handle With Care program, connecting first responders directly with local schools to flag when a child has experienced a traumatic event at home, so teachers can respond appropriately the next day. The program is already expanding to surrounding Kittitas County communities.
Mental health referrals by the department rose from 171 in 2015 to 497 in 2024 — a 191% increase that reflects a deliberate strategic choice to route non-criminal crises away from enforcement responses. That matters for property crime too: many theft incidents in university towns are connected to untreated substance use and mental health crises, and diverting those calls to appropriate services addresses root causes rather than cycling people through the jail system.
The Gang Acknowledgment
The department's 2024 Annual Report is direct about gang activity in a way that many small-city police departments avoid. The March 2024 gang-related homicide at a downtown establishment is cited explicitly, and the report warns that locally based gangs should not be dismissed. This is honest communication, and it's useful information for anyone researching the city. It doesn't change the overall violent crime rate — which remains below state and national benchmarks — but it does give context for where the violent incidents that do occur tend to cluster and why.
People who move here from genuinely low-crime rural communities sometimes experience a small shock after six months: Ellensburg is a regional hub, not a purely residential suburb, and it carries the ambient complexity that comes with that role. The downtown scene on weekend nights around the rodeo grounds feels different from what the per-1,000 figures suggest in the abstract.
Practical Safety Research Before You Choose a Neighborhood
The data gives you a framework. Ground-level research gives you the texture that data can't.
Use an Online Crime Heat Map
Several online crime mapping tools maintain visual heat maps of Ellensburg that show relative crime intensity by location — they don't produce named-neighborhood statistics, but dragging the map over a specific block you're considering gives you a rough visual read on whether you're in a higher-activity zone. It's a useful first filter before visiting in person.
Check the Ellensburg PD's Public Reports
The Ellensburg Police Department publishes its Annual Report and Crime Report Presentation publicly at ellensburgwa.gov. The 2024 Crime Report Presentation, released September 2025, is the most detailed public breakdown available. Reading it directly — rather than relying on aggregator summaries — gives you the incident-level detail that per-1,000 rates flatten out.
The Timing Question: When to Visit
If you're considering a neighborhood decision and want to assess it in person, the Ellensburg Rodeo weekend in early September is the single most useful time to observe downtown's crowd management and police presence — and also the single worst time to judge what daily life in the city actually looks like. Visit once during rodeo week and once during a regular November weekend. The gap between those two observations is informative.
What to Ask About Specific Blocks
For streets immediately adjacent to the CWU campus — particularly the rental-heavy blocks between the campus edge and the downtown core — ask specifically about vehicle break-ins and package theft when talking to current residents. Those are the categories most likely to affect daily life in that zone, and they're the incidents least likely to show up prominently in aggregate statistics.
One thing many people don't do before deciding on a neighborhood: pull up the city's public incident reports for the specific block, not just the city-wide rate. The Ellensburg Police Department's public reporting gives enough detail in its crime report presentations to identify which parts of downtown generate the highest call volumes versus which residential areas are essentially quiet.
The Residential Neighborhoods on the Quieter End
If low foot traffic and distance from commercial activity are the priority — for families with school-age children, for people coming from quieter communities — the areas to focus on are Northridge, Craig's Hill, Ridgeview, and West Ellensburg. None of these carry neighborhood-specific crime rates in public sources, but their land-use character (established single-family residential, minimal through traffic, limited commercial nodes) aligns with the lowest-risk profile available in the city. For a broader read on what makes each of these areas distinct day to day, see the full neighborhood guide.
Local Expert Takeaway: Ellensburg's violent crime rate is genuinely below state and national averages — that's not spin, it's the FBI 2024 NIBRS data. The honest caveat is property crime, especially in the blocks surrounding Historic Downtown Ellensburg and the CWU campus, where larceny and opportunistic theft run at the levels you'd expect from any small city functioning as a regional hub. The 2024 numbers moved in the right direction across every major category, and the Precision Policing strategy the department adopted in 2022 appears to be producing durable results — a 28% overall reduction over three years is a real trend. If you're researching a specific block near campus or downtown, pull up an online crime heat map and read the Ellensburg PD's 2024 Annual Report from ellensburgwa.gov before you decide on a neighborhood. The residential areas on the city's edges — Northridge, Ridgeview, Craig's Hill, West Ellensburg — have a meaningfully different day-to-day feel from the downtown and university corridors.
Quick Takeaways & FAQs
✅ Ellensburg's violent crime rate of 2 per 1,000 residents is below both the Washington state average (~3.29 per 1,000) and the national average, based on FBI 2024 NIBRS data.
⚠️ Property crime at 21 per 1,000 residents is above the national average and concentrated near downtown and the CWU campus — the Ellensburg PD also explicitly flagged gang activity, including a gang-related homicide in March 2024, in its 2024 Annual Report.
📍 The Ellensburg Police Department publishes its full crime data and Annual Report at ellensburgwa.gov — the 2024 Crime Report Presentation is the most detailed public breakdown and is worth reading directly before deciding on a neighborhood.
Is Ellensburg, WA a safe place to live?
What is the crime rate in Ellensburg, Washington?
Which neighborhoods in Ellensburg are the safest?
How does Ellensburg's crime rate compare to Yakima?
Is the area near Central Washington University safe?
Moving to Washington?
Tell us what you need help with and we'll connect you with local resources.
