
Most people searching Aberdeen's crime statistics walk away with the wrong takeaway. They see a number, compare it to the national average, and either panic or shrug — without realizing that a small port city where commercial corridors and waterfront zones concentrate foot traffic will always look worse on a per-resident basis than the lived reality for most people actually sleeping here. Aberdeen, sitting at the confluence of the Chehalis and Wishkah rivers on Washington's Olympic Peninsula, is a working-class timber and shipping city where economic pressure is real and visible. That context matters when you read the numbers.
The honest picture is layered. Aberdeen's violent crime rate — 4 per 1,000 residents, based on 2024 FBI data — sits only marginally above the national average. Property crime at 30 per 1,000 residents is the category that drives the city's overall elevated rate, and that figure is shaped heavily by activity in commercial zones, not residential blocks. Meanwhile, the city's 2025 crime index of 229 is essentially identical to the U.S. average of 228.4 — a convergence that reflects real, sustained improvement over recent years. Aberdeen is not the city its reputation sometimes suggests, but it is also not without genuine challenges that a newcomer should understand before choosing a block.
What the city-wide number doesn't tell you is how sharply safety varies by neighborhood. The difference between the north side of the city and the quieter east-side residential areas is not marginal — it's the difference between Aberdeen's most incident-heavy corridor and its most peaceful streets. Where you land in this city matters far more than any single aggregate statistic. The sections below break down Aberdeen's crime data by neighborhood, explain what's driving the numbers, examine the trend line, and give you a clear-eyed view of how to evaluate specific areas before deciding where to put down roots.

Aberdeen Crime at a Glance: The Numbers in Context
The Headline Figures
Aberdeen's violent crime rate is 4 per 1,000 residents and its property crime rate is 30 per 1,000 residents, both drawn from 2024 FBI UCR data. AreaVibes calculates the violent crime figure at 1.03 times the national average — essentially indistinguishable from the national baseline. Property crime is a different story: that same analysis puts it at 1.69 times the national average, which is where Aberdeen's overall rate gets its elevation.
Zero homicides were recorded in the most recent reporting year. That fact belongs at the top of any honest conversation about this city.
| Crime Category | Aberdeen (per 1,000) | vs. National Average | Primary Driver? |
|---|---|---|---|
| Violent Crime | 4 | 1.03× national | No |
| Property Crime | 30 | 1.69× national | Yes |
| Homicide (latest year) | 0 | Below national | No |
| Overall Crime Index (2025) | 229 | ≈ U.S. avg (228.4) | — |
| 5-Year Violent Crime Total | 1,728 incidents | 2019–2024 period | — |
| 5-Year Property Crime Total | 3,288 incidents | 2019–2024 period | — |
The Washington State Comparison
Within Washington state, more than 89% of communities have a lower crime rate than Aberdeen — that figure comes from NeighborhoodScout's analysis of 2024 FBI data. Aberdeen's numbers sit in the upper tier for the state even as the gap to the national average has narrowed considerably.
That state comparison sounds alarming until you factor in what Aberdeen is: a small port and timber city of roughly 17,000 residents where high-traffic commercial and waterfront zones are woven directly into residential areas. Crimes in those corridors are counted against Aberdeen's population, not against the thousands of visitors, workers, and port users who generate much of the activity. The per-resident rate overstates the risk for someone living in a quiet residential block east of downtown.
What's Actually Driving the Crime Rate
Property Crime Is the Story
Shoplifting, vehicle break-ins, and theft from commercial areas are the categories that push Aberdeen's overall rate above the national norm. This is consistent with the pattern in small port cities with economic stress — Grays Harbor County has faced sustained unemployment pressure for decades as the timber industry contracted, and that pressure shows up in property crime statistics more than in violent crime.
Nextdoor community discussions in Aberdeen reflect this texture: residents flag drug activity, graffiti, and occasional incidents near the downtown commercial corridor, alongside frequent notes of police visibility in those same areas. It is a familiar picture for any small Pacific Northwest city anchored to resource extraction.
The Density Artifact
Crime analysts have noted something specific about Aberdeen's per-capita figures: crimes in high-traffic commercial and waterfront zones are measured against a residential population that doesn't actually spend much time there. Billy's on E Heron St and Breakwater Seafoods & Chowder House on S F St draw people from across Grays Harbor County — the incidents that happen near those commercial corridors inflate Aberdeen's resident-denominator statistics without reflecting what a resident on a quiet South Aberdeen side street experiences day to day.
This doesn't make the incidents less real. It does mean that reading the city-wide rate as a uniform risk prediction for every address in Aberdeen is a mistake most data tools make.
Zero Homicides
In the most recent reporting year, Aberdeen recorded zero homicides. For a city that sometimes carries a rough reputation, that is a significant data point — and one that almost never leads coverage of the city's crime statistics.
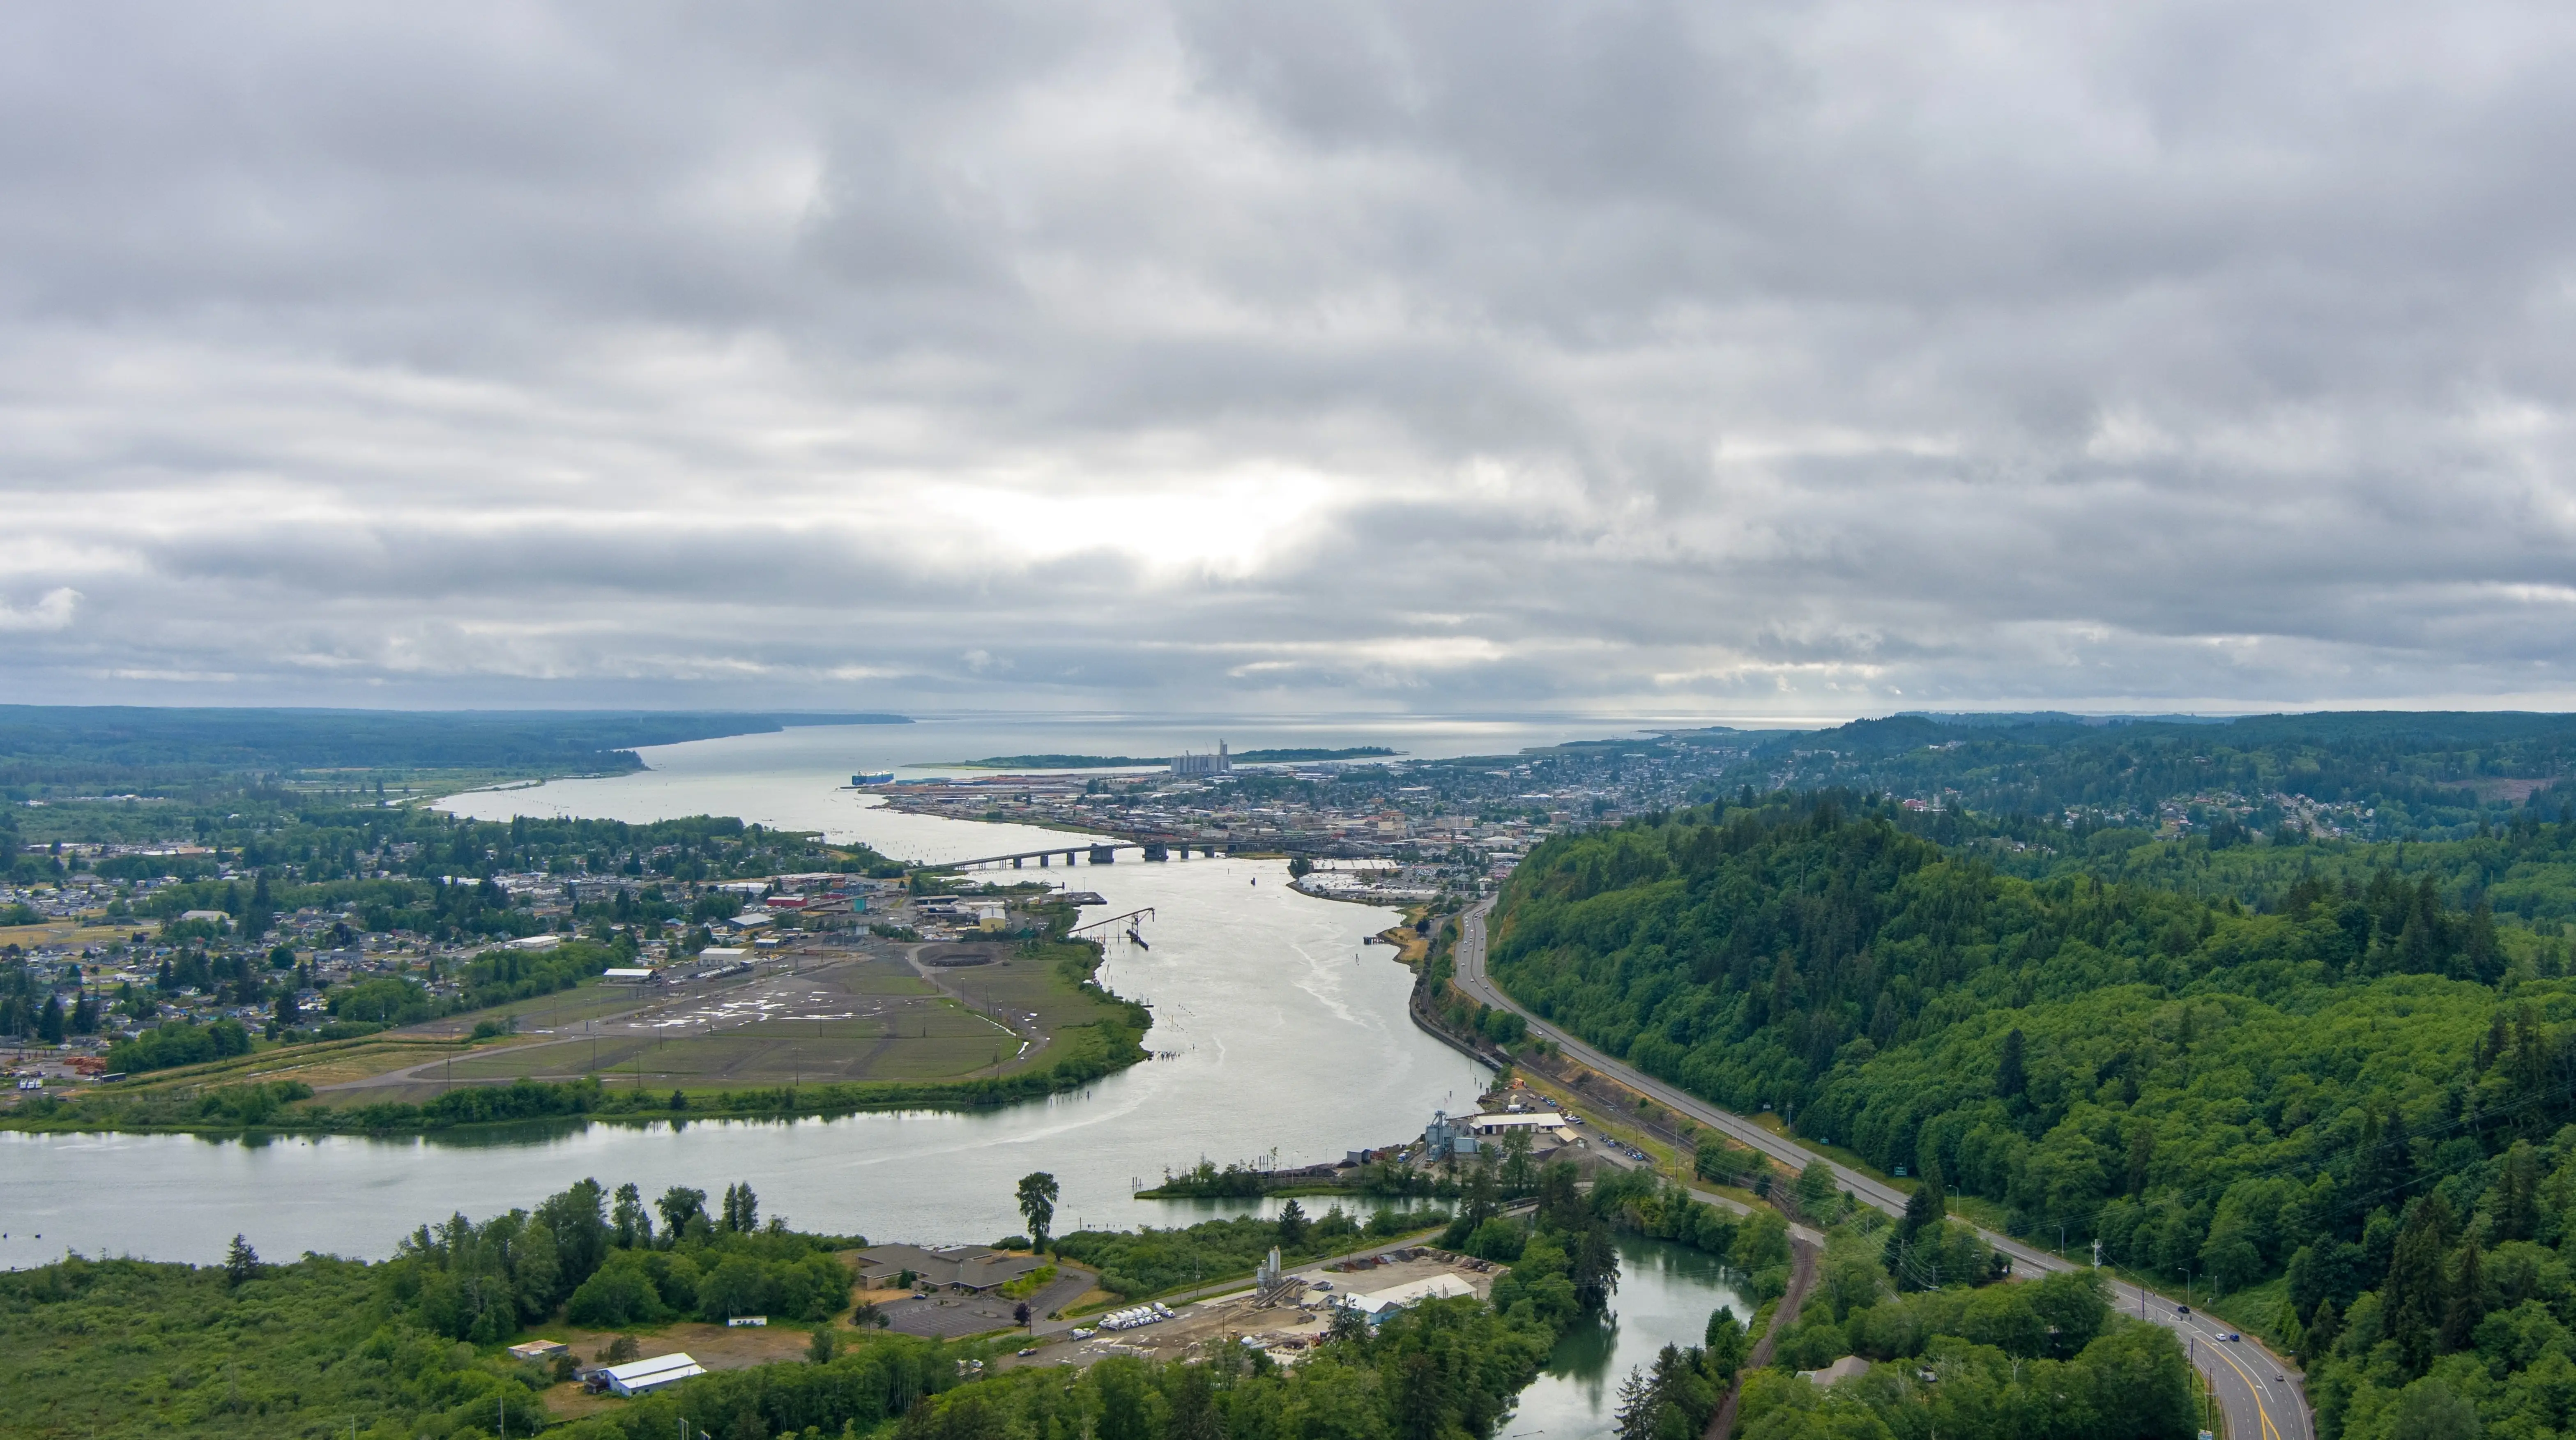
Neighborhood Safety in Aberdeen: Where the Differences Are Real
The aggregate numbers mask a variation that is sharp enough to meaningfully change your daily experience. CrimeGrade data show the north part of the city accounting for roughly 283 total crime incidents per year — the highest count in the city — while the east side records approximately 32, the fewest citywide. That is not a rounding difference.
| Neighborhood / Area | Safety Profile | Best For | Notes |
|---|---|---|---|
| East Aberdeen / Bel-Aire / Pinewild | Lowest crime count citywide; CrimeGrade violent crime odds as favorable as 1-in-255 | Families Quiet | Residents broadly consider this the city's safest corridor; more residential density, less commercial traffic |
| South Aberdeen | Residents on Nextdoor describe peaceful, quiet streets; family-friendly character | Families Nature | Dog-friendly parks and tree cover; lower commercial foot traffic than downtown |
| Paradise Harbor | Quieter residential; waterfront adjacency adds some transient foot traffic | Views Quiet | Character varies block by block near the harbor edge |
| North Aberdeen | Highest total incident count citywide (~283/year); concentrated commercial activity | Commuter | Incidents cluster near commercial corridors; not uniformly unsafe but warrants block-level research |
| Downtown | Central commercial zone; violent crime victimization odds as low as 1-in-78 in the densest blocks | Walkable | Proximity to Kurt Cobain Memorial Park and the waterfront brings foot traffic; incidents follow the crowds |
| Central Park | Transitional; shares boundary character with Cosmopolis | Value | Lower density buffers some of the commercial-corridor effect |
For a deeper look at what each of these neighborhoods is actually like to live in day-to-day, the Aberdeen neighborhoods guide covers character, feel, and layout in full.
What Locals Know About Block-Level Variation
The east side — East Aberdeen, Bel-Aire, and Pinewild — is where longtime Aberdeen residents point when someone asks about quieter streets. These are areas with more single-family housing density, less commercial foot traffic, and a separation from the downtown corridor that makes a measurable difference in incident counts.
South Aberdeen earns consistent mentions on Nextdoor for its quiet residential character. If you are relocating with school-age children and weighing different parts of the city, the contrast between South or East Aberdeen and the blocks immediately adjacent to the downtown commercial corridor is worth taking seriously before you settle on a specific street.
Looking to buy in Aberdeen? Estimate your payment.
Enter your numbers to see an estimated monthly mortgage payment.
Estimate only. Excludes HOA fees and mortgage insurance. The interest rate above is a starting point, not a quoted rate — replace it with your own to see real numbers. Insurance is a flat placeholder, not a Aberdeen quote.
The Trend Line: Is Aberdeen Getting Safer?
Year-Over-Year Improvement
Violent crime declined 14% year-over-year in the most recent reporting period. Property crime dropped 9% over the same span. Both figures come from AreaVibes' analysis of 2024 FBI UCR data.
That is not a one-year blip. The five-year arc from 2019 through 2024 shows sustained downward movement in both categories, and the convergence of Aberdeen's 2025 crime index (229) with the U.S. average (228.4) reflects that trajectory arriving somewhere meaningful. The city is closer to the national norm than it has been in years.
Police Coverage
Aberdeen fields 49 full-time law enforcement employees, including 34 sworn officers. That works out to 2.9 officers per 1,000 residents — approximately 33% above the Washington state average. For a city of roughly 17,000 people, that is a meaningful level of coverage, and it shows up in the Nextdoor community notes that reference frequent police presence in the areas where residents flag concerns.
Higher officer ratios don't automatically produce lower crime, but they do reflect a city that is actively deploying resources rather than treating the issue as intractable. The downward trend in both crime categories over five years suggests those resources are having some effect.
What Could Reverse the Trend
Aberdeen's improvement is real but fragile in the way that improvement in any economically stressed small city tends to be. Grays Harbor County's economic base — timber, port logistics, cranberry processing — is subject to industry-level pressures that create the underlying conditions for property crime in the first place. A sustained improvement in the local economy would do more for Aberdeen's safety profile than any policing strategy alone. That is the honest caveat behind an otherwise encouraging trend line.
Practical Safety Research for Anyone Considering Aberdeen
Don't Stop at the City-Wide Rate
The single most useful thing you can do before deciding on a neighborhood in Aberdeen is look at block-level data, not city-wide aggregates. The gap between roughly 32 annual incidents on the east side and 283 on the north side is too large to ignore. Tools like CrimeGrade.org and NeighborhoodScout allow you to zoom in to specific corridors rather than accepting a city-wide number as your guide.
Drive the neighborhood at different times of day. Aberdeen is small enough that you can cover meaningful ground in an afternoon. The difference between a block near the downtown commercial strip and a residential street in Bel-Aire or South Aberdeen is immediately apparent in ways that no crime map fully captures.
What Surprises People After Six Months
People who move to Aberdeen from larger cities often arrive expecting the crime statistics to translate into a constant sense of threat. What many discover instead is that the incidents are concentrated — near downtown, near the Chehalis River corridor, near the commercial zones along E Wishkah St — and that residential blocks in quieter parts of the city feel genuinely calm. The surprise cuts both ways: some newcomers are relieved; others who settled near the commercial corridor without doing block-level research are not.
The other thing people don't expect is how visible Aberdeen's social challenges are in certain pockets. Drug activity near some downtown blocks and occasional graffiti along certain corridors are real. They are not hidden. If you are sensitive to visible signs of urban poverty, some parts of Aberdeen will feel difficult in a way the numbers don't fully prepare you for.
A Practical Checklist Before Choosing a Block
- Run the specific address through CrimeGrade.org and note whether it falls in the east-side corridor or closer to the downtown commercial zone.
- Check Nextdoor for the specific neighborhood — Aberdeen residents are active there and post about local concerns in real time.
- Visit Sam Benn Memorial Park and the streets around it in South Aberdeen to get a feel for what the quieter residential parts of the city actually look like on the ground.
- Note proximity to E Wishkah St and the downtown commercial corridor — blocks that are walkable to downtown tend to absorb more of the commercial-zone incident pattern.
- Look at the time-of-day pattern if your crime tool allows it — most property crime in Aberdeen clusters during commercial hours and near retail, not in late-night residential settings.

Local Expert Takeaway: Aberdeen's crime numbers look more alarming in aggregate than they do on the ground in the right neighborhood. Property crime — not violent crime — drives the city's elevated rate, and it clusters heavily around the downtown commercial corridor and the north side, not across the entire city uniformly. East Aberdeen, Bel-Aire, and South Aberdeen consistently show up as the quietest parts of the city in both data and resident accounts. The trend line is genuinely improving: violent crime down 14% and property crime down 9% in the most recent reporting period, with a 2025 crime index that has converged with the national average. If you are researching Aberdeen, the real question is not 'is the city safe' — it is which specific blocks you are considering, and whether those blocks are in the residential east and south or in the higher-traffic commercial corridors. That block-level distinction will tell you more than any city-wide statistic.
Quick Takeaways & FAQs
✅ Aberdeen recorded zero homicides in the most recent reporting year and has seen violent crime fall 14% year-over-year — a meaningful improvement that rarely leads coverage of the city.
⚠️ Property crime at 30 per 1,000 residents is the real concern, and it concentrates heavily in downtown commercial corridors — the east and south residential neighborhoods show dramatically lower incident counts.
📍 Aberdeen's police force of 34 sworn officers represents 2.9 officers per 1,000 residents, roughly 33% above the Washington state average — one reason frequent police presence is a recurring note in local Nextdoor discussions.
Is Aberdeen, WA a safe place to live?
What is the violent crime rate in Aberdeen, WA?
Which neighborhoods in Aberdeen, WA are the safest?
How does Aberdeen's crime rate compare to the rest of Washington state?
Is property crime or violent crime the bigger concern in Aberdeen?
Moving to Washington?
Tell us what you need help with and we'll connect you with local resources.
