Maybe you've already looked at the numbers and Frisco came out near the top. Maybe someone told you it's one of the safest cities in the country and you want to understand what that actually means before you choose a neighborhood. The short answer is: the headline is real. With a violent crime rate of 1 per 1,000 residents — a fraction of both the Texas state average and the national figure — Frisco, Texas sits among the genuinely safest large cities in America, not just the safest in the Dallas-Fort Worth Metroplex. That ranking holds up across multiple independent methodologies, which is the more meaningful test.
Context matters here. Frisco is a city of 236,955 people — the 14th-largest incorporated city in Texas — and it has grown at a pace that would stress the public safety infrastructure of almost any municipality. Most fast-growing cities see crime drift upward as infrastructure lags population. Frisco's total crime rate has moved in the opposite direction over the past several years, even as neighborhoods and commercial corridors have continued to expand. The Frisco Police Department, the school district, and city government have invested seriously in both technology and community programs to keep pace with growth, and the results show in the data.
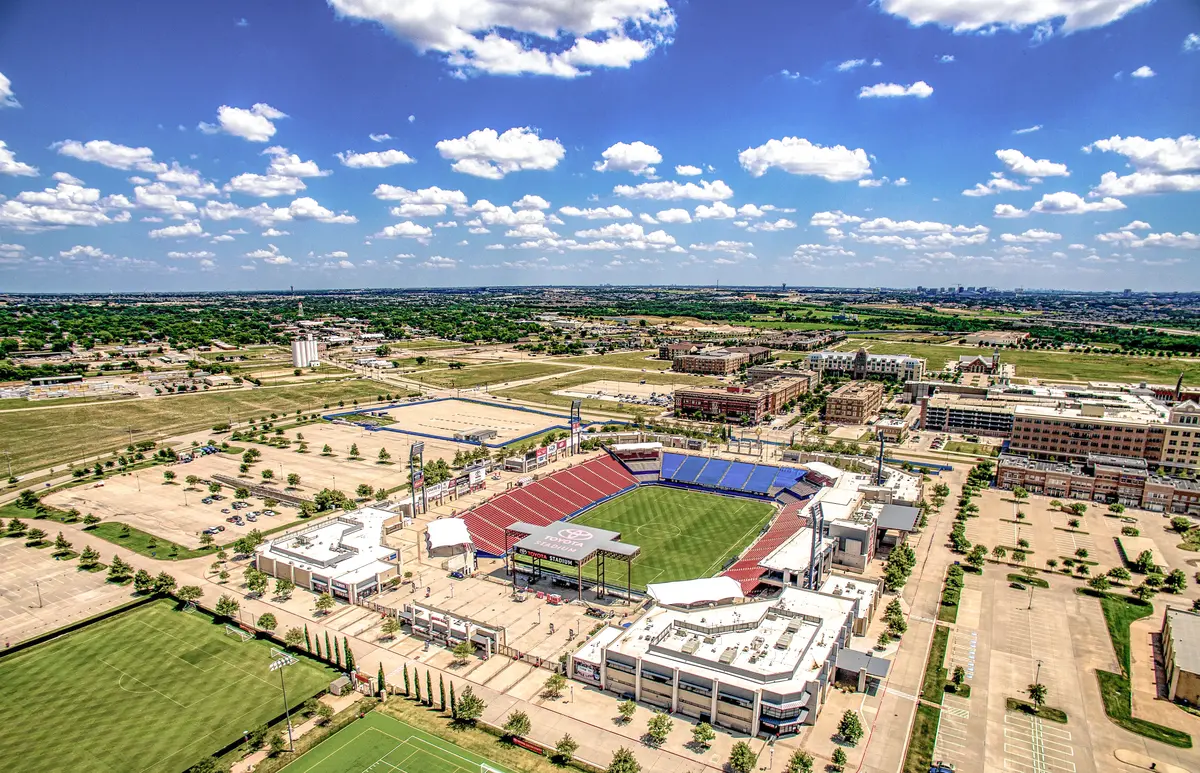
There are honest nuances worth understanding before you decide on a neighborhood. Crime is not spread evenly across the city. Frisco's southern corridor — where the retail density is highest, where Stonebriar Centre sits, and where visitor traffic from The Star and Toyota Stadium concentrates — accounts for a disproportionate share of property crime incidents. That pattern doesn't make the south unsafe to live in; it reflects the reality that crime tends to follow foot traffic rather than residents. Understanding where that commercial activity concentrates, and what it means for specific neighborhoods, is the most useful thing a relocating buyer can do with this data.
The sections below break down Frisco's crime figures against state and national benchmarks, explain the geographic distribution of incidents across the city, cover the technology and community programs the police department runs, and give you a practical framework for reading safety data before you settle on a part of the city.
How Frisco's Crime Rates Compare to Texas and the Nation
Frisco carries a violent crime rate of 1 per 1,000 residents. The Texas state average is 4 per 1,000 and the national average is 3.7 per 1,000 — meaning Frisco's rate is roughly one-quarter of both benchmarks. That gap is not a rounding artifact; it reflects a city that has consistently maintained public safety investment through its most aggressive growth period.
Property crime tells a similar story. Frisco has a property crime rate of 10 per 1,000 residents, against a state rate of 20.7 per 1,000 and a national rate of 18.4 per 1,000. In both categories, Frisco sits well below the averages a typical American city posts.
This page shows a full comparison table from this data just below this section — that table is the clearest single view of where Frisco lands relative to Texas and the country. What the table can't capture is the trend: the Frisco Police Department's own Uniform Crime Report history shows the city's total crime rate declining from 14.4 per 1,000 in 2022 to 9.9 per 1,000 in 2024, a meaningful drop over a period when the population kept rising. Crime falling as a city grows is not common, and it's worth flagging as a signal about both policy and execution.
Third-party rankers have noticed. MoneyGeek placed Frisco second safest city in America for 2025 among cities with populations over 100,000, estimating the per-resident societal cost of crime at $287 — a fraction of the national figure of $2,178. SmartAsset's separate 2025 analysis of 360 suburbs near major metro areas ranked Frisco 10th safest in the country, using a methodology that weighs violent crime, property crime, and drug overdose death rates together. Different methodologies produce different rank orderings, and some rankers that weigh Frisco's large retail footprint more heavily produce more moderate scores — but consistent placement near the top of multiple independent lists is a more reliable signal than any single ranking.
A November 2024 National Community Survey commissioned by the city found that nine out of ten residents gave Frisco excellent or good marks for quality of life, and that the city's overall feeling of safety outranked more than 500 comparison communities covering more than 50 million residents. Resident perception and statistical data are pointing in the same direction, which rarely happens by accident.
Where Crime Actually Concentrates: The Geographic Reality
Frisco's low city-wide rates can obscure an important internal pattern: crime is not evenly distributed, and the southern part of the city accounts for the highest incident counts. This is worth understanding before you pick a neighborhood — not because the south is dangerous, but because reading a heat map without context can send you in the wrong direction.
The southern corridor is where Frisco's retail density peaks. Stonebriar Centre, The Star (the Dallas Cowboys headquarters and entertainment complex), and Toyota Stadium all sit in or near the southern part of the city, drawing substantial visitor traffic on nights and weekends. Crime-mapping research consistently finds that incidents concentrate where people congregate — theft, vehicle break-ins, and opportunistic property crimes follow foot traffic, not residents. A neighborhood that appears darker on a crime heat map because it's adjacent to a major shopping center is not the same as a neighborhood with a resident-safety problem.
The neighborhood-level picture is broadly reassuring. Residential areas away from the commercial corridors — the northern and western subdivisions — see relatively few incidents by comparison, while the southern commercial zones register higher counts that largely reflect retail and event activity. That internal pattern is consistent across years of the Frisco Police Department's published data and is not a reflection of any particular neighborhood becoming less safe.
The canonical neighborhoods on the north and west side of the city — Phillips Creek Ranch, Heritage Lakes, and Newman Village — sit away from the highest commercial traffic corridors and tend to reflect the quieter residential end of Frisco's safety profile. Stonebriar and Starwood are well-established neighborhoods close to or south of the Sam Rayburn Tollway, in an area with more retail activity nearby, but both have long track records as stable, sought-after communities. The Grove Frisco, Fields, and Hollyhock are newer master-planned developments where the infrastructure and community design are purpose-built with safety in mind. For a deeper look at which of these areas fits your priorities, the best neighborhoods guide covers the character of each in detail.
The practical takeaway: if you're using a crime map to compare areas within Frisco, filter by incident type and look for patterns in residential zones rather than commercial corridors. Auto theft and package theft near retail clusters are different risk categories than the violent crime or burglary patterns that should actually influence where you choose to live.

The Technology Behind Frisco's Safety Infrastructure
Frisco has invested in public safety technology at a scale that sets it apart from most cities of comparable size. The Frisco Police Department operates a platform called SAFER — Situational Awareness for Emergency Response — which functions as a citywide public-safety command system, integrating more than 30 separate systems and 240 GIS data layers. That includes live school camera feeds, real-time 9-1-1 caller locations, and traffic conditions, all shared across police, fire, and transportation departments simultaneously.
The SAFER platform has earned national recognition, including the URISA ESIG Enterprise System Award in 2024, the Esri Innovations in GIS Award in 2023, and the Smart Cities Smart50 Award in 2022. Awards from industry bodies don't directly make a city safer, but they do reflect a level of institutional investment and operational sophistication that a growing city with Frisco's profile would be unlikely to sustain accidentally.
In September 2025, the Frisco City Council approved a $427,500 grant to establish a Drone as a First Responder program for the police department, funded through the Northern Collin/Denton County Auto Theft Task Force. The drones integrate with the city's license plate reader network and can reach emergency scenes in as little as 86 seconds. That response capability matters most in a city where the geography of new development means some neighborhoods are a significant drive from a precinct.
The license plate reader network itself was expanded in late 2025, building on a 2024 agreement with Flock Safety. The cameras are fully funded through the Motor Vehicle Crime Prevention Authority, making the expansion cost-neutral to city residents while adding coverage across corridors that see the highest vehicle traffic. Auto theft and vehicle-related crime — the categories most likely to affect residents in commercial-adjacent neighborhoods — are the primary targets of that system.
None of this technology replaces community-level engagement, and the Frisco Police Department runs that in parallel: a Neighborhood Watch program, a Citizens Police Academy, a Positive Police Interaction class designed specifically for residents with special needs, and the FPD Police Explorers program for youth. These programs are not uncommon in well-resourced suburbs, but the breadth of the list reflects a department that is not coasting on favorable statistics.
Looking to buy in Frisco? Estimate your payment.
Enter your numbers to see an estimated monthly mortgage payment.
Estimate only. Excludes HOA fees and mortgage insurance. The interest rate above is a starting point, not a quoted rate — replace it with your own to see real numbers. Insurance is a flat placeholder, not a Frisco quote.
School Safety and the Frisco ISD Partnership
For families with school-age children, campus safety is often the first safety question — ahead of neighborhood crime rates. Frisco Independent School District, which holds an A rating according to the Texas Education Agency, approaches school security as a shared municipal responsibility rather than an internal administrative function.
Frisco ISD and local police departments jointly fund the staffing of school resource officers across the district. Monthly meetings bring together leadership from the school district, the Frisco Police Department, the Frisco Fire Department, and city traffic engineers to work through active safety issues. That coordination structure — with city traffic engineers at the same table as police and school administrators — reflects how seriously the city treats campus access and the surrounding road environment as part of school safety, not just what happens inside the building.
The SAFER platform integrates live camera feeds from school campuses, meaning that during an incident, responding officers and dispatchers share a real-time view of the scene rather than working from a verbal description. In a district with 62,713 students enrolled in 2025-26, spread across dozens of campuses, that integration is not a trivial capability.
Parents choosing between neighborhoods often ask whether school safety varies by campus. The honest answer is that the district's approach is system-wide rather than campus-specific — the resource officer model, the inter-agency coordination, and the technology integration apply across schools rather than concentrating in particular areas. What does vary is school assignment by address, which is worth checking carefully in a district this large. The schools guide covers the district in more detail, including the active UIL athletics programs and broader academic picture.
What to Check Before You Decide on a Neighborhood
Frisco's city-wide numbers are genuinely favorable, but the most useful safety research happens at the neighborhood level — and a few specific habits will give you a clearer picture than a heat map alone.
Read the Incident Type, Not Just the Count
When you pull a crime map for a specific area, filter by incident category before drawing conclusions. Shoplifting and vehicle break-ins near a retail corridor are a different signal than residential burglary or assault in a quiet subdivision. Frisco's southern commercial zones will always produce higher incident counts by raw number; that says more about where people shop than about where it's safe to live.
Check the Seasonal Pattern
Frisco hosts large events at The Star, Toyota Stadium, and the Omni PGA Frisco Resort throughout the year. Incident counts in the immediate vicinity of those venues spike on event days. If you're evaluating a neighborhood that sits within walking distance of a major venue, pull data that spans a full calendar year rather than a snapshot month — otherwise you may be reading a game-day pattern as a baseline.
Talk to the Neighborhood Watch
The Frisco Police Department's Neighborhood Watch program is active, and individual block captains are typically willing to describe what they actually see — whether that's periodic package theft, traffic concerns at certain intersections, or genuinely nothing worth flagging. No data platform gives you that granularity. If you're seriously considering a specific street or subdivision, this is the most direct route to understanding what day-to-day life looks like there.
Use Multiple Sources, Not One Map
Different crime-mapping services weight Frisco's data differently, partly because the city's large retail footprint inflates raw property crime counts in the south. CrimeGrade.org, AreaVibes, and the Frisco Police Department's own published crime report history each offer a different angle. No single platform is wrong; they're measuring slightly different things. Using two or three together produces a more accurate picture than relying on one.
The safety profile is one piece of the neighborhood decision — character, school zones, and housing stock matter just as much. The best neighborhoods guide covers those dimensions alongside the geographic context that shapes daily life in each part of the city.

Local Expert Takeaway: Frisco's safety numbers are not marketing — they hold up across independent methodologies and the city's own published crime history. The one thing that surprises people after living here a while is how much the south-side commercial corridor skews raw crime counts on mapping apps. Neighborhoods like Phillips Creek Ranch, Heritage Lakes, and Newman Village feel as quiet as the statistics suggest; areas near Stonebriar Centre or The Star post higher raw numbers that largely reflect retail and event traffic rather than resident risk. The Frisco Police Department's SAFER system and the expanding drone and license plate reader programs are genuine investments, not press releases. Nine out of ten residents in a 2024 city survey rated Frisco as excellent or good for quality of life — and the overall feeling of safety metric outranked more than 500 comparison communities. The data and the lived experience are aligned here in a way that is not always the case.
Quick Takeaways & FAQs
✅ Frisco carries a violent crime rate of 1 per 1,000 residents — roughly one-quarter of both the Texas state average and the national average, a gap that holds up across multiple independent safety rankings.
⚠️ Raw crime heat maps can overstate risk in Frisco's southern commercial corridor, where high retail and event traffic inflates incident counts in ways that don't reflect the residential experience nearby.
📍 The Frisco Police Department's SAFER platform integrates over 30 systems including live school camera feeds and real-time 9-1-1 locations — one of the most sophisticated municipal public-safety systems in a DFW suburb of any size.
Is Frisco, TX a safe place to live?
What are the safest neighborhoods in Frisco?
Where does crime concentrate in Frisco?
How does Frisco's property crime rate compare to state and national averages?
What is the Frisco Police Department doing to keep crime low as the city grows?
Moving to Texas?
Tell us what you need help with and we'll connect you with local resources.
