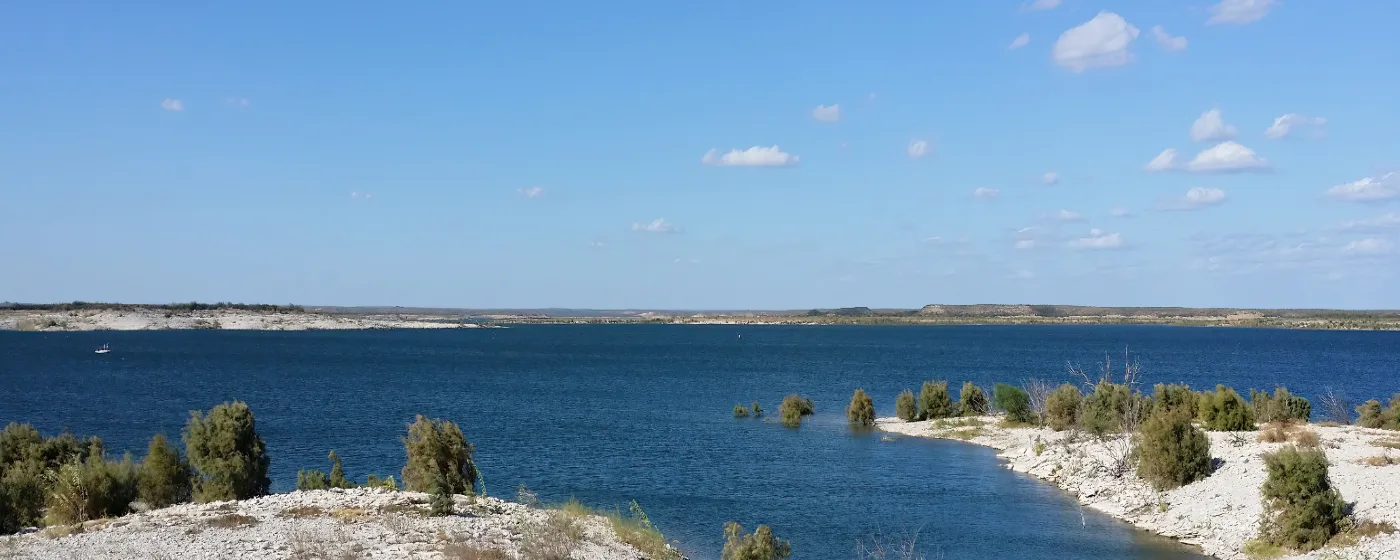
People moving to Del Rio from larger Texas cities often expect the worst and find the opposite. This is a city of 34,496 on the US-Mexico border, anchored by Laughlin Air Force Base, hemmed in by the Rio Grande and Lake Amistad, and shaped by a tight-knit community that has lived and worked here for generations. The border geography alone tends to trigger assumptions about crime that the actual data doesn't support.
The numbers show a violent crime rate of 2 per 1,000 residents — meaningfully below the Texas state figure of 4 per 1,000 and below the national figure of 3.7 per 1,000. A property crime rate of 13 per 1,000 residents tells a similar story, comparing favorably against the state rate of 20.7 per 1,000 and the national rate of 18.4 per 1,000. These aren't close calls — they're consistent gaps that hold up across reporting years.
The overall trend reinforces the picture. Total crime has moved in a downward direction over the past five years, driven primarily by declining property crime. Day-to-day life here — based on what residents actually discuss in community forums — centers far more on flash flooding along the US-90 corridor, road conditions, and loose animals than on personal safety concerns. That gap between perception and reality is worth understanding before you form an opinion about the city.
The sections below break down Del Rio's crime statistics against state and national benchmarks, explain what the numbers look like across individual neighborhoods, unpack why downtown crime maps can be misleading, and give you a practical framework for evaluating safety before you choose where to live.

Del Rio Crime Rates vs. Texas and National Averages
The comparison table below this section lays out the raw numbers. What it can't tell you is why the gaps exist — and context matters as much as the figures themselves.
Del Rio has a violent crime rate of 2 per 1,000 residents — roughly half the Texas state rate of 4 per 1,000, and meaningfully below the national rate of 3.7 per 1,000. That is not a marginal difference. For a border city that carries a reputation shaped more by cable news than by FBI reporting, it consistently surprises people who look it up for the first time.
Property crime follows the same pattern. Del Rio has a property crime rate of 13 per 1,000 residents, noticeably lower than both the Texas state figure of 20.7 per 1,000 and the national figure of 18.4 per 1,000. Both measures come from the same federal reporting series, which is the only way the comparisons are meaningful.
What's Actually Being Reported
When you look at which crimes drive Del Rio's totals, larceny-theft, aggravated assault, and burglary account for the largest share — which is broadly consistent with most small Texas cities of similar size. Property offenses dominate the overall count; violent crime is a relatively small portion of reported incidents.
The multi-year downward trend is worth noting once: total crime has declined over the past five years, with property crime leading that improvement. Violent crime is a smaller and more variable number, so its year-to-year movement gets amplified — a handful of additional incidents can look like a significant percentage swing on a small base. The structural direction, though, has been downward.
The Military Presence Factor
Laughlin Air Force Base sits just east of the city and carries an annual economic impact that exceeds $183 million. Beyond the economics, the base brings a large population of military personnel and their families whose presence tends to correlate, in smaller cities, with stable residential character. That stabilizing dynamic is one reason Del Rio's numbers look different from what the border geography alone might predict.
Neighborhood Safety: Where Del Rio Divides
Crime in Del Rio is not evenly distributed, and understanding the rough geography matters when you're weighing where to live. The pattern is fairly consistent with what you'd find in most small Texas cities: the commercial core generates the highest raw incident counts, while established residential areas on the outskirts see far less activity.
| Neighborhood | Character | Safety Profile | Best For |
|---|---|---|---|
| Lake Ridge Ranch | Newer construction, lakeside adjacency | Among the quieter residential areas in the city | Families Quiet |
| Kelley Ranch | Established subdivision, larger lots | Low incident density, primarily residential | Families Privacy |
| Quail Run | Mid-size residential neighborhood | Quiet, away from the commercial corridors | Families Quiet |
| Ceniza Hills | Elevated terrain, mix of housing | Generally calm; benefits from distance from downtown | Views Quiet |
| North Heights | Older established area north of downtown | Moderate; transitional zone between central and outer areas | First-Time Value |
| San Felipe | Close to San Felipe Springs, mix of ages | Mid-range; higher foot traffic near the springs corridor | Nature Families |
| Buena Vista | Residential, central location | Mixed; proximity to commercial activity creates variability | Value Commuter |
| South Del Rio | Near the international crossing, higher activity | Elevated incident density relative to other areas | Commuter Renter |
The northwest quadrant of the city — which includes neighborhoods like Lake Ridge Ranch and Kelley Ranch — is where residents consistently place the city's quietest residential stretches. The northeast corner reports the fewest incidents of any mapped zone. South Del Rio, given its proximity to the international bridge and the higher volume of cross-border traffic, generates more activity by volume than the city's outer residential areas.
For more on how these neighborhoods compare by housing type and feel, the best neighborhoods in Del Rio guide covers each area in depth.
Why Downtown Crime Maps Look Worse Than They Are
If you've pulled up a crime heat map of Del Rio and found the downtown core lit up red, you're seeing something real — and also something misleading. The central corridor accounts for the highest raw incident counts in the city, but that concentration reflects how crimes get reported, not necessarily where residents face the greatest personal risk.
The Foot Traffic Problem
Downtown Del Rio and the areas around major commercial corridors attract far more daily visitors than the surrounding residential neighborhoods. Retail activity, tourism tied to Amistad National Recreation Area, cross-border commerce, and government services all funnel people through a compact area. When crime-mapping tools calculate a per-resident rate for those zones, they divide incident counts by a residential population that vastly understates the number of people actually moving through the area on any given day.
The result is an inflated per-resident figure that looks alarming on a map but doesn't reflect the experience of someone who lives there. A block with 200 residents but 2,000 daily visitors will always look dangerous on a standard crime map — that's a math problem, not a safety crisis.
What the Downtown Numbers Actually Mean
The downtown commercial corridor sees the highest concentration of incidents citywide, while the northeast residential areas see very few. But the downtown figure includes everything from retail theft in a busy commercial corridor to incidents involving people passing through who don't live in Del Rio at all. The most frequently reported offense type citywide is larceny-theft — the kind of crime that follows foot traffic and commercial density rather than residential character.
None of this means you should ignore heat maps entirely. They're useful for spotting relative patterns within the city. The practical takeaway is to weight the residential areas you're considering against the city's overall rate — Del Rio has a violent crime rate of 2 per 1,000 residents — rather than against the peak of a downtown commercial zone that doesn't represent where most people live.
Looking to buy in Del Rio? Estimate your payment.
Enter your numbers to see an estimated monthly mortgage payment.
Estimate only. Excludes HOA fees and mortgage insurance. The interest rate above is a starting point, not a quoted rate — replace it with your own to see real numbers. Insurance is a flat placeholder, not a Del Rio quote.
Border Geography, Law Enforcement, and What Locals Actually Worry About
Del Rio sits on 109 miles of Rio Grande border in Val Verde County, a jurisdiction covering 3,233 square miles. That geographic scale shapes the law enforcement picture in ways that matter to residents. The Del Rio city core is served by the Del Rio Police Department, while the Val Verde County Sheriff's Office patrols the vast surrounding rural territory — a fundamentally different operational environment from the city itself.
Multiple Layers of Law Enforcement
Beyond local and county agencies, Del Rio has a meaningful state and federal law enforcement presence. The Texas Department of Public Safety Air Patrol Unit operates from Del Rio International Airport, adding a layer of aerial coverage that most similarly sized Texas cities don't have. Laughlin Air Force Base security operates on the installation and maintains coordination with city agencies. The combination produces more law enforcement density per capita than the population of 34,496 alone would typically generate.
The Val Verde County Sheriff's Office launched a public-facing community app in March 2026, making it easier for residents to stay current on local alerts. One active concern worth knowing: the office has issued warnings about phone scams where callers impersonate deputies to solicit personal information or money. The Sheriff's Office will never request payment by phone — if you receive a call like that, it's a scam.
What Residents Actually Talk About
Here is the most useful data point for understanding day-to-day life in Del Rio: community discussions on local platforms are dominated by weather hazards, not crime. Flash flooding is the genuine recurring concern. The US-90 corridor is susceptible to severe storms that can close roads quickly, and the broader semi-arid terrain produces conditions that catch newcomers off guard in ways violent crime simply doesn't.
Loose animals on roadways — a function of the rural-urban edge that runs through parts of the city — come up regularly. Road conditions on county routes outside the city core are another frequent topic. This is the actual texture of safety concerns in Del Rio, and it's a different category of worry than what people who haven't been here tend to assume.
The honest friction point for newcomers: the border location does mean a visible law enforcement and U.S. Border Patrol presence throughout the city. For some people, that presence is reassuring. For others, particularly those moving from cities with different policing dynamics, it takes some adjustment. Most residents who have been here more than six months stop noticing it.
Practical Safety Research Before You Choose a Neighborhood
The aggregate numbers tell a useful story, but they don't tell you everything about a specific block or a specific street. Here's how to research effectively before you decide on a neighborhood.
Start with the City-Level Baseline
Del Rio has a violent crime rate of 2 per 1,000 residents and a property crime rate of 13 per 1,000 residents — those are your anchor figures. Any neighborhood you're evaluating should be understood relative to those figures — not relative to a downtown heat-map peak that reflects commercial foot traffic more than residential risk. The state comparison (4 per 1,000 violent, 20.7 per 1,000 property) gives you additional context: this city runs well below the Texas average on both measures.
Use Multiple Mapping Tools — and Read Them Critically
CrimeGrade.org, AreaVibes, and City-Data each pull from FBI reporting and present the data differently. None of them will tell you about incidents that weren't reported, and all of them will make downtown commercial zones look worse than the residential experience there actually is. Use two or three sources and look for consistent patterns rather than treating any single heat map as definitive.
The northwest residential areas — Lake Ridge Ranch, Kelley Ranch, Quail Run — consistently appear quieter across mapping tools. South Del Rio and areas near the international crossing consistently show more activity. That directional consistency across tools is more meaningful than any single data point from one source.
Talk to People Who Already Live There
The Nextdoor community for Del Rio is active and candid. What you'll find there is a realistic picture of what residents actually experience — which, as noted above, skews heavily toward weather, animals, and road conditions rather than personal safety incidents. That ground-level perspective is worth more than any aggregated crime score for understanding what living in a specific part of the city actually feels like.
The neighborhood guide covers the character of each area in more detail, which pairs well with the safety picture here. The cost of living page has the full picture on what homes and rents look like across the city.
One Thing People Don't Expect After Six Months
Newcomers consistently mention that the sense of community familiarity in Del Rio is more pronounced than they anticipated. This is a small city where people recognize each other, where neighbors know neighbors, and where that social fabric functions as an informal safety layer that doesn't show up in any crime database. It doesn't make Del Rio immune to crime — no city is — but it shapes the texture of daily life in ways that aggregate statistics simply can't capture.

Local Expert Takeaway: Del Rio's crime numbers are genuinely better than its reputation suggests — a violent crime rate of 2 per 1,000 residents puts it well below the Texas average, and the five-year trend has been downward. The real safety geography is about choosing the right part of the city: the northwest residential areas and outer subdivisions like Lake Ridge Ranch and Kelley Ranch are the quietest, while the downtown corridor and South Del Rio generate more incident volume, partly because of commercial and border traffic rather than residential risk. The day-to-day concerns locals actually raise are flash flooding along US-90 and road conditions — not crime. If you're coming from a major Texas metro and bracing for the worst, the data will likely surprise you.
Quick Takeaways & FAQs
✅ Del Rio has a violent crime rate of 2 per 1,000 residents — well below the Texas state average of 4 per 1,000, a consistent gap rather than a one-year anomaly.
⚠️ Downtown crime heat maps overstate residential risk because high volumes of commercial and border-crossing traffic inflate per-resident figures for those zones.
📍 Residents consistently flag flash flooding along the US-90 corridor as their primary safety concern — not violent crime — which tells you something real about daily life here.
Is Del Rio, Texas a safe place to live?
Which part of Del Rio is safest?
How does Del Rio's crime rate compare to the rest of Texas?
Does being a border city make Del Rio more dangerous?
What are the main crime concerns in Del Rio?
Moving to Texas?
Tell us what you need help with and we'll connect you with local resources.
