
Most people researching Prineville already know the outdoor pitch — Ochoco National Forest, the reservoir, the high-desert air. What they don't know until they dig in is that a city of 11,917 people in a rural Oregon county quietly posts some of the lowest crime rates in the state. That's not marketing language. Compared with Oregon's statewide violent crime rate of 3.3 per 1,000 residents and the national figure of 3.7 per 1,000, Prineville carries a violent crime rate of 2 per 1,000 residents — a figure the tourism brochures don't bother to mention.
The context matters here. Prineville sits at the eastern edge of Central Oregon and is a working town — the county seat of Crook County — anchored by Meta's data center, Crook County School District, Les Schwab Tire Centers' corporate office, and county and city government. That employer mix creates a predominantly owner-occupied community with relatively low residential density, which research consistently links to lower overall crime rates. This isn't a city built around a transient economy or high-turnover apartments.
The five-year trend reinforces the picture. FBI 2024 data showed a sharp drop in total incidents compared to the year prior, continuing a longer decline in both violent and property crime. Zero murders and zero robberies were recorded in 2024. Where crimes did occur, they were concentrated in the commercial core — a pattern that tells you more about where retail foot traffic goes than about the safety of the neighborhoods where people actually live.
This guide breaks down what the numbers mean in practice: how Prineville compares to Oregon and national benchmarks, what types of crime actually occur here and where, which neighborhoods residents describe as the calmest, and what to pay attention to when researching a specific area.
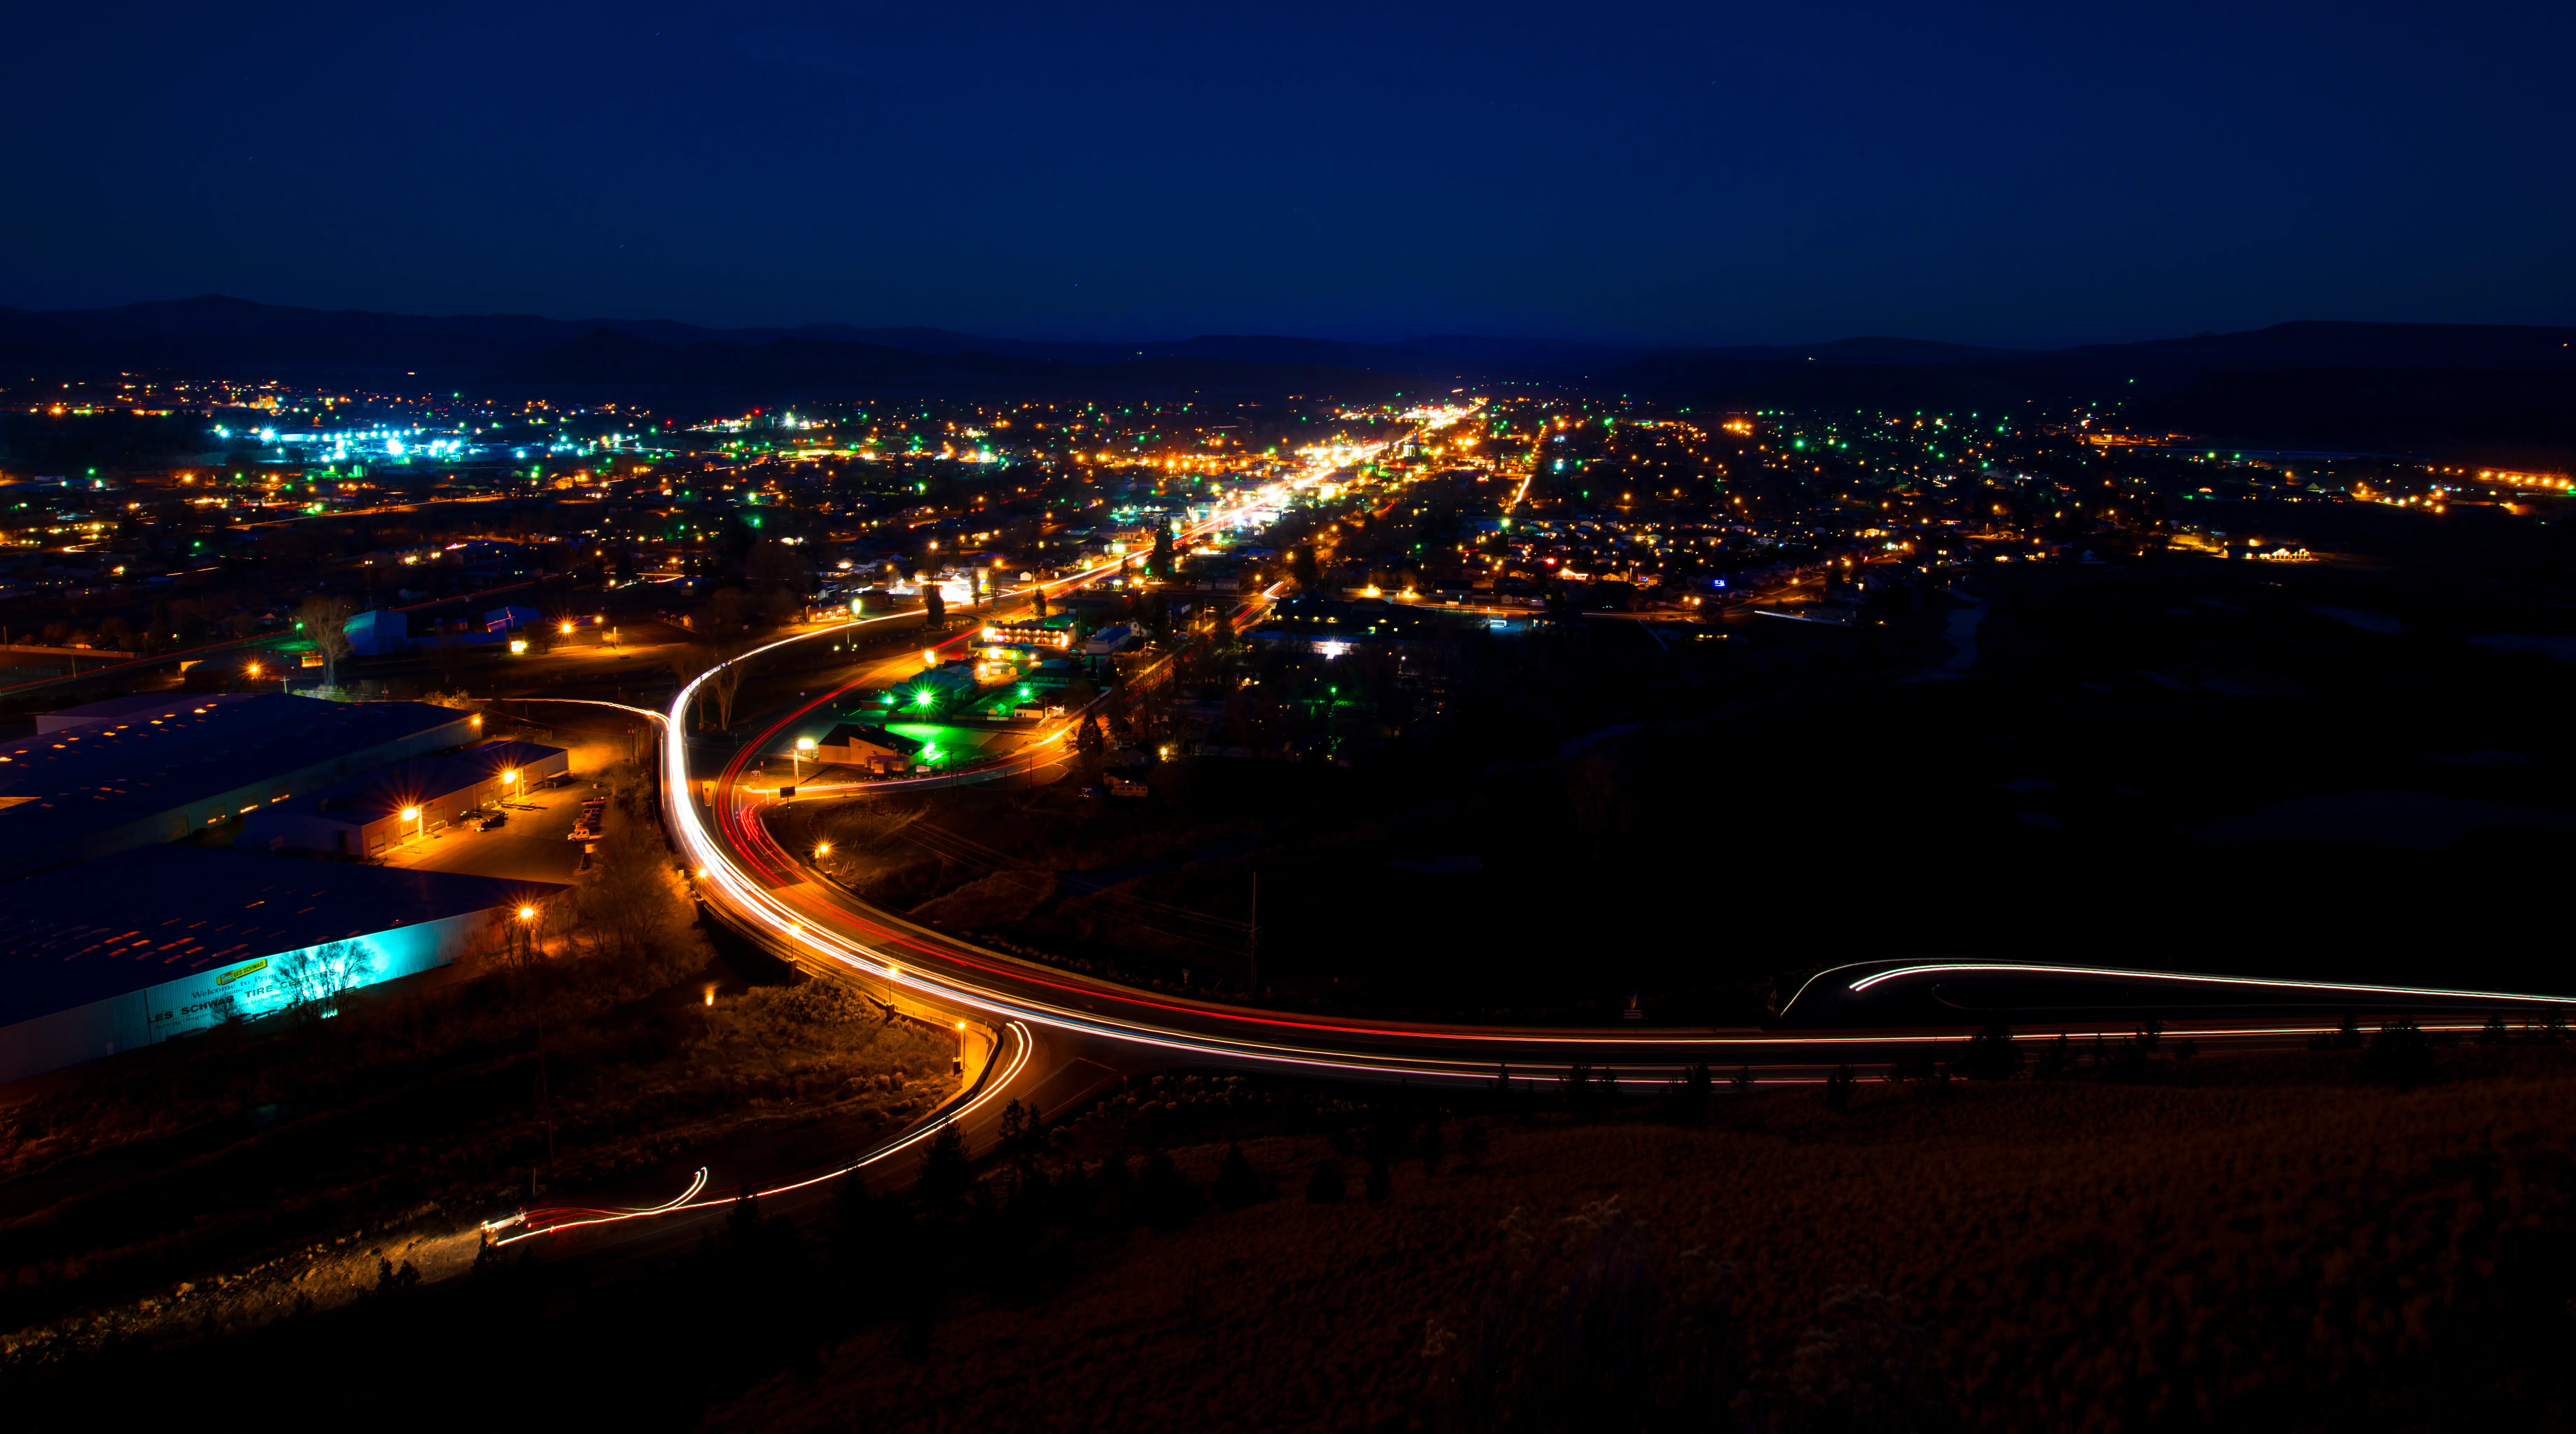
How Prineville's Crime Rates Compare to Oregon and the Nation
The headline figures are straightforward: Prineville carries a violent crime rate of 2 per 1,000 residents and a property crime rate of 7 per 1,000 residents. Both sit well below their benchmarks — Oregon's statewide violent rate is 3.3 per 1,000, and the national violent rate is 3.7 per 1,000.
The property crime gap is even wider. Oregon's statewide property crime rate runs at 24.5 per 1,000 residents; the national figure is 18.4 per 1,000. A property crime rate of 7 per 1,000 residents sits far below both. For a city this size in a rural county, that's a meaningful result — not a rounding difference.
The engine renders a comparison table immediately below this section. What it can't show is the composition behind the numbers, which is where the picture gets more useful for anyone actually deciding on a neighborhood.
What the Numbers Don't Show
A per-1,000 rate is an average across the whole city. It doesn't tell you that crime in Prineville is heavily concentrated in the commercial corridor and far lighter in residential areas. It also doesn't tell you that the violent incidents recorded in 2024 were primarily in the assault category — interpersonal situations — rather than the kinds of stranger-danger crimes that make people genuinely reconsider a city.
Zero murders. Zero robberies. That's the violent crime composition for 2024 in a city of 11,917. For families weighing a move, that distinction matters more than the headline rate alone.
What Kind of Crime Actually Happens in Prineville
Property Crime Is Mostly Larceny
Larceny — shoplifting, package theft, minor vehicle break-ins — makes up the overwhelming share of Prineville's property crime figure. Burglary rates are notably low, and car theft sits in the same range. If you've lived in a larger metro and worried about a catalytic converter or a garage break-in, the scale of those concerns drops considerably here.
This matters for how you protect yourself. Package theft from porches and opportunistic car break-ins are real, low-stakes annoyances that show up in the numbers. A habit of bringing packages in quickly and not leaving valuables visible in a parked car covers most of what the property crime data is actually describing.
Violent Crime Stays Interpersonal
The violent incidents that occurred in 2024 were primarily assaults — situations between people who knew each other — rather than random attacks or street crime. For someone relocating from a larger city, this is an important distinction. Prineville doesn't have the kind of ambient street-safety concern that registers in denser urban environments.
The community's structure reinforces this. Prineville is a largely owner-occupied city with a concentrated commercial core and low residential density — a configuration that tends to keep crime rates down compared to cities built around large apartment complexes or sprawling retail corridors. The Meta data center on the city's eastern edge added stable employment without adding the late-night commercial activity that often accompanies crime spikes in fast-growing towns.
The Human Friction Moment: What Surprises People After a Few Months
What newcomers don't expect is how quickly the pace of daily life makes even the modest crime numbers feel abstract. After a few months, most people stop thinking about it as a safety question at all — and a handful of them overcorrect, leaving cars unlocked or packages on the porch for days. The larceny figures are real and worth a baseline of sensible habits, even in a low-crime environment.
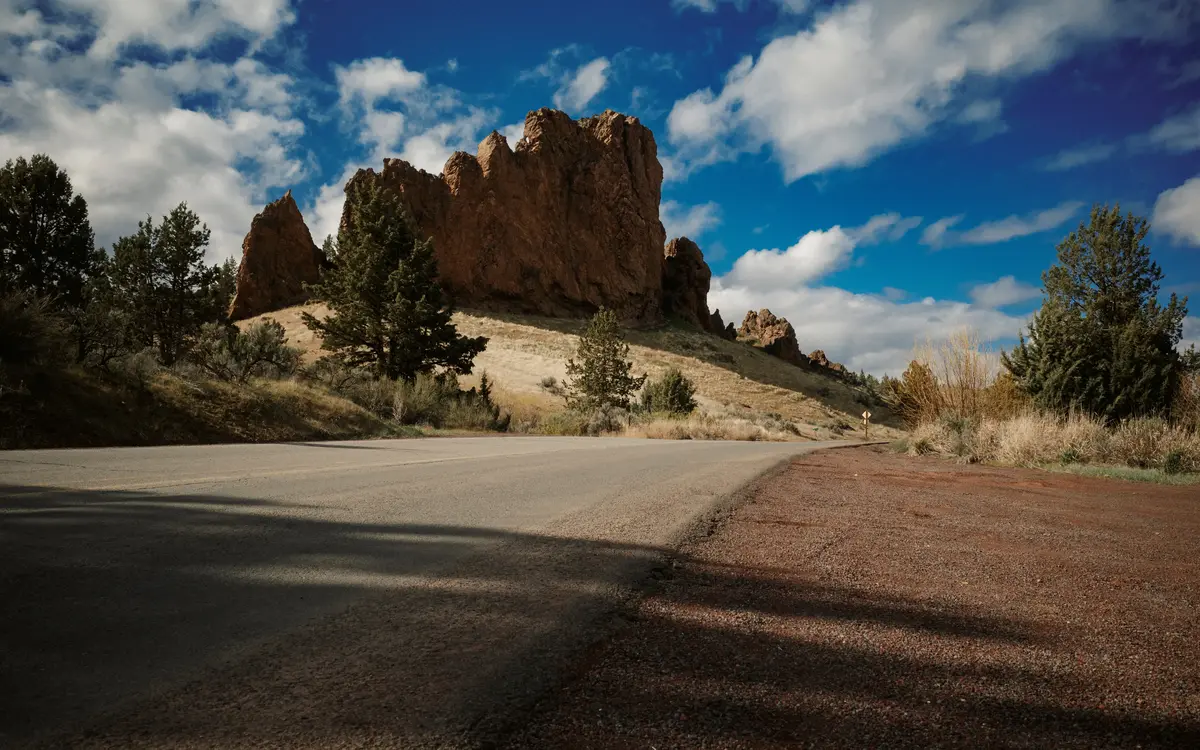
Where Crime Concentrates in Prineville — and Where It Doesn't
The Downtown Corridor: High Foot Traffic, Not High Stakes
Downtown Prineville carries the highest incident concentration of any part of the city. That sounds alarming until you understand why: crime follows commercial foot traffic, not residential density. The central corridor is where retail, restaurants, and services cluster, so it's also where the shoplifting, the vehicle break-ins near parking, and the occasional interpersonal incident show up in the data.
Residents consistently describe downtown as peaceful, family-friendly, and walkable — and that squares with the data when you read it carefully. The incidents recorded there are concentrated crime in a statistical sense, not the kind of environment that makes people uncomfortable walking around. The gap between how residents experience downtown and what the raw incident count suggests is one of the more instructive things about reading small-city crime data.
Retail Corridors and the Western Edge
Crime maps of Prineville also show elevated figures along the retail corridors on the western edge of the city. This is a pattern common to small cities: crime is measured per resident, so commercial zones that attract shoppers from across the county can look worse than they are because the denominator — permanent residents — understates the actual foot traffic. An area that feels like a quiet shopping corridor to the people who live nearby can read as a hotspot simply because it draws visitors.
The takeaway for anyone researching a neighborhood in that part of the city: pull the incident type before drawing conclusions. If it's larceny concentrated around retail parking, that's a different picture than residential burglaries or assaults.
Where Incidents Are Fewest
Geographic breakdowns place the southwest residential quadrant at the low end of Prineville's incident distribution — one of the quietest pockets in an already low-crime city. Residential neighborhoods away from the commercial core consistently show fewer incidents than the city-wide figures would suggest, because the average is pulled upward by the downtown and retail corridor concentration.
For anyone choosing between neighborhoods, the practical research move is to look at incident type by location rather than a total count. Filtering an online crime-mapping tool by incident type gives a more accurate picture of what daily life in a specific part of Prineville actually looks like. See the full neighborhood breakdown at Prineville's best neighborhoods guide.
Looking to buy in Prineville? Estimate your payment.
Enter your numbers to see an estimated monthly mortgage payment.
Estimate only. Excludes HOA fees and mortgage insurance. The interest rate above is a starting point, not a quoted rate — replace it with your own to see real numbers. Insurance is a flat placeholder, not a Prineville quote.
Neighborhood Safety Character: What Residents Say
Hard crime data at the neighborhood level is limited for a city this size. What fills the gap is resident sentiment from platforms like Nextdoor, local forums, and community-sourced reporting. These aren't crime statistics — treat them as qualitative signals about what it feels like to live in a place, not as precise safety rankings.
Ochoco Pointe
Consistently described by residents as clean, quiet, and family-friendly, with views toward the Ochoco Mountains and easy access to parks. The words that come up repeatedly — safe, peaceful, well-kept — reflect a neighborhood that has attracted families and longer-term residents rather than high-turnover renters. It sits at the upper end of the resident-sentiment spectrum for Prineville.
West Hills
An established neighborhood on Prineville's western edge with a stable residential character. Its distance from the commercial core keeps it largely removed from the larceny patterns that show up in the downtown data. Locals describe it as one of the calmer parts of town — not because it's new or gated, but because it's an older, settled residential area where turnover is low and neighbors tend to know each other.
Downtown Prineville
The commercial hub and the area with the highest incident concentration — but that headline is worth qualifying. Residents describe it as peaceful and walkable, with historic character and genuine neighborhood feel. The incidents recorded here are almost entirely property crime tied to retail activity, not the kind of residential crime that affects quality of life for people who live there. Knowing that the data and the lived experience diverge here is the thing that separates an informed read of this market from a reflexive one.
IronHorse, Juniper Canyon, Longhorn Ridge, Indian Rock Estates, and Ochoco Heights
These neighborhoods don't appear in safety-specific resident reporting with enough frequency to characterize them precisely. What can be said: all sit within a city that carries a violent crime rate of 2 per 1,000 residents and a property crime rate of 7 per 1,000 residents — well below state and national averages. A neighborhood's absence from crime-focused discussion is itself a reasonable baseline signal in a small city. None were flagged in any source reviewed as areas of concern.
The honest caution: resident-sourced safety sentiment is self-selecting. People who feel unsafe are often the ones posting about it, and people who feel fine don't write reviews. Use it as one input alongside the geographic incident data, not as the only picture.
Community Policing and What to Check Before You Choose a Neighborhood
How the Prineville Police Department Operates
The Prineville Police Department runs on a community policing model, with Community Service Officers functioning as a bridge between residents and the department. Outreach programs include Shop with a Cop, Faith & Blue, and a presence at the Crook County Fair — the kind of community-embedded approach that tends to produce better information flow in both directions between residents and officers.
It's a small department that knows the city well. Officers develop familiarity with repeat locations and individuals — a practical advantage in a town this size — and patrol presence is visible in both the downtown corridor and residential areas.
What to Actually Research Before Deciding on a Neighborhood
If you're narrowing down a specific block or street in Prineville, a few steps will give you a more accurate picture than any city-wide safety article can.
- Use an online crime-mapping tool and filter by crime type — larceny near a commercial corridor reads very differently than residential burglary on the same block.
- Check Nextdoor for the specific neighborhood, not just the city. The signal-to-noise ratio is higher in a small city than in a metro, and neighbors here tend to post about specific intersections and recurring issues rather than vague unease.
- Drive the area at different times of day. Prineville is small enough that a morning drive and an evening drive in the same week gives you a genuinely useful read on foot traffic, lighting, and activity patterns.
- Ask the Prineville Police Department directly. Community policing departments in cities this size are generally responsive to specific location questions — it's a different environment than calling a big-city precinct.
The Seasonal Reality Newcomers Miss
Prineville sees a real uptick in visitors during summer — reservoir season, Ochoco National Forest traffic, events at Pioneer Park. The larceny figures that show up in the data aren't evenly distributed across the year; vehicle break-ins near trailheads and recreation areas tend to cluster in the warmer months. If you're parking at a trailhead or leaving a vehicle overnight near a recreation destination, that's the one seasonal quirk worth building a habit around. It's not a safety concern in the residential sense — it's the same opportunistic petty theft that shows up wherever outdoor recreation meets parking lots.
For a deeper look at how Prineville's neighborhoods compare on character, housing stock, and fit for different buyers, the best neighborhoods guide covers each area in detail.

Local Expert Takeaway: Prineville's crime picture is genuinely better than most people expect going in. A violent crime rate of 2 per 1,000 residents and a property crime rate of 7 per 1,000 residents both sit well below what Oregon posts statewide, and the 2024 data showed zero murders and zero robberies. Where crime does occur, it clusters around the commercial corridor and retail zones — not in the residential neighborhoods where most people actually want to live. West Hills and Ochoco Pointe are the neighborhoods residents most often describe as calm and settled; downtown carries more of the statistical weight but feels far less concerning on the ground than the incident count suggests. The practical habit that covers most of the real risk here: bring packages in, don't leave valuables visible in a parked car, and pay attention during summer when recreation-area foot traffic lifts the opportunistic larceny count.
Quick Takeaways & FAQs
✅ Prineville carries a violent crime rate of 2 per 1,000 residents — meaningfully below both the Oregon statewide rate and the national figure, a genuine safety advantage for a Central Oregon city of this size.
⚠️ Property crime is real but heavily concentrated in the commercial corridor and dominated by larceny; residential burglary and car theft rates are notably low, which is the distinction that actually matters for daily life.
📍 Zero murders and zero robberies were recorded in Prineville in 2024 (FBI UCR data), and the five-year trend in both violent and property crime has been declining.
Is Prineville, Oregon a safe place to live?
What types of crime are most common in Prineville?
Which neighborhoods in Prineville are considered the safest?
How does Prineville's crime compare to Bend and Redmond?
Has crime in Prineville been getting better or worse?
Moving to Oregon?
Tell us what you need help with and we'll connect you with local resources.
