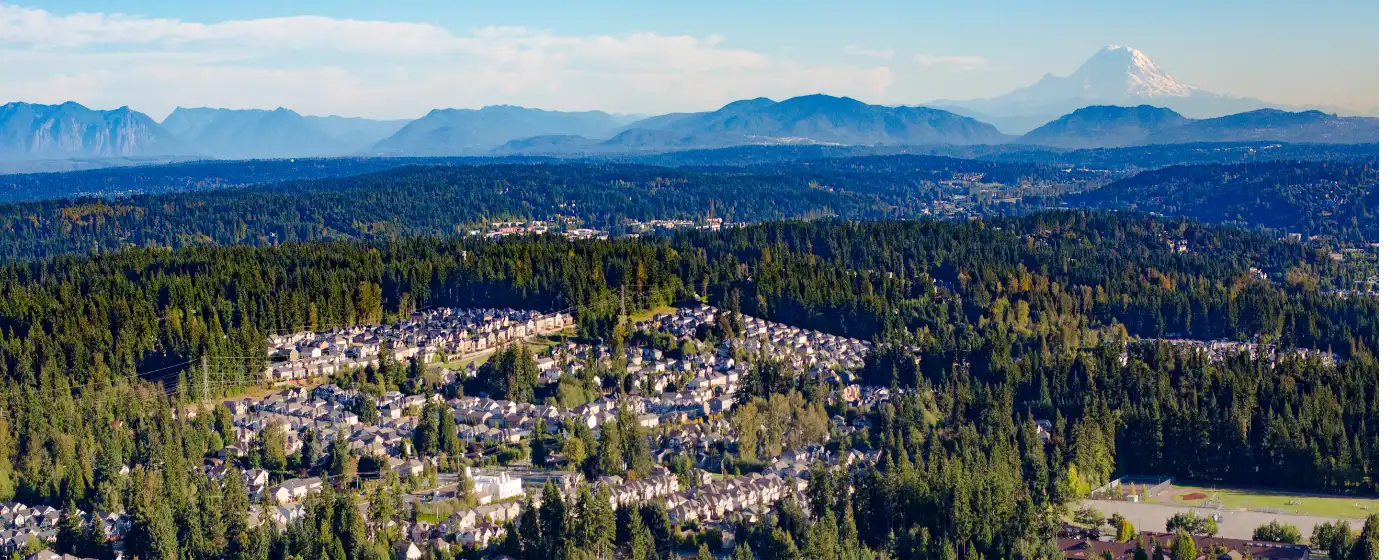
Most people moving to the Seattle metro ask about traffic first and price second. Safety usually comes third — and when they finally look up the numbers for Bothell, they're often relieved. The city's violent crime rate sits at 1 per 1,000 residents (110 per 100,000), which NeighborhoodScout, using FBI 2024 data, describes as about average for U.S. communities of all sizes. For a suburb 30 minutes from downtown Seattle, that's a meaningful benchmark. Bothell is not a zero-crime city — no city is — but the data places it squarely in the safer half of American suburbs.
The picture gets more interesting when you look at where Bothell actually sits in the state. Based on FBI 2024 crime data, the city ranks #16 of 87 reporting cities in Washington state and is safer than 57% of U.S. cities overall. Washington state has a well-documented property crime problem — its statewide property crime rate runs noticeably higher than the national average — which makes Bothell's local property crime figure of approximately 14 per 1,000 residents all the more notable. The city's property crime rate is roughly 45% lower than the Washington state average, a gap that reflects both its suburban density and the income levels of its residents.
One detail that shapes the safety picture more than most newcomers expect: Bothell spans two counties. The southern portion — including Downtown Bothell along the Sammamish River — falls in King County, while the northern half, including Canyon Park and its biotech corridor, sits in the adjacent county to the north. That split creates slight differences in how crime is reported, how police services are structured, and how neighborhood-level data aggregates. If you're comparing ZIP codes or using an online crime map, you may see that boundary reflected in the data without an obvious explanation. This guide breaks down what the numbers actually mean, where the relative risk concentrates, and what a street-level safety research process in Bothell should actually look like.
The sections below cover Bothell's crime figures in national and state context, the neighborhood-level safety picture across areas like Canyon Park, Norway Hill, and Downtown Bothell, the property crime patterns that matter most for day-to-day life, and practical steps for evaluating safety before you decide on an area.

Bothell Crime Numbers in Context: What the FBI 2024 Data Shows
Raw crime rates only mean something next to a comparison. Here's how Bothell's 2024 figures stack up against state and national benchmarks.
| Geography | Violent Crime (per 100k) | Property Crime (per 100k) |
|---|---|---|
| Bothell, WA | 110 | 1,369 |
| Washington State | 326 | 2,467 |
| United States | 359 | 1,760 |
* All figures reflect FBI 2024 Uniform Crime Report data.
Bothell's violent crime rate is roughly one-third the state average and less than a third of the national rate. That's the headline number — and it's genuinely reassuring for a city this close to a major metro.
The property crime picture is more nuanced. Bothell's property crime rate of 1,369 per 100,000 is noticeably lower than Washington state's 2,467 per 100,000, which is itself well above the national average. In plain terms: Washington has a statewide property crime problem driven heavily by vehicle theft and retail theft in urban cores, and Bothell largely avoids that pattern.
The Statewide Trend Behind the Numbers
Washington state's overall crime rate dropped 14.1% between 2023 and 2024, with property crimes down 13.4% and violent crimes down 7.6%. Vehicle thefts statewide fell from over 52,000 in 2023 to 34,294 in 2024 — a decline that directly reduced one of the most visible property-crime categories affecting suburban communities like Bothell.
That trend matters because it means Bothell's current figures reflect an already-improving environment, not a crime spike that's about to correct. The direction of travel here is favorable.
Neighborhood-by-Neighborhood Safety Picture
Bothell's city-wide rate is one thing; where you actually live determines your day-to-day experience. The good news: no neighborhood in Bothell approaches a high-crime designation.
| Neighborhood | Safety Grade | Character | Best For |
|---|---|---|---|
| Queensgate / Brentwood / Crystal Springs | A+ | Quiet residential, established streets | Families Quiet |
| Canyon Park | A | Commercially active, biotech corridor, northern county | Commuter Tech |
| Norway Hill | A | Hillside residential, lower commercial density | Privacy Views |
| Riverside | A | Sammamish River proximity, quieter residential feel | Families Nature |
| North Creek | A | Newer development, mix of residential and retail | Families First-Time |
| Downtown Bothell | B+ | Most commercial activity, King County, higher foot traffic | Walkable Renter |
| Westhill | A | Elevated residential, lower traffic density | Quiet School |
| Thrasher's Corner | A | Suburban residential near SR-527 corridor | Commuter Value |
Safety grades sourced from DoorProfit.com neighborhood crime maps, May 2026.
What the County Line Actually Means for Safety Research
Because Bothell straddles two counties, crime data sometimes aggregates differently depending on which tool you use. Canyon Park, for instance, sits in the northern county — its crime data may not appear in a King County-specific crime map, which can make it look either safer or more data-sparse than it really is.
If you're researching a specific block in Canyon Park or North Creek, cross-reference both county crime portals rather than relying on a single aggregator. The city's own police department publishes incident data that covers the full jurisdiction regardless of county line.
Where Commercial Activity Raises the Baseline
Downtown Bothell and parts of Canyon Park see more retail-related property incidents than purely residential pockets like Norway Hill or Riverside. That's not a red flag — it's a predictable pattern in any suburb where people shop and park. The restaurants and breweries that draw evening crowds to Main Street mean more foot traffic, more parked cars, and statistically more opportunity for opportunistic theft than a hillside cul-de-sac. Understand that dynamic and it stops being alarming.

Property Crime: The Real Risk Pattern in Bothell
If you're worried about something specific in Bothell, it should be property crime — not violent crime. Larceny-theft, burglary, and vehicle-related incidents are the most frequently reported offense categories here, consistent with suburban Seattle-area patterns across the board.
What That Looks Like in Practice
The incidents most likely to touch daily life in Bothell are things left visible in a parked car, a package left on a porch, or an unlocked garage. These are crimes of opportunity, and they concentrate in higher-traffic zones: the Canyon Park commercial corridor, the retail stretch near SR-527, and parking areas serving Downtown Bothell.
The areas that see the least property-crime activity are the quieter residential pockets — Norway Hill, Westhill, and the deeper residential sections of Riverside — where commercial density drops and through-traffic thins out. That's not coincidence; it reflects the same pattern found in comparable suburbs across the Pacific Northwest.
Vehicle Theft: A Notable Improvement
Washington state's vehicle theft problem was severe enough in 2023 to make national news. Statewide thefts fell from over 52,000 incidents in 2023 to 34,294 in 2024 — a meaningful reduction that directly improved the suburban experience in cities like Bothell. If you moved here in 2021 or 2022 and had a bad experience with auto theft, the current environment is genuinely different.
That said, don't park a Kia or Hyundai from model years 2011–2022 unlocked in a surface lot and expect it to still be there in the morning. The statewide software patch rollout for vulnerable models reduced but did not eliminate the risk.
What to Actually Verify Before Choosing a Block
Online crime maps give you a useful starting point, but the most specific data comes from the Bothell Police Department's own incident reports, which you can request by address range. Before settling on a specific neighborhood, spending time there on weekday evenings — not just weekend afternoons — gives you a ground-level sense of activity that no map provides. The park at Bothell Landing draws families through the day; the Main Street corridor shifts character after 9 p.m. Both are worth seeing firsthand.
Looking to buy in Bothell? Estimate your payment.
Enter your numbers to see an estimated monthly mortgage payment.
Estimate only. Excludes HOA fees and mortgage insurance. The interest rate above is a starting point, not a quoted rate — replace it with your own to see real numbers. Insurance is a flat placeholder, not a Bothell quote.
Violent Crime in Bothell: What 1 Per 1,000 Actually Means
A violent crime rate of 1 per 1,000 residents (110 per 100,000) is often described in aggregate terms, but it helps to ground it. The national violent crime rate in 2024 was 359 per 100,000 — more than three times Bothell's figure. Washington state's rate was 326 per 100,000 — also roughly three times higher. Bothell's violent crime rate isn't just below average; it's substantially below both benchmarks.
What Types of Violent Crime Are Reported
Aggravated assault appears in Bothell's crime data more frequently than robbery or other violent offense categories. That's consistent with a city that has active commercial corridors and a relatively dense downtown for its size. Incidents tend to cluster near higher-activity areas rather than spreading uniformly across residential neighborhoods.
Homicide is statistically rare here. In a city of roughly 51,770 people with a violent crime rate at this level, serious violent incidents are genuinely uncommon — not suppressed or underreported, just infrequent.
The Honest Caveat: Reporting Completeness
FBI Uniform Crime Report data reflects only crimes that are reported to police and forwarded by local agencies. Nationally, a significant share of assaults and thefts go unreported — particularly in lower-income communities where distrust of law enforcement is higher. Bothell's demographics, with a median household income of $140,427, suggest its reporting completeness is likely above average, which means the low figures probably aren't hiding a shadow crime problem. But no crime rate is ever a complete picture.
What the data can tell you with confidence: Bothell's violent crime environment is meaningfully safer than most of Washington state and substantially safer than the national average. The neighborhood breakdown page goes deeper on which specific areas have the quietest residential character if that's the primary factor in your decision.
Practical Safety Research: What to Do Before You Decide on an Area
The data is the starting point, not the finish line. Here's what a thorough safety research process actually looks like for Bothell.
Use Multiple Data Sources, Not One Score
Crime aggregator sites like NeighborhoodScout and CrimeByCIty present the same underlying FBI data with different algorithms and different visualization choices. A neighborhood that scores an A on one platform might score a B+ on another — not because the crime data changed, but because the methodology weighted commercial-area incidents differently. Cross-reference at least two sources and look at the raw incident categories, not just the letter grade.
The County Split Changes What You See
Because Bothell spans two counties, some crime mapping tools only show data from one side of that line. If you're researching Canyon Park specifically — which sits in the northern county — make sure your tool of choice covers that county's data. A King County-only map will appear to have no data for that area, which is not the same as no crime.
Visit at Different Times of Day
Bothell's safest-feeling neighborhoods during a Saturday afternoon showing look different at 10 p.m. on a Wednesday. The blocks around Bothell Landing and the Main Street corridor — where evening crowds gather at restaurants and taprooms — are active and generally well-lit, but they're a different environment than Norway Hill or Westhill after dark. Neither is alarming; they're just different, and seeing both helps calibrate your expectations.
What Surprises People After Six Months
The most common observation from new Bothell residents who did their safety research from afar: they underestimated how much the commercial zones on Canyon Park Road and the SR-527 corridor generate low-level property incidents, and overestimated how much those incidents affect daily residential life. A package theft or a car window smash near a strip mall registers in the city's aggregate property crime rate — but it doesn't mean the residential streets two blocks away feel unsafe. Location within Bothell matters more than the city-wide number suggests.
One Thing to Not Overlook
Bothell's crime figures are city-jurisdiction numbers. If you're looking at addresses in unincorporated areas that carry a Bothell mailing address — some exist near the city's northern edge — those addresses may fall under county sheriff jurisdiction rather than Bothell PD, and their incidents may or may not appear in the city's published crime statistics. Check the jurisdiction carefully before assuming city-level data applies to a specific address.
Local Expert Takeaway: Bothell's violent crime rate — 1 per 1,000 residents — is roughly one-third the Washington state average and one-third the national figure, which puts it in meaningfully safe territory for a suburb this close to Seattle. Property crime is the realistic concern, concentrated in commercial zones along Canyon Park Road and Downtown's Main Street rather than the residential hillsides of Norway Hill or Westhill. The county split is the detail most online research tools miss: Canyon Park sits in the northern county, and a King County-only crime map will show it as a data gap rather than a low-crime area. Cross-reference the Bothell Police Department's own incident data with at least one aggregator, visit the specific blocks you're considering on a weekday evening, and the picture becomes far more precise than any city-wide number can provide.
Quick Takeaways & FAQs
✅ Bothell's violent crime rate of 1 per 1,000 residents is roughly one-third the Washington state average, placing it among the safer suburbs in the Seattle metro.
⚠️ Property crime — particularly larceny-theft near commercial corridors like Canyon Park Road and Downtown Main Street — is the realistic day-to-day risk, not violent crime.
📍 Bothell spans two counties, so some online crime maps only show data for half the city — always confirm which county a specific address falls in before drawing conclusions.
Is Bothell, WA a safe place to live?
Which neighborhoods in Bothell are the safest?
What types of crime are most common in Bothell?
How does Bothell's crime rate compare to the rest of Washington state?
Why does Bothell's crime data sometimes look different across different websites?
Moving to Washington?
Tell us what you need help with and we'll connect you with local resources.
