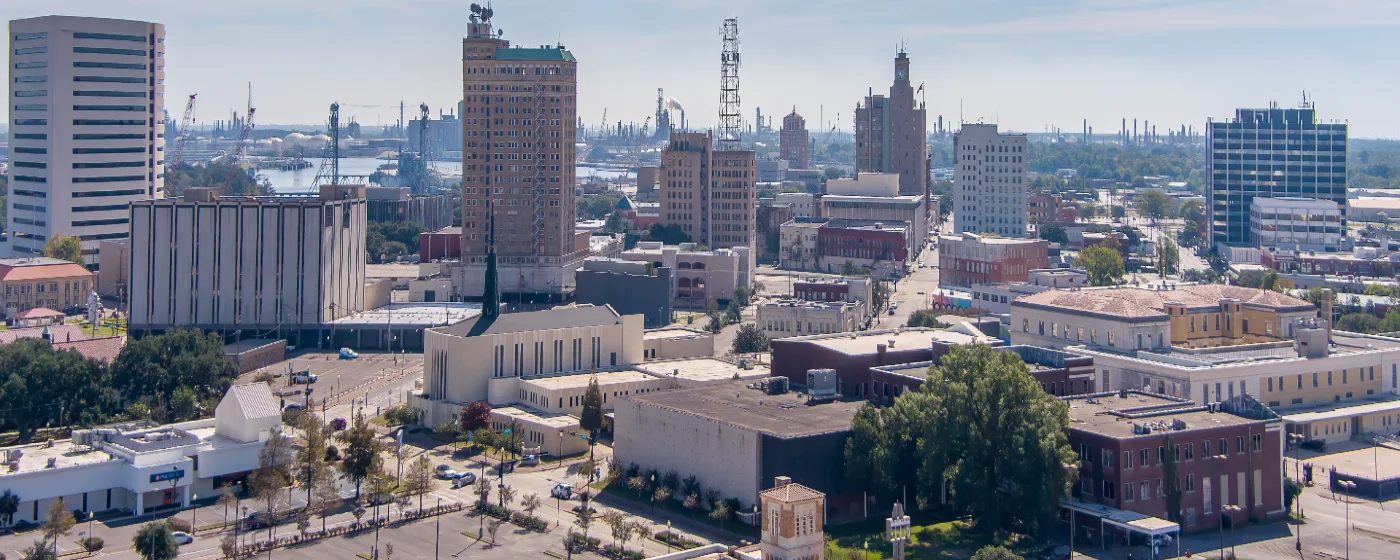
The crime numbers for Beaumont, Texas are the first thing people Google, and they are not low. A city of 112,967 in Southeast Texas's Golden Triangle, Beaumont carries a reputation that tends to precede it — and for anyone relocating from a smaller Texas city or from out of state, the raw statistics can stop a housing search cold. The honest answer is that Beaumont's numbers are elevated compared to state and national averages, and any guide that glosses over that is doing you a disservice.
The fuller answer is more complicated. Crime in Beaumont is not evenly distributed across a 79-square-mile footprint. The southwest neighborhoods — Dowlen West, Westchase, Willow Creek — feel and function differently from the central and historically underinvested parts of the city. Beaumont Police Department launched a Real-Time Crime Center in July 2024 that has already assisted in more than 500 criminal cases, and the department's own nationally mandated reporting shows what Chief Tim Ocnaschek publicly described as a pretty significant decrease in violent crime. The city has also seen a multi-year decline in both categories over the last five years. None of that erases the numbers, but it does matter when you are trying to decide where — and whether — to live here.
The practical question most relocating buyers and renters are actually asking is not whether Beaumont is safe in the abstract, but which parts of it are, what the crime looks like on the ground, and what the trend line is doing. Those are answerable questions, and this guide works through each of them using current data. For context on home prices across these neighborhoods, the neighborhood guide has the full picture; for cost-of-living context, see the cost-of-living page.
The sections below break down Beaumont's crime rates versus state and national benchmarks, the geographic safety gradient across the city's neighborhoods, what the data is missing, and what the Beaumont Police Department is doing about it.
Beaumont's Crime Rates vs. State and National Benchmarks
Beaumont carries a violent crime rate of 7.8 per 1,000 residents and a property crime rate of 43.5 per 1,000 residents, both measured against the Bureau of Justice Statistics, Crime Known to Law Enforcement, 2024 (tables 2 and 3). Those figures land well above both the Texas state average and the national average.
The state violent crime rate is 4 per 1,000; the national violent crime rate is 3.7 per 1,000. Beaumont's violent crime rate is roughly double both. On property crime, the gap is wider: the state rate is 20.7 per 1,000, the national rate is 18.4 per 1,000, and Beaumont's rate is more than double either. That is a real difference, and it should factor into your decision.
Context helps without excusing the numbers. The underlying 2024 FBI counts — 1,266 violent offenses and 3,676 property offenses — show that property crime dominates the picture, and within that category, larceny-theft accounts for roughly 51% of all reported offenses citywide. That means the single biggest driver of Beaumont's elevated property crime rate is theft, not the more serious offenses that most people picture when they hear the word crime. Theft is serious, but it is a different risk calculation than what the headline rate suggests.
The trend line is also moving in the right direction. City-Data's crime index for Beaumont fell by 16% in the most recent year measured, and the city has seen a multi-year decline in both violent and property crime over the last five years. A 16% drop in a single year is meaningful. Whether it represents a structural shift or a temporary fluctuation is something only another few years of data will confirm, but it is not nothing.
The Geographic Reality: Where Crime Concentrates in Beaumont
Beaumont's crime is not spread uniformly across the city, and the single most important thing a prospective resident can understand is the southwest-to-central gradient. The city's safest areas cluster in the southwest quadrant. The highest crime concentrations sit in central and northwest sections. The northeast portion of the city reports among the fewest total incidents annually.
One important caveat on reading crime maps: northwest Beaumont holds a significant concentration of retail and commercial activity. Because crime incidents follow foot traffic rather than just residential population, the northwest commercial corridor can look alarming on a heat map while posing a lower day-to-day risk to actual residents there. Analysts who study these maps specifically caution that a red zone in a retail area does not translate directly into risk for the people who live nearby.
The Southwest: Where Most Relocating Families Land
Dowlen West, Westchase, and Willow Creek sit in Beaumont's southwest and are consistently described by residents as quiet, well-maintained, and family-oriented. Each of these neighborhoods carries a price tier above the city median — a market signal that reflects real demand from buyers who have done their homework. Residents in Dowlen West and Willow Creek describe a neighborhood character that matches that premium: maintained streets, active neighborhood associations, and a general sense that people are watching out for each other.
Beaumont PD supports active neighborhood associations in both Dowlen West and Willow Creek, as well as in Caldwood and Westchase, providing staff liaisons who facilitate direct communication between residents and the department. That infrastructure is not just symbolic — it means residents in these areas have a structured channel to raise concerns and get responses.
The Central and Historical Core
Old Town and the Oaks neighborhood reads as genuinely walkable and historically rich to residents who live there. The architecture alone draws people in, and the neighborhood association is active. At the same time, Old Town's below-median price tier reflects that it is not uniformly low-risk — pockets within it carry higher risk than the west-end neighborhoods, and the variation within its boundaries is wide enough that street-level research matters before choosing a specific block.
South Park carries a below-median price tier and a complex history. It was one of Beaumont's original oil-industry worker neighborhoods, and decades of suburban disinvestment left parts of it neglected. More recent accounts describe a revival underway, which is consistent with the citywide decline trend, but South Park remains an area where caution and neighborhood-level due diligence are warranted. The same applies to Charlton-Pollard, which sits at a below-median price tier; its neighborhood association is active and connected to Beaumont PD, which is a positive signal, but the price tier itself tells you something about relative risk and demand.
For a fuller breakdown of what each neighborhood offers and who it suits, the best neighborhoods guide covers the character of each area in detail.
What the Numbers Don't Tell You
| Measure | Beaumont | Texas | National | vs. national |
|---|---|---|---|---|
| Violent crime (per 1,000) | 7.8 | 4 | 3.7 | 111% higher |
| Property crime (per 1,000) | 43.5 | 20.7 | 18.4 | 136% higher |
State and national figures — Bureau of Justice Statistics, Crime Known to Law Enforcement, 2024 (tables 2 and 3). City figures — DoorProfit.com, based on FBI UCR data. City rates come from a different reporting series than the state and national benchmarks, so read the comparison as a direction, not a precise multiple.
Crime statistics measure reported incidents, not lived experience, and in Beaumont the gap between the two is worth understanding.
Residents surveyed on Nextdoor — people actually living in the city — generally describe Beaumont as a safe place to live. The practical advice that circulates most often among locals is not "avoid these streets" but rather the basics: lock your vehicle, lock your doors, stay aware of your surroundings. That is consistent with a city where larceny-theft is the dominant offense type. The most common crime is the opportunistic kind — unlocked cars, accessible property — rather than the targeted kind.
Six months in, most people who move to Beaumont from a smaller Texas city say the same thing: the statistics sound worse than the reality in the neighborhoods where most newcomers actually land. That is not spin. It reflects something real about how citywide averages obscure the southwest-versus-central divide. When a city's highest-crime corridors include commercial retail strips that inflate the count, and when those corridors are geographically separated from the residential neighborhoods where most families settle, the aggregate rate overstates the risk those families face day to day.
That said, the numbers are not wrong. A violent crime rate nearly double the state average is not explained away by retail foot traffic. People do move out of Beaumont because of crime concerns — that is an honest reason people give, and it is worth weighing. The question is whether you are buying into the risk of the whole city or the risk of the specific neighborhood you have chosen, and in Beaumont those are very different calculations.
Caldwood sits at the city median on price, which puts it in the middle of the range. Its neighborhood association is active and PD-supported, which matters. But a mid-tier price in Beaumont does not necessarily mean mid-tier safety — research the specific streets rather than relying on the neighborhood name alone.
Looking to buy in Beaumont? Estimate your payment.
Enter your numbers to see an estimated monthly mortgage payment.
Estimate only. Excludes HOA fees and mortgage insurance. The interest rate above is a starting point, not a quoted rate — replace it with your own to see real numbers. Insurance is a flat placeholder, not a Beaumont quote.
What Beaumont Is Doing About It: The Real-Time Crime Center
In July 2024, the Beaumont Police Department launched its Real-Time Crime Center, integrating license plate readers, body cameras, vehicle cameras, and a city-wide street camera network into a single monitoring operation. The department describes it as the Neighborhood Watch of the 21st Century.
The results so far are concrete: the RTCC assisted in more than 500 criminal cases in its first year of operation. The department is also expanding the network through a Homeland Security Grant that will integrate cameras from Jefferson, Hardin, and Orange counties — extending the monitoring reach beyond city limits into the surrounding region. A Beaumont PD lieutenant put the operational impact plainly: if you commit a violent crime in the morning, you can expect to be in jail that afternoon.
Chief Tim Ocnaschek — appointed in July 2024 with over four decades of law-enforcement and military experience — has publicly stated that the department's nationally mandated crime statistics show a pretty significant decrease in violent crime. He has also been direct about a secondary challenge: changing the public perception that Beaumont is unsafe, even as the numbers improve. The gap between the data and the city's reputation is real, and it creates a dynamic where people who have never lived here are more alarmed than people who do.
Community policing efforts have expanded alongside the technology investment. Beaumont PD maintains staff liaisons to neighborhood associations across the city — in Dowlen West, Caldwood, Westchase, Charlton-Pollard, Old Town and the Oaks, and Willow Creek — giving residents a structured way to surface problems and hold the department accountable. Whether the decline trend continues will depend on whether those investments hold, but the infrastructure is more robust than it was five years ago.
Practical Safety Research Before You Choose a Neighborhood
The city-level crime rates are the starting point, not the endpoint. Before you decide on a neighborhood in Beaumont, the most useful research you can do is at the block and street level — not just which neighborhood name you are in, but where within it.
Three specific steps make a real difference here. First, run the address through CrimeGrade.org, which maps Beaumont's crime distribution in granular enough detail to distinguish a quieter block within a mixed neighborhood from one that sits closer to a concentration. Second, check whether the neighborhood has an active neighborhood association connected to Beaumont PD — that presence is a meaningful proxy for organized resident engagement and a direct line to the department. Active associations exist in Dowlen West, Caldwood, Westchase, Charlton-Pollard, Old Town and the Oaks, and Willow Creek. Third, talk to the Nextdoor community for the specific street. The platform is not a substitute for data, but resident-level conversations surface things the aggregate numbers miss.
The southwest quadrant — Dowlen West, Westchase, Willow Creek — is where most people who have researched Beaumont's safety picture end up focusing their search, and the market reflects that: all three sit above the city median on price. That premium is partly about housing stock and partly about the safety calculus that buyers have already done. Pear Orchard, which sits below the city median, deserves the same street-level research you would apply to Old Town — the neighborhood name tells you something, but not enough on its own.
One thing locals learn quickly: do not make decisions based on a drive through Beaumont on I-10. The freeway corridor gives you a narrow slice of the city that does not represent either the worst or the best of it. The neighborhoods worth living in are west of the commercial strip, and they do not announce themselves from the highway. Drive the residential streets in Dowlen West or Willow Creek before you write off the city based on what you saw from the on-ramp.
For a broader picture of who Beaumont suits and what daily life looks like here, the living in Beaumont guide covers the full picture beyond the safety question alone.
Local Expert Takeaway: Beaumont's citywide crime rate is real and above average — but the city is not monolithic. Residents who land in Dowlen West, Willow Creek, or Westchase consistently describe quiet, well-maintained neighborhoods with active associations and direct lines to the police department. The meaningful safety research in Beaumont happens at the block level, not the city level. The trend is also moving: a multi-year decline and a Real-Time Crime Center that has assisted in more than 500 cases since mid-2024 are the most concrete signs that the city is investing in changing the numbers, not just the perception.
Quick Takeaways & FAQs
✅ Beaumont's crime trend is improving — the city has posted a multi-year decline in both violent and property crime, and the Real-Time Crime Center launched in 2024 has already assisted in over 500 criminal cases.
⚠️ Beaumont carries a violent crime rate of 7.8 per 1,000 residents — roughly double both the Texas state average and the national average — a gap that makes neighborhood-level research essential before you commit to a specific area.
📍 Larceny-theft accounts for roughly 51% of all reported offenses in Beaumont, meaning the elevated property crime rate is driven far more by opportunistic theft than by violent incidents — lock your vehicle and your doors.
Is Beaumont, TX a safe city to live in?
Which part of Beaumont has the lowest crime?
Is Beaumont's crime rate getting better or worse?
What is the Beaumont Real-Time Crime Center?
What type of crime is most common in Beaumont?
Moving to Texas?
Tell us what you need help with and we'll connect you with local resources.
