
People moving to Woodburn from the Portland metro often arrive expecting a sleepy farm town and leave pleasantly surprised — or occasionally the reverse. The city of 27,875 sits along I-5 in Marion County, and that highway position is load-bearing for understanding how crime here actually works. Woodburn is both a regional retail destination — Woodburn Premium Outlets draws traffic from across the Willamette Valley — and a working agricultural community, and those two identities create very different safety pictures depending on which part of the city you are researching.
The headline numbers tell a moderately reassuring story. Woodburn carries a violent crime rate of 3.3 per 1,000 residents — exactly at Oregon's statewide figure and meaningfully below the national rate of 3.7 per 1,000. The city also has a property crime rate of 25.6 per 1,000 residents, which runs somewhat above the state average of 24.5 per 1,000 and noticeably above the national average of 18.4 per 1,000. That gap matters, but the distribution of those incidents matters far more than the aggregate number, which is what this guide breaks down.
The trend line is worth knowing before you get to the static figures. FBI data compiled through City-Data shows the 2024 crime rate fell roughly 7% compared to 2023, part of a multi-year trajectory that has been moving in the right direction on both violent and property categories. A single year can be noise; several years moving the same direction is a pattern. Woodburn is not yet where it wants to be on property crime, but it is not where it was five years ago either.
Whether you are comparing neighborhoods before choosing a block to settle on, or simply trying to understand what the numbers mean for daily life, the sections below break down Woodburn's crime context against state and national benchmarks, the geographic distribution of incidents across specific neighborhoods, what the Woodburn Police Department is doing proactively, and the practical questions worth asking before you commit to a particular area.
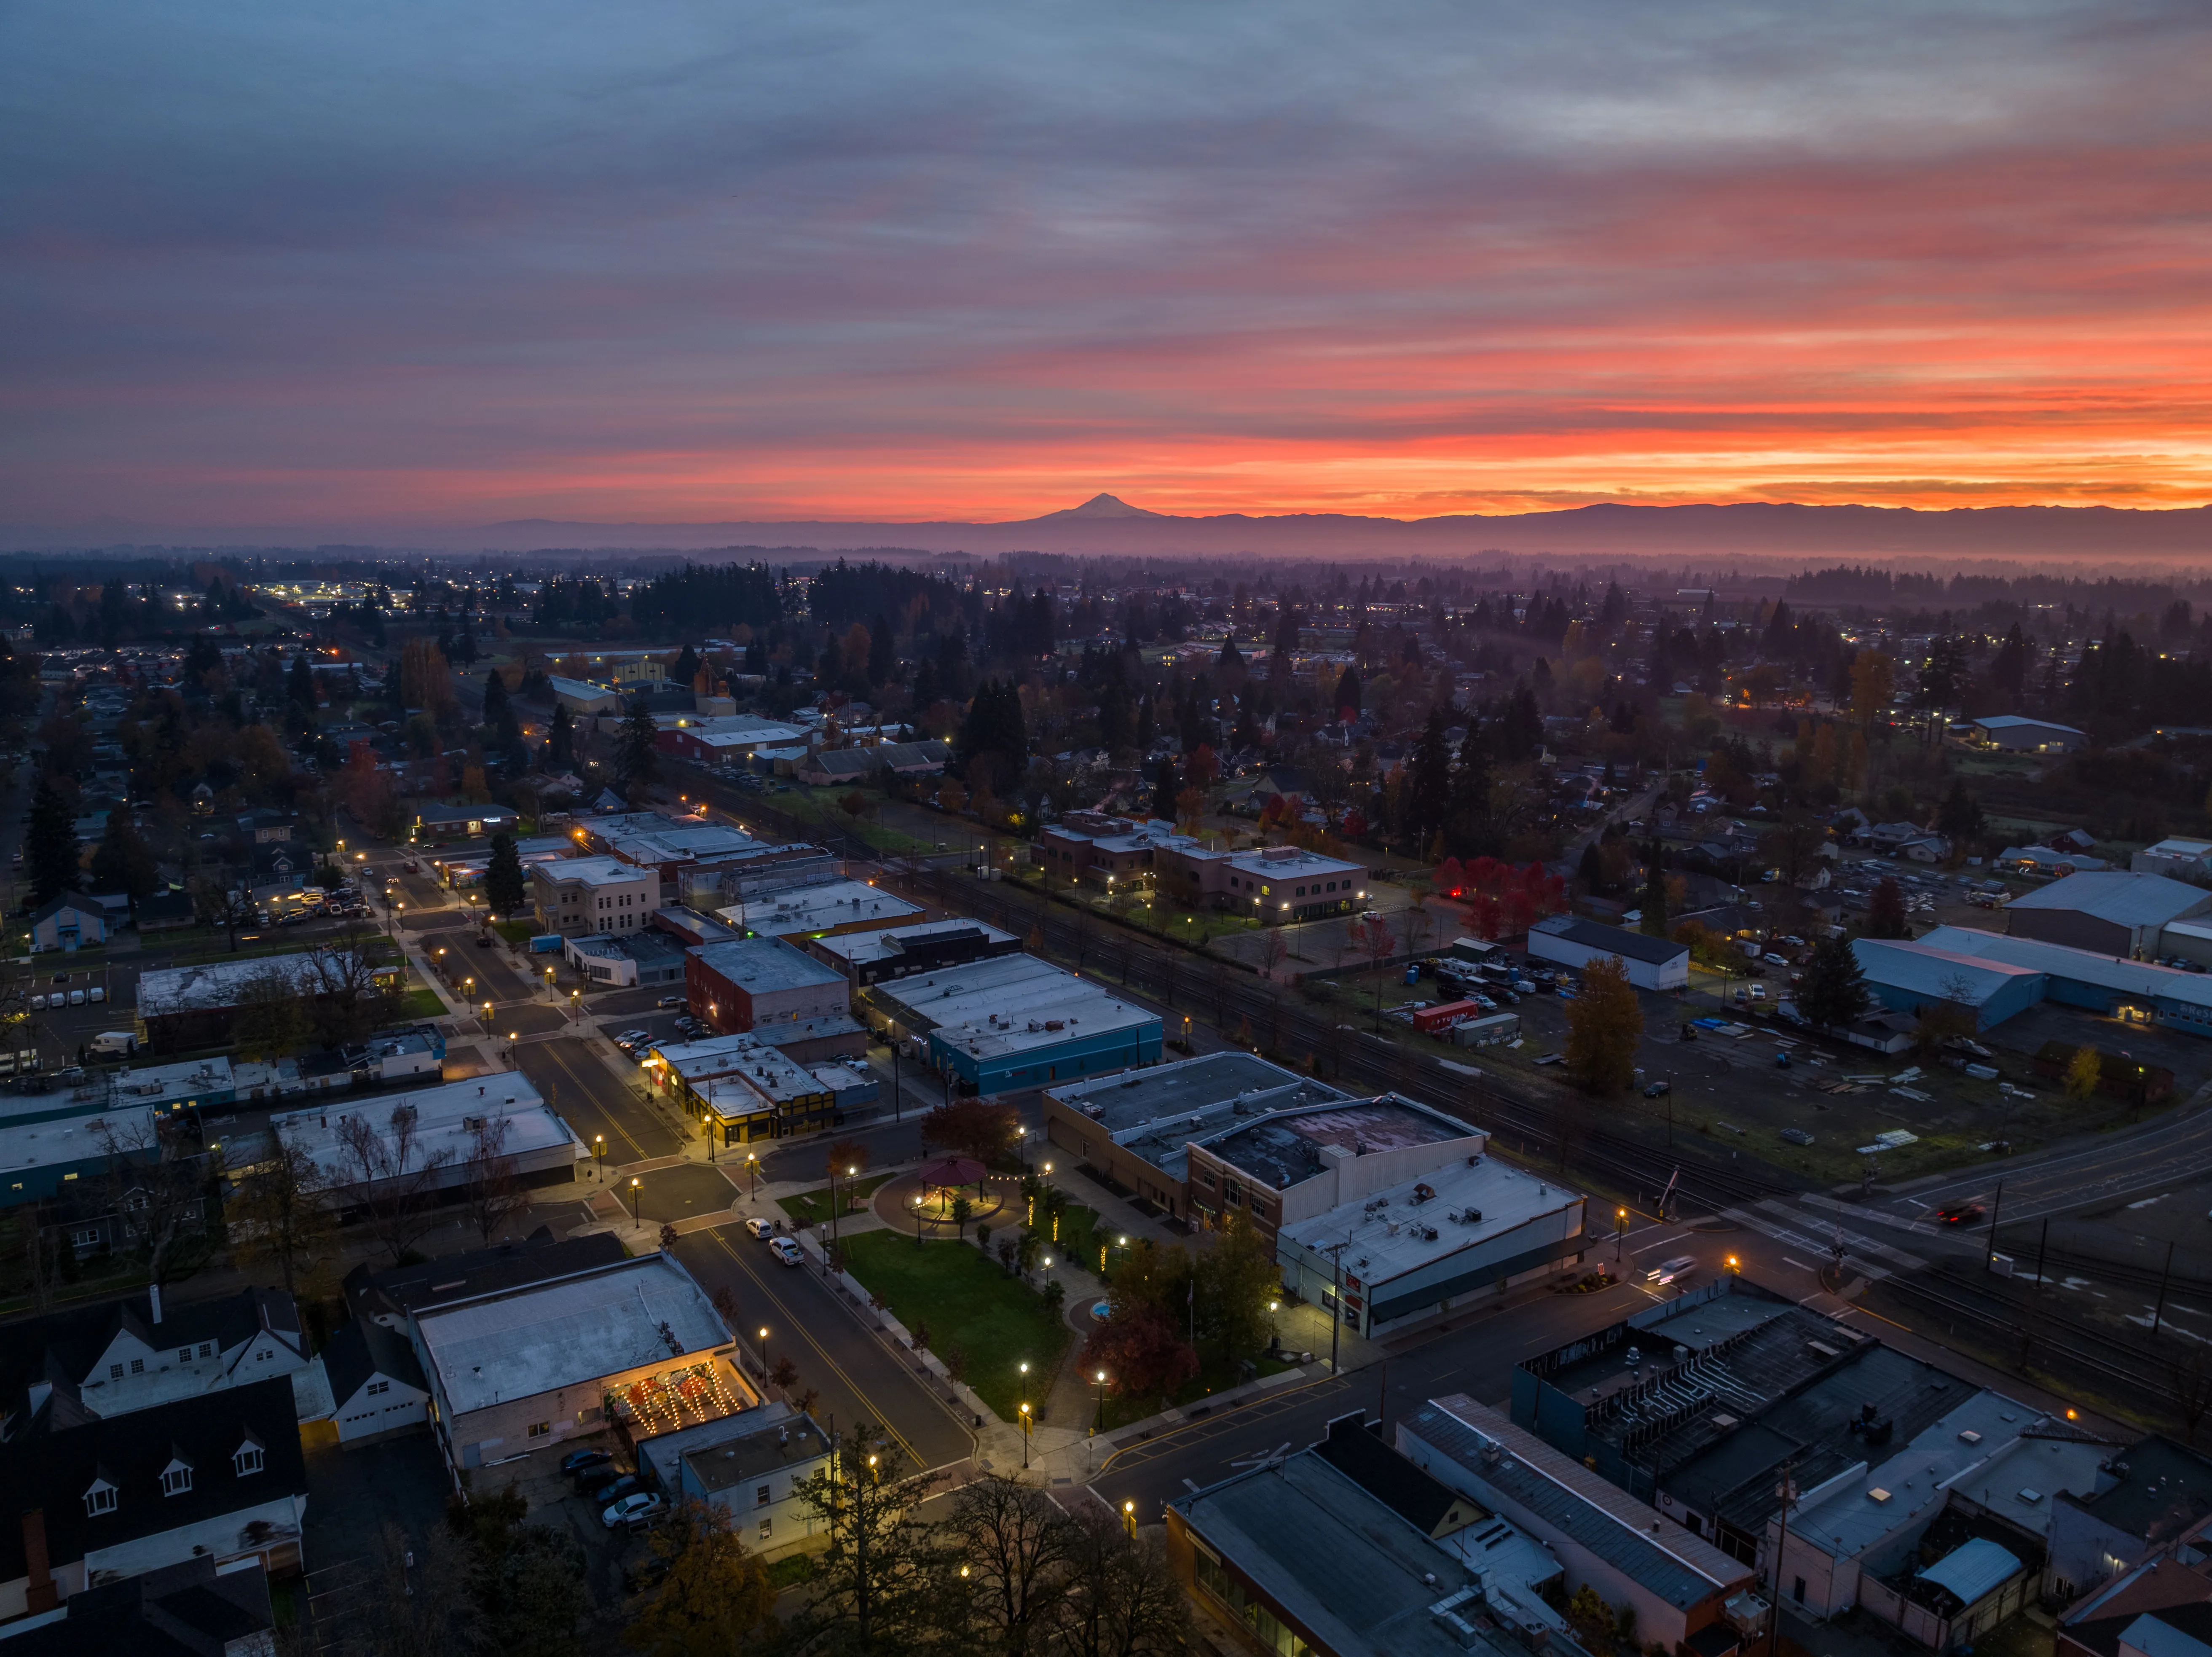
How Woodburn's Crime Rates Stack Up Against Oregon and the Nation
The comparison table the engine renders here puts the key numbers side by side, but context gives them meaning. Woodburn's violent crime rate of 3.3 per 1,000 residents matches Oregon's statewide figure precisely — which means the city is not an outlier within the state, just another community tracking the state norm. Against the national rate of 3.7 per 1,000, Woodburn looks slightly safer than the American average for violent crime.
Property crime is the honest challenge. The city has a property crime rate of 25.6 per 1,000 residents, running above both the state average of 24.5 per 1,000 and well above the national average of 18.4 per 1,000. That gap with the national figure is real, and buyers moving from communities with very low property crime rates will notice the difference.
What's Actually Driving the Property Crime Number
Here is what the aggregate rate does not tell you: a significant share of Woodburn's property crime is concentrated around the northwest retail corridor — the outlet mall and surrounding commercial zone — where theft, fraud, and vehicle break-ins involving visitors rather than residents account for a disproportionate portion of the citywide tally. Those incidents count in the aggregate, but they have minimal bearing on what it feels like to live in a residential neighborhood on the south or east side of town.
This is not an excuse for the number, but it is essential context for reading it. A city that hosts one of the most trafficked outlet centers in the Pacific Northwest is going to record retail-related crime at a rate that inflates its property crime figure beyond what residential streets actually experience. When researchers analyzed the geographic distribution of incidents, this northwest commercial concentration was the clearest structural explanation for Woodburn's above-average property rate.
The Multi-Year Trend
Static rates, taken alone, miss the direction of travel. The multi-year trajectory here is improving on both categories, with 2024 showing a roughly 7% overall drop compared to 2023 according to FBI data compiled through City-Data. Cities that are actively moving in this direction deserve the acknowledgment — and cities that are not deserve honesty about it. Woodburn qualifies for the first category.
Neighborhood-by-Neighborhood Safety Picture
Woodburn's geography shapes its safety profile more than almost any other factor. The city's neighborhoods fall into a rough pattern: newer master-planned communities on the east and south side of town, where incidents are minimal and HOA governance is active; an older residential core near downtown that presents a more mixed picture; and the northwest commercial zone where property crime concentrates around retail traffic.
| Neighborhood | Safety Character | Best For |
|---|---|---|
| Tukwila | Among the quietest in the city — newer construction, cul-de-sacs, HOA governance, family-oriented | Families Quiet |
| Smith Creek | Newer southern subdivision; minimal incidents relative to city average; strong community familiarity | Families Quiet |
| South Woodburn | Nextdoor residents describe it as peaceful, walkable, and welcoming; safety is frequently cited as a reason to stay | Families Walkable |
| Boones Crossing | Active HOA, continued residential investment; community standards enforced through association governance | Families Value |
| Marion Pointe | Newer residential area south of the commercial core; benefits from distance from the retail corridor | Families Quiet |
| Brighton Pointe | Established subdivision with consistent owner-occupancy; calmer than the city aggregate suggests | Families School |
| Woodburn Estates & Golf | Anchored by Senior Estates Golf & Country Club; quieter pace, lower foot traffic, stable community | Quiet Privacy |
| Settlemier/Hayes | Older residential core near downtown; walkable but more mixed safety picture than newer subdivisions; requires more neighborhood-specific research | Walkable First-Time |
The East Side Advantage
Tukwila is the clearest example of what planned development does for residential safety. Centered around the Oregon Golf Association course, the neighborhood's cul-de-sac layout, newer construction, and active HOA create an environment that is structurally different from older parts of the city. The northeast section of the city — where Tukwila sits — is one of the quieter geographic zones in Woodburn, seeing far fewer incidents than the retail corridor to the northwest.
Smith Creek and South Woodburn share this southeastern character: distance from the retail corridor, newer housing stock, and a community density that keeps eyes on the street. Residents on Nextdoor's South Woodburn page consistently list safety as one of their primary reasons for staying in the neighborhood.
Settlemier/Hayes: The Honest Assessment
The Settlemier/Hayes corridor is the neighborhood that requires the most careful research before committing. Its on-foot access to downtown and older housing stock attract buyers looking for character and convenience, and many blocks are genuinely fine. But long-time residents acknowledge that its proximity to older downtown blocks means it presents a more variable picture than the newer subdivisions on the south end. This is not a neighborhood to avoid — it is a neighborhood where block-level research matters more than the zip code average.
If Settlemier/Hayes interests you, the extra step is to check specific blocks rather than relying on neighborhood-level generalizations. For more on the character of each neighborhood, the neighborhoods guide goes deeper on what daily life looks and feels like street by street.

What the Woodburn Police Department Is Doing About It
The Woodburn Police Department is a professionally accredited agency running 24-hour coverage, and it has made transparency a visible commitment. The department publishes an annual Use of Force and Vehicle Pursuit Report — not every small-city department does this — and released a two-year Strategic Plan covering July 2025 through June 2027, which signals a department thinking ahead rather than simply reacting.
Community Programs Worth Knowing
The WPD's Neighborhood Watch Program is the most practical tool available to residents in any part of the city. The department actively supports new watch group formation and provides guidance for residents who want to start one in their neighborhood. If you are evaluating a block in Settlemier/Hayes or an older section of the city, asking whether an active watch group exists in that area is a worthwhile question before you settle on a street.
A less widely known initiative is the Surveillance Camera Registration Program. Residents and businesses can voluntarily register their exterior cameras with the WPD, allowing officers to quickly identify which homes or storefronts may have captured footage relevant to an incident nearby. It is a low-friction way for the community to extend the department's investigative reach without adding patrol resources.
What This Means in Practice
A professionally accredited department with active community programs and published strategic planning is meaningfully different from the baseline in many similarly sized Oregon cities. It does not make Woodburn immune to property crime, but it does suggest institutional investment in getting the trend line to continue its downward movement. The multi-year improvement in both categories is at least partly a product of that sustained effort.
One thing newcomers often mention after six months: the outlet mall draws weekend crowds that can make the northwest part of the city feel louder and busier than they expected. The retail activity that contributes to the property crime figure also just inflates the energy level of that corridor. Buyers who want a quieter weekend atmosphere consistently find it on the east and south sides of town, away from the commercial traffic.
Looking to buy in Woodburn? Estimate your payment.
Enter your numbers to see an estimated monthly mortgage payment.
Estimate only. Excludes HOA fees and mortgage insurance. The interest rate above is a starting point, not a quoted rate — replace it with your own to see real numbers. Insurance is a flat placeholder, not a Woodburn quote.
Practical Safety Research Before You Choose a Neighborhood
The city-wide crime rate is a starting point, not a destination. Woodburn is compact enough — 27,875 residents spread across a modest footprint — that two neighborhoods can have genuinely different incident profiles while sharing the same aggregate statistics. The research steps below are calibrated to this city's specific geography.
Start With the Geographic Divide
The single most useful thing to know before researching specific blocks is the northwest-versus-everywhere-else dynamic. The retail corridor concentrated in the northwest of the city generates a disproportionate share of property crime incidents. Residential neighborhoods that sit away from that commercial zone — and most of them do — see conditions that feel calmer than a property crime rate of 25.6 per 1,000 residents would suggest on its own.
Tukwila, Smith Creek, South Woodburn, Marion Pointe, Brighton Pointe, and Woodburn Estates sit in this quieter zone. Settlemier/Hayes sits closer to the older downtown core and warrants more specific block-level review. Boones Crossing's HOA structure provides a layer of community accountability that generally produces calmer conditions regardless of where it sits in the city's geography.
Use the WPD's Own Tools
Before settling on a specific area, it is worth contacting the Woodburn Police Department directly to ask about the Neighborhood Watch status of a particular block. The department actively supports these programs and can tell you whether an organized watch group is already active in the area you are considering. That answer tells you something about neighbor engagement that no crime map can.
The camera registration program is worth noting for what it signals about block culture: a street where multiple households have registered cameras tends to be a street where neighbors are paying attention. That social infrastructure is harder to quantify than a crime rate but often more predictive of your daily experience.
Read Nextdoor Before You Commit
Nextdoor's South Woodburn and Tukwila neighborhood feeds are among the more active in the city, and the texture of what residents are posting — and not posting — tells you more than any aggregate statistic. A neighborhood where the posts are mostly about community events, lost dogs, and recommendations is a different place than one where every other post is a ring-camera alert. Spend fifteen minutes there for any neighborhood you are seriously considering.
For context on how Woodburn neighborhoods compare in character beyond just safety, the full neighborhoods guide covers the lifestyle differences between each area in more depth.
The Honest Bottom Line on Woodburn Safety
Woodburn is not the safest city in Oregon, and it is not the most dangerous. It sits precisely at the state average on violent crime and modestly above it on property crime — and the property crime figure carries important structural context that the raw number obscures. A city with a regional outlet mall will always carry retail-driven property crime in its aggregate statistics that has little to do with residential neighborhood experience.
Who This City Works Well For, Safety-Wise
Families choosing one of the newer master-planned communities — Tukwila, Smith Creek, South Woodburn, Marion Pointe — are moving into environments that feel meaningfully calmer than the city-wide figures suggest. The HOA-governed neighborhoods in particular offer the kind of community accountability that keeps blocks quiet regardless of what is happening on the other side of town. For more on who Woodburn suits as a city overall, the living in Woodburn guide covers the lifestyle picture in full.
Where to Be More Careful
The northwest retail zone is where you feel the city's property crime most acutely — not because you are a resident there, but because you will park your car near the outlets and experience the same risk any retail visitor does. Vehicle break-ins in parking areas are the most common incident type in that corridor. Lock your car, do not leave visible valuables, and you are exercising the same caution that suffices in any Oregon city with a busy commercial district.
The Settlemier/Hayes corridor is the one residential area that warrants extra block-specific research. On-foot access to downtown is genuinely valuable, and many blocks are calm. But the older housing stock and proximity to downtown means variance is higher here than in the city's newer subdivisions. Going block by block matters more in this neighborhood than anywhere else in Woodburn.
The Trajectory Argument
The case for Woodburn on safety is partly a case about direction. Several years of improvement on both violent and property crime, a professionally accredited department with published strategic planning, and continued residential investment in HOA-governed communities on the east and south sides of town are all indicators of a city moving in the right direction. The numbers today are better than the numbers five years ago, and the institutional infrastructure is in place to sustain that progress.
For context on what the city costs and how it compares to nearby communities like Salem and Newberg on price, the cost of living guide has the full breakdown.

Local Expert Takeaway: The bulk of Woodburn's property crime traces to the outlet mall corridor in the northwest — a retail destination for the entire Willamette Valley — not to the residential neighborhoods where most families actually live. The city has a property crime rate of 25.6 per 1,000 residents, but that figure looks very different once you separate the commercial zone from the residential streets. Tukwila and Smith Creek are the quietest corners of the city by incident character, South Woodburn gets consistent high marks from residents on Nextdoor, and Settlemier/Hayes is the one area where a block-specific look matters before you commit. The multi-year crime trajectory is improving, the Woodburn Police Department publishes more transparency data than most agencies its size, and the Neighborhood Watch Program gives residents a concrete way to participate in the safety picture of their own street.
Quick Takeaways & FAQs
✅ Woodburn's violent crime rate of 3.3 per 1,000 residents matches Oregon's statewide average exactly and sits below the national rate of 3.7 per 1,000.
⚠️ The city has a property crime rate of 25.6 per 1,000 residents, but a disproportionate share of those incidents are concentrated in the northwest retail corridor around Woodburn Premium Outlets — not in residential neighborhoods.
📍 The Woodburn Police Department runs a Surveillance Camera Registration Program and active Neighborhood Watch support — asking whether your target block has an organized watch group is a practical pre-move research step.
Is Woodburn, Oregon a safe place to live?
Which Woodburn neighborhoods are the safest?
Is property crime a serious concern in Woodburn?
Is crime in Woodburn getting better or worse?
What crime prevention programs does the Woodburn Police Department offer?
Moving to Oregon?
Tell us what you need help with and we'll connect you with local resources.
