
If you've been researching Caldwell online, you've probably landed on at least one site that flashes a red crime map and moves on without context. That's not useful. Caldwell's violent crime rate sits at 4 per 1,000 residents and its property crime rate at 10 per 1,000 — figures drawn from federal uniform crime reporting data for 2024. Those numbers tell a more nuanced story than a color-coded map: Caldwell is not a crime-free small town, but it is also not the cautionary tale some aggregator sites imply. It's a rapidly growing Canyon County city of roughly 73,000 people, positioned along I-84 about 30 minutes west of Boise, and its crime picture reflects both the pressures of fast growth and genuine investment in public safety.
The economic backbone here runs through Canyon County government, the College of Idaho, and both the Caldwell and Vallivue school districts — institutions that collectively anchor a large share of stable employment in the area. That employment base matters for safety context: a city with rooted, employed households and active anchor institutions tends to have more community cohesion than population figures alone suggest. The mix of longtime residents and newer arrivals from the Boise metro has shaped neighborhoods with real variation in character and safety profile.
What surprises most people after six months here is how much the safety picture varies by pocket of the city. The southwest quadrant, neighborhoods around the College of Idaho, and the areas closest to Indian Creek feel markedly different from parts of Downtown and some older corridors on the east side. That geographic variation is the most important thing to understand before you choose a neighborhood — and it's something the raw citywide numbers don't capture on their own.
This guide breaks down Caldwell's crime data against Idaho and national benchmarks, explains how the numbers have shifted over recent years, maps the safest and most active-concern areas by neighborhood, and covers what the Caldwell Police Department is doing to drive those numbers further down. If you want the full neighborhood-by-neighborhood character breakdown, the best neighborhoods in Caldwell page goes deeper on that.

How Caldwell's Crime Numbers Stack Up Against Idaho and the Nation
Context is everything when reading crime statistics. Caldwell's violent crime rate of 4 per 1,000 residents and property crime rate of 10 per 1,000 look different once you place them against Idaho's statewide figures and the national baseline.
| Geography | Violent Crime (per 1,000) | Property Crime (per 1,000) | Source / Year |
|---|---|---|---|
| Caldwell, ID | 4.0 | 10.0 | Federal crime reporting data 2024 |
| Idaho statewide | 2.54 | 9.67 | SafeWise / federal crime data 2024 |
| United States | 3.59 | 17.60 | USAFacts / federal crime data 2024 |
Two things stand out immediately. First, Caldwell's property crime rate of 10 per 1,000 is nearly identical to Idaho's statewide figure — which, at 9.67, is the lowest property crime rate of any state in the nation. Second, Caldwell's violent crime rate runs noticeably above the Idaho average but sits slightly above the national rate — not dramatically so, but enough to be honest about.
CrimeGrade.org, which uses its own methodology and time windows, assigns Caldwell a B for property crime (65th percentile for safety nationally) and a B- for violent crime (57th percentile). That means Caldwell comes out safer than roughly 57% of U.S. cities on violent crime and safer than 65% on property crime — grades that are consistent with a mid-sized, fast-growing Idaho city rather than a high-crime outlier.
The honest read: Caldwell is not among Idaho's safest cities the way smaller communities like Rexburg or Driggs are, but it benchmarks well against comparable-sized cities nationally. For someone relocating from a major West Coast metro, the numbers will feel notably lower than what they're used to.
The Crime Trend: What's Actually Been Happening Year Over Year
Static snapshots hide the direction of travel. Caldwell's crime trajectory matters as much as the current rate — and that trajectory is clearly downward.
A Sustained Decline Since 2022
The Caldwell Police Department reported a 26% reduction in overall crime from 2022 to 2025, and 2025 alone saw an additional 12.12% drop. That's a meaningful, sustained decline — not a one-year blip — happening while the city's population has continued to grow. The department's 2024 Crime Report confirmed that Part 1 crimes (the most serious category in federal crime reporting, covering violent offenses and major property crimes) fell 0.32% year-over-year even as thousands of new residents moved in.
Fast-growing cities often see crime rates tick upward as infrastructure and policing capacity struggle to keep pace with population. Caldwell has bucked that pattern. The department attributes the improvement to data-driven policing strategies — using crime mapping and pattern analysis to deploy resources before problems concentrate rather than after they do.
What's Driving the Improvement
In early 2026, Caldwell launched Idaho's first Drone First Responder program, deploying three drones that can reach an incident scene in under 90 seconds to provide real-time aerial intelligence before officers arrive. The program is designed to compress response times and improve officer situational awareness — a practical upgrade in a city where geography and call volume have historically stretched patrol coverage.
Around the same time, the department rolled out a digital neighborhood watch program letting residents voluntarily register their home security cameras with the city. When a crime occurs nearby, officers can request footage without a warrant delay. That kind of resident-integrated policing tends to create a deterrent effect in addition to an investigative one — cameras that are known to be networked into the police system change behavior on the street.
The formal Neighborhood Watch program, coordinated through the police department's crime prevention unit, pairs resident block captains with assigned officers. It's been active in several of Caldwell's more established residential neighborhoods for years, and participation correlates with the pockets of the city that residents and local crime-mapping analysts most consistently describe as calm.
Neighborhood-Level Safety: Where the Differences Actually Are
Citywide numbers are a starting point. The real decision — which neighborhood to focus on — requires understanding how safety conditions vary across Caldwell's distinct areas.
The Southwest and West Side: The Strongest Safety Profile
CrimeGrade.org analysis and local crime-mapping data consistently point to the southwest portion of Caldwell as the safest part of the city. Neighborhoods like Brittany Heights and Mandalay Ranch sit in this quadrant — newer residential developments with well-maintained streets, active neighborhood watch participation, and lower incident density. Highlight Estates and Hartland, also in the western and northwestern corridors, share a similar profile: newer construction, family-oriented streets, and the kind of visible community presence that discourages opportunistic property crime.
College District and Indian Creek: Peaceful Pockets in the City's Core
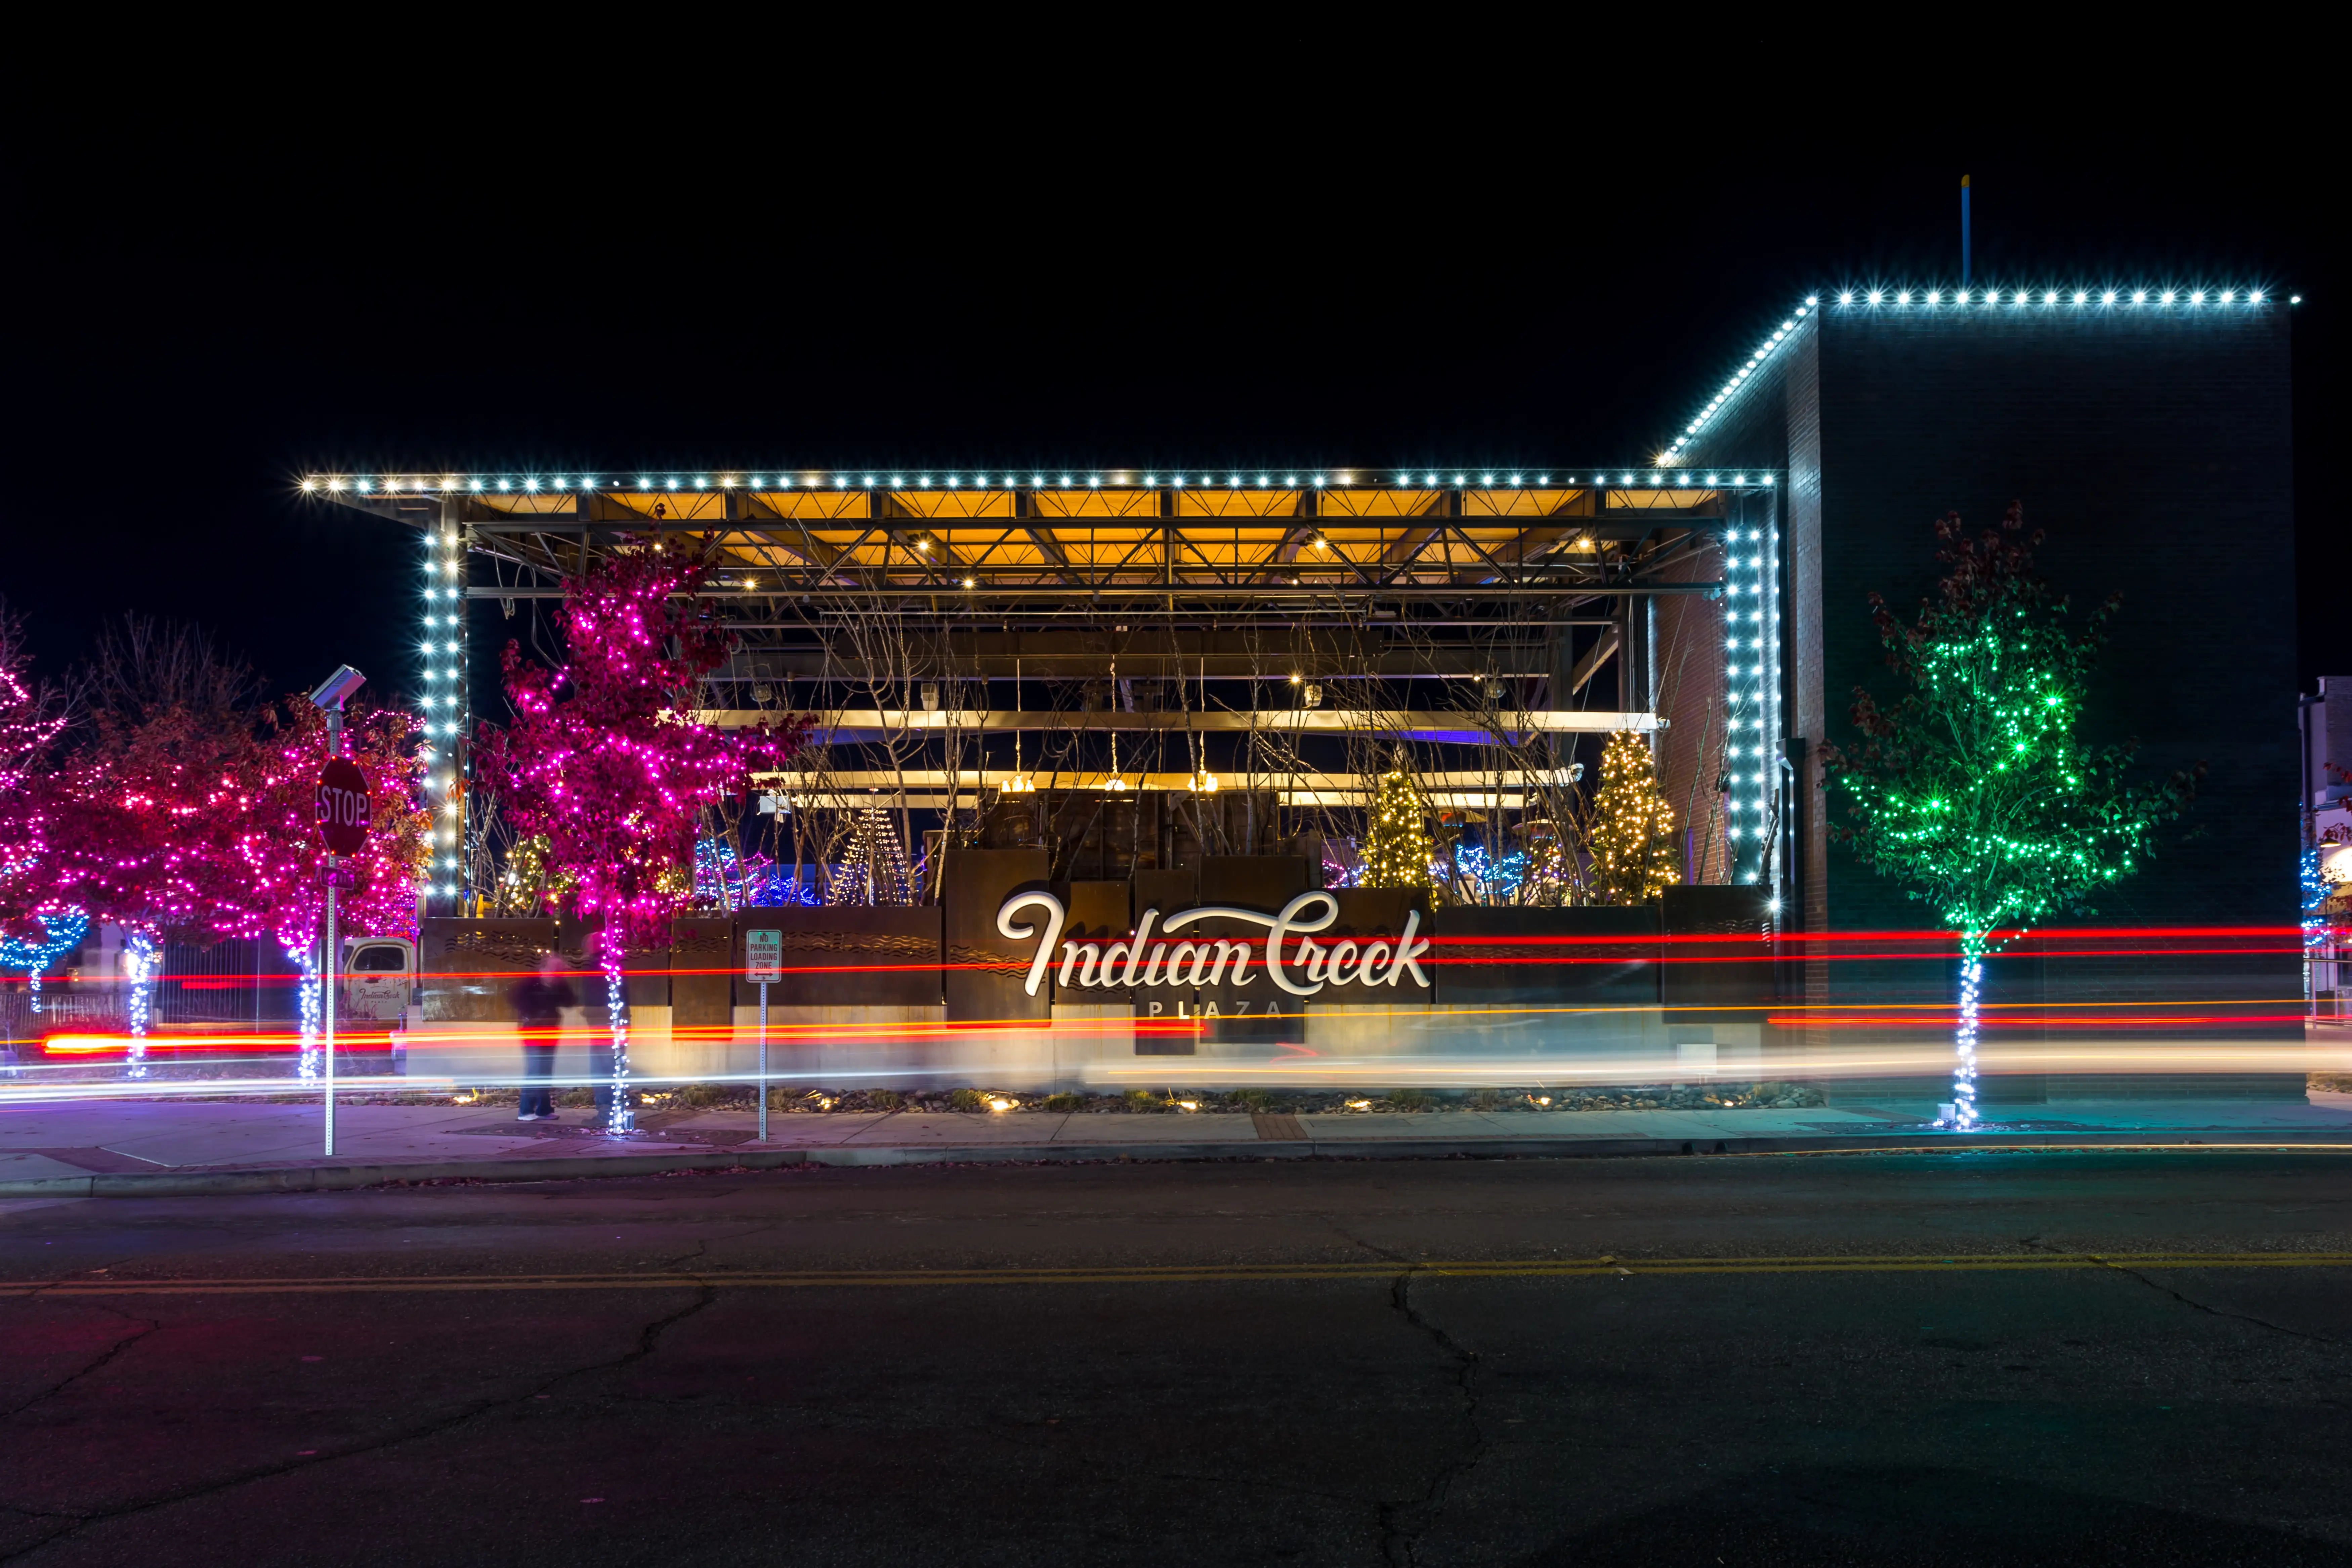
Areas near the College of Idaho and along Indian Creek are informally regarded as among Caldwell's most settled and peaceful, even though they sit closer to the city center. The College of Idaho's presence creates a stabilizing effect — foot traffic, institutional lighting, and a community of students and faculty who treat the area as a genuine neighborhood. Indian Creek Plaza anchors the adjacent blocks with evening activity and regular events, which tends to suppress the low-visibility conditions that property crime exploits.
Pennsylvania Park and the College District broadly fit this characterization: established, walkable in pockets, and with enough eyes on the street that residents generally describe them as comfortable day and night.
Downtown Caldwell: Improving but Uneven
Downtown is the most honest place to apply nuance. The investment in Indian Creek Plaza and the revival of the Arthur Street corridor signal genuine momentum. But Downtown also has older housing stock, higher foot traffic variability, and a history of property crime incidents that the recent policing improvements are actively working to reduce.
The Downtown blocks closest to the plaza and the Caldwell Train Depot feel noticeably different from the peripheral streets that haven't yet seen reinvestment. If Downtown is on your shortlist, the specific block matters more than the neighborhood label.
Northwest Caldwell: Growing but Watch the Details
Northwest Caldwell is actively expanding, with new subdivisions pushing into formerly agricultural land. Newer streets here tend to have lower incident histories simply because they're new — but infrastructure, lighting, and commercial services are still catching up. It's an area to evaluate with current data rather than assume.
| Neighborhood | General Safety Profile | Key Character | Best For |
|---|---|---|---|
| Brittany Heights | Among the strongest in city | Newer residential, SW quadrant | Families Quiet |
| Mandalay Ranch | Among the strongest in city | Newer development, active watch | Families Value |
| Highlight Estates | Strong | Western corridor, established | Families Quiet |
| Hartland | Strong | NW-adjacent, newer stock | First-Time Families |
| College District | Good, settled | Walkable, institutional anchor | Walkable School |
| Pennsylvania Park | Good | Established, mid-city | Families Commuter |
| Downtown Caldwell | Improving, uneven by block | Active reinvestment, variability | Walkable Renter |
| Northwest Caldwell | Newer, still developing | Expanding subdivision zone | First-Time Nature |
The southwest quadrant consistently earns the strongest marks; Downtown is the most active area of transition, with real improvement happening alongside real variability.
Looking to buy in Caldwell? Estimate your payment.
Enter your numbers to see an estimated monthly mortgage payment.
Estimate only. Excludes HOA fees and mortgage insurance. The interest rate above is a starting point, not a quoted rate — replace it with your own to see real numbers. Insurance is a flat placeholder, not a Caldwell quote.
Property Crime vs. Violent Crime: Which One Should You Worry About More?
Most people conflate overall safety with violent crime, but in Caldwell — as in most mid-sized Idaho cities — property crime is the more frequent daily reality.
Property Crime: The Practical Risk
At 10 per 1,000, property crime in Caldwell means incidents like vehicle break-ins, theft from unlocked cars, and occasional catalytic converter theft — the kind of opportunistic crimes that spike in areas with lower street visibility and lighter overnight foot traffic. The good news is that Caldwell's rate sits essentially at Idaho's statewide average, which is the lowest in the country. That's not a small thing: it means Caldwell's property crime baseline reflects Idaho norms, not a local failure.
The practical mitigation is straightforward: locked cars, home security cameras (especially given the city's new digital watch network), and attention to garage doors matter more here than elaborate alarm systems. Neighborhoods with active watch programs and newer streetlighting consistently show lower property incident rates in the local crime mapping data.
Violent Crime: Above the State Average, Below the National Rate
Caldwell's violent crime rate of 4 per 1,000 runs above Idaho's statewide figure of 2.54 — that's the honest part of this picture. It sits just above the national rate of 3.59. Idaho as a whole is an unusually low-crime state, so "above the state average" in Idaho still places a city in a favorable national position — Caldwell lands in the 57th percentile for violent crime safety nationally, safer than the majority of comparable U.S. cities.
Violent crime in Caldwell is not randomly distributed across the city. It concentrates in specific corridors and time windows, and it has been falling steadily. The 26% reduction from 2022 to 2025 applies to the overall crime picture, with the drone program and data-driven patrol deployment specifically targeting the incident clusters that drive the violent crime figures.
What This Means When You're Choosing a Neighborhood
If violent crime is your primary concern, focus your search on the southwest quadrant, the College District, and the newer western subdivisions. If property crime is the dominant worry — which it should be for most households, statistically — the answer is less about geography and more about specific street-level habits: camera registration with the department's new digital network, participation in the formal Neighborhood Watch, and awareness of which blocks have active lighting.
What New Residents Say — and What to Check Before You Decide
The Six-Month Surprise
Most people who move to Caldwell from larger metros say the same thing around month six: they expected it to feel rougher than it does in practice. The crime statistics, read without context, suggest a city with more visible disorder than daily life in Brittany Heights or along the Indian Creek corridor actually delivers. The disconnect between aggregator-site fear and street-level experience is real — and it's a function of how crime statistics get presented rather than how Caldwell actually operates day to day.
That said, there's a flip side to the surprise: a handful of newcomers who bought on the eastern side of the city, in older blocks near the commercial corridors, found the experience less settled than they anticipated. The lesson isn't that those areas are dangerous — it's that Caldwell's internal variation is significant enough that two families can have genuinely different experiences of the city depending entirely on which neighborhood they chose.
Why People Leave — The Honest Version
When Caldwell residents move out, safety is rarely the primary driver. More often it's the gap between the city's growth rate and its pace of retail and amenity development — the sense that Caldwell is still catching up to its own population. A smaller cohort cites the uneven feel of certain downtown-adjacent blocks at night as something that never quite settled for them. Neither of those is a safety crisis; they're livability calibrations that matter more for some households than others.
What to Actually Verify Before Choosing a Neighborhood
Before settling on a specific street, pull the Caldwell Police Department's online crime mapping tool and filter to the last 90 days within a half-mile radius of the address you're considering. Look for the type of incidents, not just the count — a cluster of vehicle break-ins in a parking lot reads very differently from assault reports on a residential block. Check whether the street is enrolled in the formal Neighborhood Watch program, and note whether the block has streetlighting adequate enough to qualify for the digital camera network.
Indian Creek Plaza and the College of Idaho campus are reliable anchors for street-level activity that discourages opportunistic crime. The closer a neighborhood is to either one — and the more connected it is to the department's community programs — the more the on-the-ground reality tends to track the better end of Caldwell's safety picture.
Caldwell isn't the easiest city to summarize with a single safety verdict. It rewards the research that aggregator sites skip.

Local Expert Takeaway: Caldwell's crime numbers look different once you sit with them. A violent crime rate of 4 per 1,000 and a property crime rate of 10 per 1,000 — with the property figure essentially matching Idaho's statewide average, the lowest in the nation — place this city in a better national position than most aggregator sites suggest. The southwest neighborhoods like Brittany Heights and Mandalay Ranch, and the areas closest to the College of Idaho and Indian Creek Plaza, consistently show the city's safest profile. The Caldwell Police Department's 26% crime reduction since 2022, combined with Idaho's first drone-response program and the new digital camera network, point to a department that's investing in the infrastructure to sustain that trend. The honest advice: check the department's crime map for your specific street, look into Neighborhood Watch enrollment for your block, and weight the trajectory as much as the snapshot.
Quick Takeaways & FAQs
✅ Caldwell's property crime rate matches Idaho's statewide figure — the lowest in the country — and the city's violent crime has dropped 26% since 2022, making it a materially safer place than it was three years ago.
⚠️ Caldwell's violent crime rate of 4 per 1,000 sits above Idaho's low statewide average and slightly above the national rate, so the city is not immune to crime — neighborhood choice within Caldwell matters significantly.
📍 The southwest quadrant — including Brittany Heights and Mandalay Ranch — consistently earns the strongest safety ratings in local crime-mapping analysis, while Downtown Caldwell is actively improving but remains uneven by block.
Is Caldwell, Idaho a safe place to live?
Which parts of Caldwell are the safest?
Is Caldwell's crime getting better or worse?
How does Caldwell's crime rate compare to Nampa and other nearby cities?
What should I look at when researching safety for a specific Caldwell address?
Moving to Idaho?
Tell us what you need help with and we'll connect you with local resources.
