
Most people researching Kelso, Washington start with one question before anything else: is it safe? The honest answer is more reassuring than the Pacific Northwest's reputation for crime might lead you to expect. Kelso's violent crime rate sits at 2 per 1,000 residents — roughly 36% below the national average and about 30% below Washington State's own rate — which places this 12,700-person city in notably better territory than most of its statewide neighbors. That distinction matters, because Washington consistently ranks among the highest-crime quartile of U.S. states, making Kelso's position below the state line a meaningful data point rather than a technicality.
Context is everything with crime statistics, and Kelso's context is a small, working-class river city where the major employers — the Kelso School District, Cowlitz County government, and the retail and manufacturing operations anchored near Three Rivers Mall — keep a large share of residents connected to stable institutional life. Property crime is the more realistic concern here: at 19 per 1,000, it runs modestly above the national average, though it lands well below Washington State's own property crime rate. The Kelso Police Department runs a community policing program that dates to 1995, and the Block Watch program gives neighborhoods an active deterrence tool against the vehicle break-ins and petty theft that make up the bulk of that property crime count.
For a quick cost-of-living anchor: the typical home price in Kelso sits at $391,124 (Zillow Home Value Index, May 2026) — well below Portland-area pricing — which means the cost of living here draws buyers who want Southwest Washington proximity without Seattle or Portland price tags. Safety is a major part of what they're evaluating when they arrive.
This guide breaks down what the FBI UCR 2024 data actually says about Kelso, how those numbers compare to the state and nation, what the neighborhood-level picture looks like across areas like Old West Side and Columbia Heights East, how the Kelso Police Department operates, and what practical steps you can take when researching a specific area before choosing where to live.
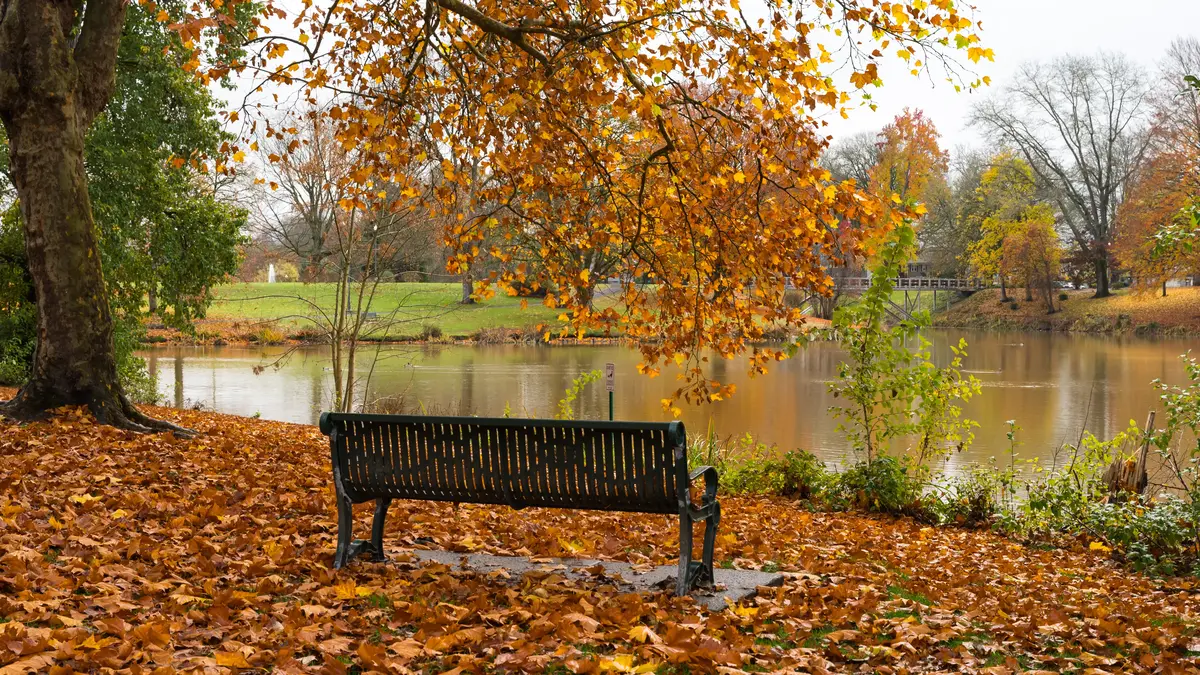
Kelso Crime Rates: What the FBI UCR 2024 Data Actually Says
Raw crime numbers without context can mislead more than they inform. Here is what the FBI Uniform Crime Report 2024 data — released September through October 2025 — shows for Kelso specifically.
| Crime Category | Kelso Rate (per 1,000) | National Average (per 1,000) | WA State Average (per 1,000) | Kelso vs. National | Kelso vs. WA State |
|---|---|---|---|---|---|
| Violent Crime | 2.0 | 3.59 | 3.26 | ~36% below | ~30% below |
| Property Crime | 19.0 | ~17.3 | ~24.7 | ~10% above | ~23% below |
| Combined (Violent + Property) | ~21.0 | ~20.9 | ~38.7 | Near national composite | ~46% below |
Source: FBI UCR 2024 calendar-year data via AreaVibes, NeighborhoodScout, and HomeSnacks (released September–October 2025).
The combined figure of approximately 21 per 1,000 puts Kelso right at the national composite — not dramatically below it, but not above it in any alarming way either. What separates Kelso from many comparable small cities is where that combined number breaks down: the violent crime figure is the genuinely low one, while property crime does the heavy lifting on the total.
In absolute terms, Kelso recorded 29 violent crimes and 244 property crimes in the most recent reporting year — 273 total offenses across the entire city. For a community of roughly 12,700 people, that is a small-city count. A resident's annual chance of becoming a violent crime victim is approximately 1 in 435, compared to 1 in 307 statewide.
The Washington State Factor
One number deserves emphasis: Washington State's overall crime rate is about 41% above the national average, placing it among the highest-crime states in the country. Kelso sitting below that statewide baseline — particularly on violent crime — is not a minor footnote. It is the central reason why the city's data reads as meaningfully better than many newcomers expect when they first look it up.
The statewide trend is also moving in a favorable direction. Washington's violent crime rate fell 9.2% year-over-year in 2024, a decline more than 60% steeper than the national average drop of 5.4%. Smaller cities like Kelso tend to benefit as those state-level improvements trickle down.
Property Crime: The Real Day-to-Day Concern in Kelso
If violent crime in Kelso is the relatively reassuring headline, property crime is the honest footnote. At 19 per 1,000 residents, it runs about 10% above the national average — and that gap is what drives most of the safety anxiety you'll find in local Facebook groups and neighborhood conversations.
What That Figure Actually Covers
Property crime is a broad category: vehicle break-ins, theft from unlocked cars, shoplifting, bicycle theft, and residential burglary all roll into that 19-per-1,000 figure. Kelso's commercial corridors along Industrial Way and the Three Rivers Mall area see most of the retail-adjacent property crime activity. Residential break-ins are a smaller slice of that 244-offense total, but they're not zero.
The practical consequence most residents mention is straightforward: don't leave valuables in your car, and don't leave your car unlocked overnight. That is not unique to Kelso — it is the standard West Coast advice — but in Kelso it is genuinely relevant rather than precautionary boilerplate.
Compared to the Rest of Washington
Here is the figure that puts Kelso's property crime in sharper relief: Washington State's own property crime rate runs approximately 24.7 per 1,000 — nearly 30% higher than Kelso's rate. Cities like Longview, which sits directly adjacent across the Cowlitz River, carry their own property crime dynamics. Kelso's number is above the national floor, but it is not anomalous for Southwest Washington.
The Block Watch program run by the Kelso Police Department is the most direct community response to this. Officers come to neighborhood meeting locations — not a city hall auditorium — to walk residents through crime-prevention techniques and help mark valuables for identification recovery. For areas like Broadway and Third Avenue, where higher foot traffic and older housing stock create more exposure, that kind of block-level engagement matters more than city-wide statistics alone.
A Human Friction Moment
Six months in, many newcomers from suburban Portland or smaller Oregon towns say the same thing: they expected Kelso to feel quieter on the property-crime front than their previous city, and it largely does — but the first time a neighbor mentions a car prowl on their street, it recalibrates expectations. It is not a crisis; it is a small-city reality. The gap between what the data predicts and what a single block-level incident feels like is real, and worth knowing about before you settle on a specific street.
Neighborhood Safety Snapshot: What Varies Across Kelso
City-wide averages smooth over the differences that actually matter when you're choosing between Old West Side and Columbia Heights East. Kelso doesn't publish granular neighborhood-level crime maps, but the geography and character of its eight canonical neighborhoods tells most of the story. For a full neighborhood profile, see the best neighborhoods guide.
| Neighborhood | General Safety Character | Primary Crime Concern | Best For |
|---|---|---|---|
| Columbia Heights East | Among the calmer residential areas; elevated terrain limits cut-through traffic | Low overall; occasional vehicle break-ins near park trailheads | Families Quiet |
| Old West Side | Established, walkable neighborhood; mix of housing ages means variable exposure | Property crime in older rental-stock blocks; lower near owner-occupied streets | First-Time Walkable |
| Cascade-City View | Quieter hillside character; low foot-traffic reduces opportunistic crime | Minimal; primarily vehicle break-ins if cars are left unlocked | Views Quiet |
| Northlake-Corman | Mixed residential-industrial edge; more variable than hillside areas | Property crime slightly elevated near industrial corridor boundaries | Value Commuter |
| Broadway | Higher foot traffic from commercial activity; more visible street activity | Petty theft and vehicle crime near commercial nodes | Walkable Renter |
| Third Avenue | Active corridor; proximity to services means more street exposure | Property crime most relevant; violent incidents rare but less rare than hillside areas | Transit Renter |
| The Trails | Newer development patterns; cleaner crime picture than older core | Low; trail access occasionally draws non-resident traffic | Families Nature |
| Industrial Way | Commercial and light-industrial; not primarily residential | Property crime concentrated in commercial zone; minimal residential impact | Commuter Value |
The Geographic Reality
Kelso's hillside neighborhoods — Cascade-City View, Columbia Heights East, and The Trails — tend to feel meaningfully calmer than the flat commercial and transit corridors along Broadway and Third Avenue. Elevation creates natural barriers to foot traffic, which correlates with lower opportunistic property crime. That is not a statistical guarantee, but it is a pattern consistent with how terrain shapes crime exposure in small Pacific Northwest cities.
The stretch near Tam O'Shanter Park is one of the more family-oriented gathering points in the city, and its surrounding blocks reflect that character. Buying within a few blocks of the park tends to feel safer day-to-day than the crime rate alone would predict — partly because of who lives there and who passes through.
What to Research Before Choosing an Area
Cowlitz County's online GIS portal and the Washington State Patrol's public crime records are the most reliable free tools for block-level research. Walking the neighborhood on a weekday evening and a Friday night will tell you things no database can — specifically, the foot traffic pattern and the state of adjacent commercial properties, which are the most reliable on-the-ground indicators of property crime exposure.
Looking to buy in Kelso? Estimate your payment.
Enter your numbers to see an estimated monthly mortgage payment.
Estimate only. Excludes HOA fees and mortgage insurance. The interest rate above is a starting point, not a quoted rate — replace it with your own to see real numbers. Insurance is a flat placeholder, not a Kelso quote.
Kelso Police Department: How the City Polices Itself
Understanding the department that serves a community is as important as reading the raw numbers. Kelso PD operates with a community policing philosophy that has been in continuous operation since 1995 — longer than most people living in the city have been residents.
Community Policing Since 1995
All Kelso patrol officers are trained in partnership-based, problem-solving policing aligned with federal community policing guidelines. That describes a specific operational philosophy where officers are expected to engage with residents as partners in crime reduction rather than solely as responders after the fact.
The department deploys a full-time School Resource Officer at Kelso High School, which serves both a security function and a relationship-building one. The annual participation in Cowlitz County-wide programs — National Night Out, Drive-Hammered/Get-Nailed, seatbelt and speed enforcement — keeps KPD visible in neighborhood life in ways that matter beyond incident response.
The Block Watch Program
The Block Watch program is the most practical community safety tool for prospective residents to know about. Officers travel directly to neighborhood meeting locations — your street, not city hall — to present crime-prevention techniques and help residents mark valuables for later identification if stolen. For neighborhoods like Old West Side and Broadway where property crime exposure is higher, an active Block Watch chapter is a measurable deterrent.
If you're settling on a block and want to know how organized the immediate neighborhood is about crime prevention, asking whether a Block Watch chapter is active there is one of the sharpest questions you can put to a future neighbor.
The Officer Ratio Context
Washington State has carried the lowest law enforcement officer-to-resident ratio in the nation for 13 consecutive years — approximately 1.35 to 1.4 commissioned officers per 1,000 residents, against a national average of about 2.3 per 1,000. That structural reality affects response times across the state, including in Kelso. It is not a reason to dismiss the city's safety picture, but it is a structural factor worth understanding. A community policing model that leans on neighborhood engagement and prevention programs partly compensates for a thinner patrol presence — which is exactly how KPD frames its own approach.
Kelso vs. Washington State and the National Picture
Ranking Kelso fairly requires knowing where it sits within a state that is itself a challenging benchmark. HomeSnacks placed Kelso at #95 out of 171 Washington cities in their FBI UCR 2024 safety ranking — squarely in the middle of the pack, not close to either extreme.
The Statewide Benchmark Problem
Washington's overall crime rate of approximately 38.7 per 1,000 is about 41% above the national average. When a city scores "near the national average" in Washington, it is frequently scoring well below the statewide norm. That is Kelso's position exactly: roughly 46% below the combined state rate, while sitting at approximately the national composite. For buyers coming from Oregon or California — states with their own crime challenges — Kelso's numbers often read as better than expected once that state-context correction is applied.
| Geography | Violent Crime (per 1,000) | Property Crime (per 1,000) | Combined (per 1,000) | Kelso Comparison |
|---|---|---|---|---|
| Kelso, WA | 2.0 | 19.0 | ~21.0 | — |
| National Average | 3.59 | ~17.3 | ~20.9 | Kelso violent: notably lower; property: modestly higher |
| Washington State | 3.26 | ~24.7 | ~38.7 | Kelso markedly better on both measures |
| WA State Rank (Kelso) | #95 of 171 cities (HomeSnacks, FBI UCR 2024) | Middle of state range | ||
| Resident violent crime odds | ~1 in 435 (Kelso) vs. ~1 in 307 (WA state) | Kelso meaningfully safer on violent odds | ||
| State violent crime trend | WA violent crime –9.2% year-over-year (2024) | Favorable statewide tailwind | ||
Source: FBI UCR 2024 data via AreaVibes, HomeSnacks, NeighborhoodScout, and USAFacts (released September–October 2025).
The Honest Middle Ground
Kelso is not the safest city in Washington. Castle Rock, a smaller community to the north in Cowlitz County, tends to post lower crime rates at its scale. Woodland and Kalama, both smaller, also carry lower absolute crime counts by virtue of their size. None of them offer Kelso's employment base, retail access, or proximity to Portland — the roughly 45-minute I-5 corridor run that many residents use for work.
The trade-off Kelso represents is real but not dramatic: slightly more urban property crime exposure than the smallest surrounding communities, in exchange for the services, employers, and infrastructure that only a city of Kelso's scale can support. For families evaluating the specific neighborhoods where they'd actually live, that city-wide figure compresses a range that runs from genuinely quiet hillside streets to more active commercial corridors — and knowing which end of that range you're landing on is the most practically useful safety research you can do.
A Seasonal Note Newcomers Miss
Property crime in Kelso, as in most Pacific Northwest cities, ticks upward in the summer months — not dramatically, but noticeably. The combination of longer days, more foot traffic, and more vehicles parked at trailheads and parks creates slightly more opportunity for the opportunistic theft that makes up most of the property crime total. If you're evaluating a neighborhood in January, walk it again in July before fully committing to your impression of it.

Local Expert Takeaway: Kelso's violent crime rate — 2 per 1,000 residents, about 36% below the national figure — is the city's most defensible safety strength, and it holds up under scrutiny because Washington State's own baseline is materially worse. Property crime at 19 per 1,000 is the honest counter-point: it's above the national average, it's concentrated in the Broadway and Third Avenue corridors and the Industrial Way commercial zone, and it mostly means car prowls and petty theft rather than residential break-ins. The hillside neighborhoods — Cascade-City View, Columbia Heights East, and The Trails — sit at the calmer end of the city's safety range; Old West Side and Broadway sit at the more active end. KPD's Block Watch program is the most practical tool for prospective residents: if a chapter is active on your target block, that is a real signal about neighborhood organization, not just a checkbox.
Quick Takeaways & FAQs
✅ Kelso's violent crime rate of 2 per 1,000 is roughly 36% below the national average and 30% below Washington State's own rate — a genuine data-backed strength in a high-crime state.
⚠️ Property crime at 19 per 1,000 runs modestly above the national average, concentrated in commercial corridors and older rental-stock blocks — car prowls are the most common concern, not violent incidents.
📍 The Kelso Police Department's Block Watch program sends officers directly to neighborhood meeting spots to help residents prevent property crime and mark valuables — worth asking about on any specific block you're considering.
Is Kelso, WA a safe place to live?
What is the crime rate in Kelso, Washington?
Which Kelso neighborhoods are the safest?
How does Kelso's crime rate compare to Longview's?
Does Kelso have an active neighborhood watch program?
Moving to Washington?
Tell us what you need help with and we'll connect you with local resources.
