
Most people researching a move to Sherman ask the safety question in the wrong order. They look up a single city-wide crime number, compare it to wherever they are now, and make a judgment. That approach misses the geographic reality of this city. Sherman's 52,417 residents are spread across a city where safety conditions vary meaningfully from one side of town to the other — and knowing which side you're looking in makes a bigger difference than the headline rate.
The headline rate itself is not alarming. Sherman registers a violent crime rate of 3 per 1,000 residents, which is below the Texas state average of 4 per 1,000 and below the national figure of 3.7 per 1,000. Sherman also registers a property crime rate of 19 per 1,000 residents, which sits beneath the Texas state rate of 20.7 per 1,000, though it runs modestly above the national property crime rate of 18.4 per 1,000. For a growing mid-size Texas city, those are numbers worth understanding rather than numbers worth fearing.
Context matters here too. Sherman is growing fast — a 15% population increase from the 2020 Census base, driven entirely by net in-migration according to a HUD housing market report. Texas Instruments began production at its newest Sherman facility in December 2025, anchoring a semiconductor employment base that is pulling in new residents from across North Texas and beyond. Growing cities with new job anchors attract a mix of demographics, and their crime statistics are a moving target in both directions. Sherman's five-year trend, per FBI data compiled through 2024, is directionally improving.
Whether you're deciding on a specific neighborhood or just trying to understand what daily life in Sherman actually feels like, the sections below break down the crime data, the geographic safety picture, what the police department looks like on paper, and what longtime residents actually say about living here.

Sherman's Crime Rates vs. State and National Averages
The comparison table below shows where Sherman lands against Texas and the nation. What numbers alone can't show is the direction of travel.
Sherman registers a violent crime rate of 3 per 1,000 residents — the figure that surprises most people researching from outside North Texas. For a city that has absorbed significant industrial investment and population growth simultaneously, holding below the state average is not automatic. It reflects both the demographics of who is moving in and an active law-enforcement posture that has been independently assessed.
Sherman also registers a property crime rate of 19 per 1,000 residents. That clears the state bar but runs slightly above the national property crime rate of 18.4 per 1,000. The gap is not dramatic, but it means auto break-ins and opportunistic theft are real considerations here — as they are in virtually every Texas city of comparable size. Leaving valuables visible in a parked car is the kind of thing residents learn not to do.
The five-year trajectory from 2020 through 2024 is characterized as improving, with 2024 FBI data showing a notable single-year drop in violent incidents. No single-year drop should be read as a permanent shift, but the direction is meaningful context when you are trying to decide whether a city is moving toward or away from a safer baseline.
What the Numbers Don't Capture
Aggregate city-wide rates mask the internal geography. A neighborhood on the quieter northwest side of Sherman and one near a high-traffic commercial corridor will both count toward the same city-wide figure, even though the daily experience of living there is quite different. The sections below break that down.
The Geographic Safety Picture: Northwest vs. Southeast
The Divide That Residents Know
Ask a longtime Sherman resident where the safest parts of town are, and you will almost always hear the same answer: the northwest. Crime mapping data bears this out. The northwest part of the city is consistently the lower-incident area, while the southeast records significantly more activity — roughly double the incident density of the northwest side. Those are directional signals confirmed by what residents observe on the ground.
Newer, more planned residential development tends to cluster toward the western and northwestern parts of Sherman, while older commercial corridors and higher-density areas are more concentrated toward the east and southeast. The divide is not subtle once you know to look for it.
Why Commercial Corridors Skew the Data
One important calibration: crime statistics for any area are inflated by foot traffic, not just residential density. Areas near busy retail strips, large parks, and major highway interchanges generate more reported incidents simply because more interactions happen there. That activity doesn't necessarily mean the people who live nearby face elevated personal risk — it means the geography draws people, and some of those interactions get reported. Mapping crime data without accounting for this produces a distorted picture of residential safety.
Neighborhood-Level Observations
Heritage Ranch, a 440-acre master-planned community, is among the newer and more deliberately designed residential areas in Sherman. It features internal parks, trails, and ponds, and a Sherman ISD elementary school that opened for the 2025–26 school year. Planned communities of this type tend to benefit from newer infrastructure, active homeowner involvement, and the self-selection of buyers who are specifically choosing a family-oriented environment.
Canyon Creek Estates, on the western side of the city, is known for large homesites, a quieter feel, and proximity to a park with a fishing lake. It is the kind of neighborhood where you are far more likely to encounter a neighbor walking a dog than anything worth worrying about. Bel Air Village also sits in the city's capital improvement program for the current budget cycle, reflecting active city investment in that area's infrastructure.
The neighborhoods closer to the city's older commercial core — and particularly those near high-traffic intersections — reflect the elevated property crime figures more directly. If your priority is minimizing property crime exposure, researching the specific block rather than the neighborhood name is worth the time. The neighborhoods guide breaks down the character of each area in more depth.
Sherman Police Department: Accreditation and Campus Safety
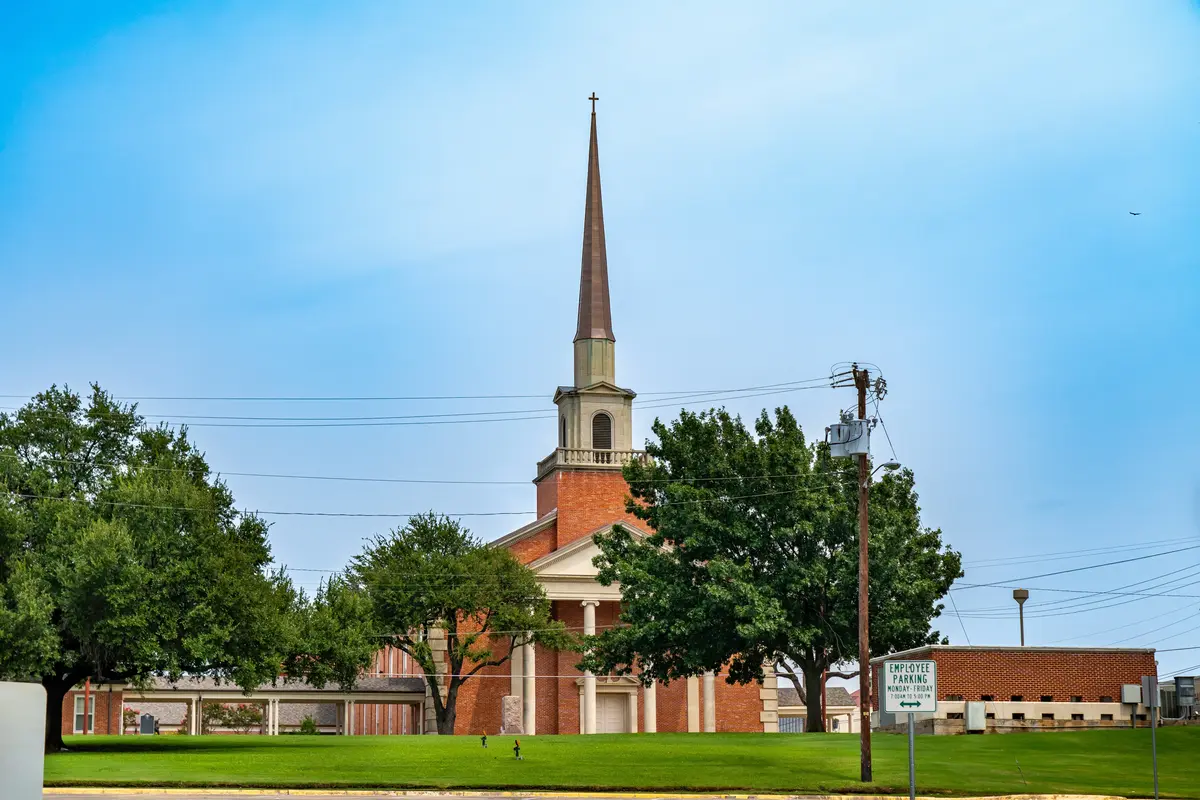
The most concrete credibility signal the Sherman Police Department carries is its September 2024 re-accreditation through the Texas Police Chiefs Association Best Practices Recognition Program. That program requires agencies to demonstrate compliance with 168 specific Texas law enforcement best practices, covering everything from use-of-force policies and equipment standards to facility operations. Re-accreditation — rather than a one-time certification — means the department submitted to ongoing review, not just an initial check.
That distinction matters to buyers weighing a move. A department that passes a compliance audit once could be coasting. One that pursues re-accreditation is institutionally committed to maintaining the standard. For a city of 52,417 that is growing faster than almost any comparable city in Grayson County, that institutional posture is worth noting.
School Safety Infrastructure
Sherman ISD operates its own certified police department, with officers credentialed through the Texas Commission on Law Enforcement. The district also participates in iWatchTexas, the Texas Department of Public Safety's anonymous community reporting system, which gives students, parents, and staff a confidential channel to flag concerns before they escalate. For families with school-age children, this is a more substantive safety infrastructure than many districts of comparable enrollment provide. You can find more on the district's overall picture — including its TEA rating and academic profile — on the schools page.
Infrastructure Investment as a Safety Signal
The city's adopted capital program includes improvements specifically tied to Bel Air Village and Heritage Ranch, along with a remodel of Fire Station #3. Public safety infrastructure investment at this level — funded through the city's own budget rather than deferred — is a meaningful indicator of how the city government prioritizes the conditions that support neighborhood stability. Sherman's mayor has also publicly framed street resurfacing and reconstruction as a top-tier priority alongside the city's growth. Maintained infrastructure and responsive city services are consistent predictors of stable, lower-crime residential environments.
Looking to buy in Sherman? Estimate your payment.
Enter your numbers to see an estimated monthly mortgage payment.
Estimate only. Excludes HOA fees and mortgage insurance. The interest rate above is a starting point, not a quoted rate — replace it with your own to see real numbers. Insurance is a flat placeholder, not a Sherman quote.
What Residents Actually Experience: Practical Safety Notes
The Six-Month Surprise
People who move to Sherman from larger metro areas often arrive expecting a small-town crime picture and are briefly startled by what they find in the property crime data. Auto theft and vehicle break-ins are the most common complaint among newer residents, particularly near parking areas adjacent to commercial activity. This is not unique to Sherman — it is a feature of virtually every growing Texas city — but it catches transplants off guard when they were expecting something closer to a rural zero-incident baseline.
The practical adjustment is simple: treat your vehicle the way you would in any mid-size city. Don't leave bags, electronics, or anything visible on the seat. Residents in Heritage Ranch, Canyon Creek Estates, and Westwood Village report far fewer of these incidents than those in areas closer to busier corridors — which tracks with the geographic data above.
The Growth Factor
Sherman is not a static community. The population has grown sharply, driven entirely by net in-migration. New residents arrive from DFW, from out of state, and from smaller towns that couldn't absorb the semiconductor-adjacent job growth that Texas Instruments and GlobiTech have brought to the area. Rapidly growing cities often see a temporary uptick in property crime as retail and commercial infrastructure catches up with population — more people, more cars, more opportunity for opportunistic theft before the community's social fabric fully knits together.
That growth also means that the safety picture in Sherman today is not exactly what it was three years ago, and it may not be exactly what it is today in another three. The improving five-year trend is genuine context, but a city in this kind of expansion deserves ongoing attention rather than a one-time verdict.
Where Families Gather and What That Looks Like
Herman Baker Park and Fairview Park are the main outdoor gathering spots where you will find parents with kids on a weekend afternoon. These are well-used, well-maintained spaces with a consistent community presence. The Sherman Farmer's Market draws a regular crowd of local residents. None of these feel like spaces you would avoid — and community spaces that people actively use are their own form of neighborhood safety, because eyes on a space deter the opportunistic incidents that empty lots invite.
How to Research Safety Before Choosing a Neighborhood
City-wide crime rates give you a frame. They do not tell you whether the specific block you are considering sits in the quieter northwest or near a commercial strip that inflates the southeast figures. Here is how to go deeper before you decide on a neighborhood.
Use Crime Mapping Tools Critically
CrimeGrade.org and AreaVibes both publish Sherman-specific crime maps that let you look at incident density by area. Use them as directional tools, not as precise measurements. What they are useful for is identifying whether a specific address sits in the lower-incident northwest or the higher-incident southeast — a directional read that is genuinely helpful when you are narrowing down which part of the city to focus on. Do not try to compare their per-area figures directly to the Bureau of Justice Statistics rates in this guide; the methodologies differ.
Drive the Neighborhood at Different Times
No dataset replaces a personal site visit. Drive the street you are considering on a weekday morning and again on a weekend evening. Look at the state of the neighboring properties, whether commercial uses abut the residential street, and how much foot traffic the area sees after dark. In Sherman, the difference between a quiet established street in Preston Club or Turtle Creek and a block closer to a high-traffic arterial is visible on the ground in a way that heat maps only approximate.
Talk to Neighbors
Sherman is small enough that the people who live in a given neighborhood will tell you exactly what they think about it. The Heritage Ranch community in particular has an active resident base that is vocal about neighborhood conditions — which is itself a sign of an engaged community that monitors its environment. For older, more established neighborhoods, a conversation at Herman Baker Park on a Saturday morning is often more informative than an hour of online research.
Check School Safety Alongside Neighborhood Safety
If you are moving with kids, the Sherman ISD police department and iWatchTexas participation are worth understanding alongside the neighborhood picture. The district's credentialed campus officers and anonymous reporting system are a meaningful layer of safety infrastructure. More detail on the district overall is on the schools page.
For the broader neighborhood character — who each area suits, what the housing stock looks like, and how the different parts of the city compare — the neighborhoods guide is the place to start.
Local Expert Takeaway: Sherman's crime rates sit in a reasonable place for a city growing this fast — a violent crime rate of 3 per 1,000 residents below the Texas state average, and a property crime rate of 19 per 1,000 residents near the state figure. The geographic divide is real: the northwest side of the city, including areas like Heritage Ranch and Canyon Creek Estates, records significantly fewer incidents than the southeast. The Sherman Police Department's 2024 re-accreditation through the Texas Police Chiefs Association Best Practices program is a meaningful institutional signal. The one adjustment most transplants make within their first few months is treating vehicle security the way they would in any active mid-size city — because opportunistic property crime near commercial corridors is where the data points. Drive the specific street, check the crime maps directionally, and talk to people already living there.
Quick Takeaways & FAQs
✅ Sherman registers a violent crime rate of 3 per 1,000 residents — below both the Texas state average and the national average, a genuinely competitive figure for a growing North Texas city.
⚠️ Sherman also registers a property crime rate of 19 per 1,000 residents, and vehicle break-ins near commercial corridors are the most common complaint from newer residents — especially those arriving from smaller towns.
📍 The northwest part of Sherman — including Heritage Ranch and Canyon Creek Estates — records roughly half the total crime activity of the southeast, a divide that matters more than the city-wide average when choosing a specific street.
Is Sherman, TX a safe place to live?
Which parts of Sherman are the safest?
How does Sherman's crime rate compare to other Texas cities?
Is the Sherman Police Department well-run?
What type of crime is most common in Sherman?
Moving to Texas?
Tell us what you need help with and we'll connect you with local resources.
