
You've heard Kuna described as the quiet side of the Treasure Valley — a bedroom community southwest of Boise where the subdivisions are newer and the pace is slower. But quiet and safe are not the same thing, and if you're weighing a move here, you want actual numbers, not a vibe. The short answer: Kuna is genuinely, measurably safer than most American cities its size, and it sits inside one of the safest states in the country. That context matters before you dig into the specifics.
Kuna's violent crime rate is 1.8 per 1,000 residents, and its property crime rate is 5.2 per 1,000 residents — both figures drawn from the city fact sheet and corroborated by CrimeGrade.org's own modeled analysis. To put those numbers in perspective: the national violent crime rate sits at 3.71 per 1,000 (FBI, 2024), and Idaho's own statewide rate is 2.54 per 1,000. Kuna runs below both. On property crime, the gap is even wider — the national average is 18.35 per 1,000, making Kuna's 5.2 look exceptional by comparison.
None of that means every block is equal. Crime in Kuna follows the same geographic logic it follows in most fast-growing suburbs: the newer residential subdivisions on the city's edges see the least activity, while older commercial corridors carry more of the reported incidents. Knowing which part of Kuna you're considering changes the picture meaningfully. The sections below break down Kuna's crime statistics versus state and national benchmarks, where the geographic variations fall, what residents actually experience day to day, and how to read the data before deciding on a neighborhood.
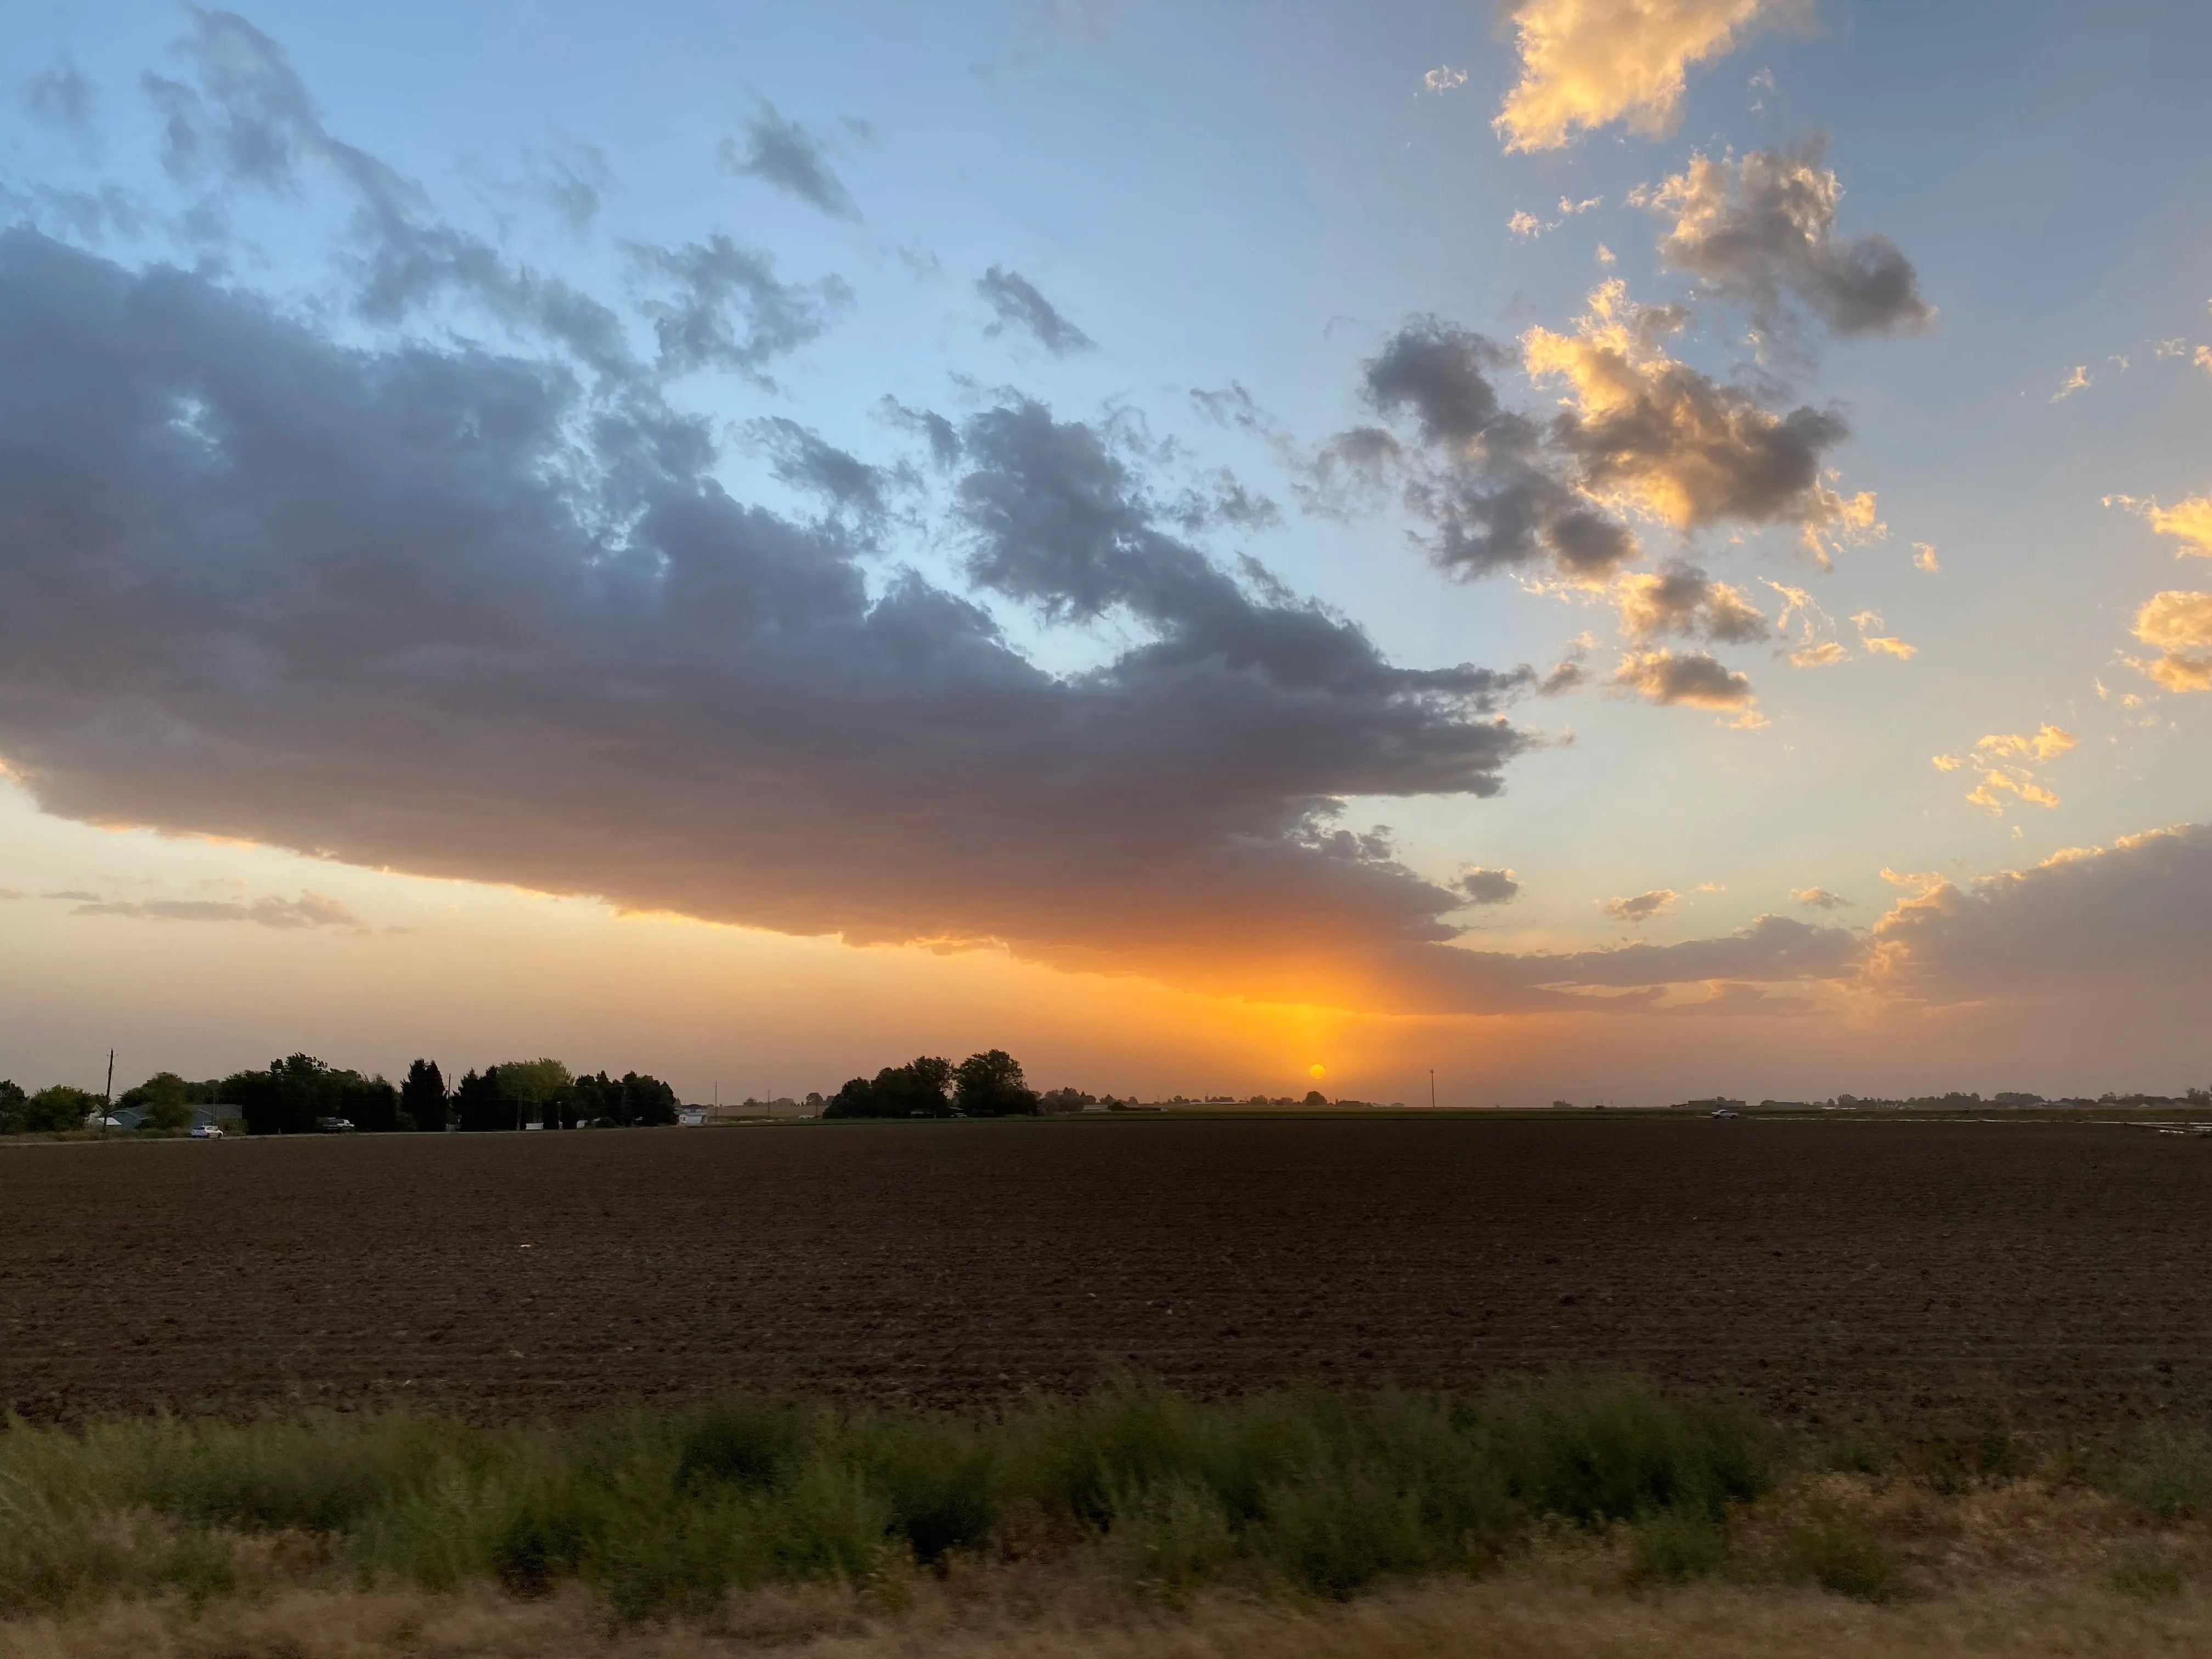
Kuna's Crime Numbers vs. State and National Benchmarks
The headline figures — 1.8 violent crimes and 5.2 property crimes per 1,000 residents — deserve real context, not just a reassuring shrug. Here's how Kuna stacks up against the benchmarks most people care about.
| Geography | Violent Crime (per 1,000) | Property Crime (per 1,000) |
|---|---|---|
| Kuna, Idaho | 1.8 | 5.2 |
| Idaho Statewide | 2.54 | 9.67 |
| National Average (FBI, 2024) | 3.71 | 18.35 |
Sources: City Fact Sheet / CrimeGrade.org (Kuna); SafeWise 2026 (Idaho); FBI / Bureau of Justice Statistics, March 2026 (national).
On violent crime, Kuna is noticeably below Idaho's own statewide rate — and Idaho already runs well under the national figure. That double cushion matters: you're not just buying into a safe city, you're buying into a safe state where the baseline is already low.
Property crime tells the more striking story. Idaho's statewide property crime rate of 9.67 per 1,000 is the lowest in the nation. Kuna's 5.2 is roughly half even that figure. CrimeGrade.org ranks Kuna in the 94th percentile for property crime safety nationally — meaning it outperforms 94% of U.S. cities on that metric alone, earning an A+ grade.
One figure that doesn't usually appear in these comparisons: the estimated cost of crime per resident. In Kuna, that figure runs approximately $241 per year — noticeably lower than both the national average and Idaho's own state average. It's a useful gut-check that confirms the raw rates aren't a statistical artifact.
Idaho's Broader Safety Advantage
Idaho ranked #2 among all 50 states for overall safety in 2024, with a total crime rate roughly 55% below the national average. That's the starting line Kuna operates from. Since 2005, property crimes statewide have fallen 66% and crimes against persons have dropped 35% — a generational shift, not a one-year blip. And 69% of Idaho residents report feeling safe in the state, the third-highest confidence level nationwide, with only 37% worrying about crime daily versus 46% nationally. Kuna benefits from all of that momentum.
Where Crime Concentrates Inside Kuna
City-wide averages are a starting point, not the whole story. Within Kuna, crime risk varies considerably depending on where specifically you're looking — and the gradient follows a pattern that most newcomers don't expect.
The Geographic Reality
North Kuna carries the lowest overall crime exposure in the city. CrimeGrade.org's neighborhood-level modeling puts property crime victimization odds in the northern areas at approximately 1-in-427 — among the best in the city. If you're looking at subdivisions like Pinnacle or Silver Trail, you're operating in that lower-risk northern tier.
Southeast Kuna shows a different pattern worth understanding. Overall victimization odds there run closer to 1-in-52, which is meaningfully higher than the northern figure. The counterintuitive part: violent crime odds in those same southeastern neighborhoods are actually among the city's best, sitting at roughly 1-in-742. The elevated overall risk in the southeast is driven almost entirely by property crime, not violent incidents.
West-side corridors carry the city's highest property crime exposure, at approximately 1-in-109 victimization odds. This aligns with the older commercial strips and higher-traffic areas closer to the city's established core rather than its newer residential edges.
What the Neighborhood Pattern Means in Practice
Kuna's canonical residential subdivisions — Valor, Indian Creek Ranch, Lugarno Terra, Patagonia, Paloma Ridge, Silver Trail, Pinnacle, and Crimson Point — are predominantly newer-build communities on the city's outskirts. That matters for safety research: newer suburban developments with limited through-traffic consistently show up in the lower-risk zones on CrimeGrade's maps.
The practical implication is simple. If you're choosing between an established older street closer to downtown Kuna and a newer subdivision on the northern or eastern edge, the data supports the suburban choice from a property crime standpoint. That's not a surprise to anyone who has researched fast-growing Treasure Valley cities — the pattern holds in Meridian and Star as well.
| Kuna Zone | Overall Victimization Odds | Violent Crime Odds | Property Crime Odds |
|---|---|---|---|
| North Kuna | ~1-in-115 | Lower exposure | ~1-in-427 |
| Southeast Kuna | ~1-in-52 | ~1-in-742 (city's best) | Higher relative exposure |
| West-side corridors | Higher overall | Not elevated | ~1-in-109 |
| Central neighborhoods | Mid-range | ~1-in-336 | Mid-range |
Source: CrimeGrade.org, Kuna neighborhood-level modeling, March 2025.
One honest note on these figures: neighborhood-level crime modeling relies on modeled estimates, not always direct reported-crime counts, because Kuna's individual neighborhood populations are small enough that raw incident counts fluctuate year to year. Use them as directional guidance, not precision statistics.

What Residents Actually Experience Day to Day
Statistics describe risk. They don't describe the feeling of walking to Bernie Fisher Park on a Tuesday evening, or leaving your car in a subdivision cul-de-sac overnight. Both matter when you're deciding where to live.
The Six-Month Surprise
Most people who move to Kuna from larger metros — or even from Boise — say the same thing around month six: they stop locking their car in their own driveway. Not because crime doesn't exist, but because the baseline sense of vigilance that becomes muscle memory in denser cities simply doesn't maintain itself here. That's a real quality-of-life shift that raw rates don't fully capture.
The flip side is that Kuna is growing fast. A city that was under 20,000 residents not long ago is now over 32,000 and adding subdivisions along Hubbard Road and Linder Road every year. Growth brings more traffic, more transient activity near retail corridors, and more pressure on a police department that was built for a much smaller city. Residents in subdivisions closer to the Kuna Road and Can-Ada Road commercial areas notice a difference compared to those tucked deeper into the northern developments.
Where Families Actually Gather
The Indian Creek Greenbelt functions as Kuna's informal community living room — parents walk it in the evenings, kids ride bikes along it on weekends, and it remains one of the safest-feeling public spaces in the city. Bernie Fisher Park draws weekend crowds and family gatherings. The Falcon Crest Golf Course area on the south side has its own neighborhood feel, quieter and less trafficked than the city's commercial spine on Avalon Street.
For a weeknight dinner out, a handful of local options have settled in along the Main Street corridor — Riceworks Sushi & Asian Fusion Steakhouse on W Main St is one of the more established spots, and Enrique's Mexican Restaurant has a loyal local following. Neither is in a part of town that would give a first-time visitor pause.
Why Some People Move Out
The honest answer on departures isn't crime — it's growth anxiety. Some long-term residents leave because Kuna no longer feels like the small town they chose a decade ago. Others leave because the city's infrastructure — roads, services, police staffing — hasn't fully caught up to the population. A few leave after incidents that, while statistically rare, feel more jarring precisely because Kuna's baseline is so calm. None of those are crime-driven patterns in the traditional sense.
Looking to buy in Kuna? Estimate your payment.
Enter your numbers to see an estimated monthly mortgage payment.
Estimate only. Excludes HOA fees and mortgage insurance. The interest rate above is a starting point, not a quoted rate — replace it with your own to see real numbers. Insurance is a flat placeholder, not a Kuna quote.
How to Research Safety Before Choosing a Neighborhood
The city-wide numbers give you the context. What you actually need before settling on a specific street is neighborhood-level research — and Kuna's data sources are better than most people realize.
Tools Worth Using
CrimeGrade.org publishes Kuna-specific neighborhood maps that break down both violent and property crime by zone. The methodology uses modeled estimates based on reported incidents and demographic data, so treat the specific odds as directional rather than precise — but the geographic pattern (north and southeast safer; west-side corridors more active) is consistent across multiple data pulls.
NeighborhoodScout's FBI-data analysis confirms that Kuna's combined crime rate is noticeably lower than average compared to similarly-sized U.S. cities. Their interface lets you drill to the census-tract level, which is useful for comparing a subdivision like Patagonia against something closer to the older downtown grid.
The Ada County Sheriff's Office and Kuna Police Department both publish annual reports and respond to public records requests. If you're deciding between two subdivisions and want actual incident data for a specific area, a records request is more reliable than any third-party aggregator.
What to Actually Look At
When you're researching a specific neighborhood in Kuna, three questions matter more than the city-wide rate:
- How old is the development? Newer subdivisions — Valor, Paloma Ridge, Lugarno Terra, Crimson Point — tend to have less through-traffic and fewer reported incidents than older sections of town near the commercial core.
- What's the proximity to arterial retail? Property crime correlates with retail corridor proximity in Kuna just as it does in Meridian and Nampa. A subdivision one block off Avalon Street is a different risk profile than one a mile north on a quiet residential loop.
- Is there an organized neighborhood watch? Well-organized residential communities in Kuna tend to have faster reporting of suspicious behavior — a practical safety layer beyond the raw statistics.
One thing worth doing before you decide on a neighborhood: check the Ada County parcel viewer and cross-reference the subdivision's recorded plat date. It's a quick proxy for how established — and how trafficked — the area is. Subdivisions platted in the last five years are almost universally in the lower-activity zones on the crime maps.
The Bottom Line on Kuna Safety
Kuna is, by the numbers, a genuinely low-crime city. A violent crime rate of 1.8 per 1,000 sits well below both Idaho's statewide average and the national figure. A property crime rate of 5.2 per 1,000 places it in the top 6% of U.S. cities for property crime safety. Those aren't marketing figures — they're cross-verified across multiple data sources, and they hold up under scrutiny.
The caveats are real but manageable. Crime isn't distributed evenly, and the west-side commercial corridors carry more exposure than the newer residential subdivisions. The city is growing fast enough that the 2025 figures may look different in three years as development pushes further toward the Kuna-Mora Road corridor and new commercial density follows. Staying current on local incident data — not just trusting the citywide average — is the right approach for anyone settling in long-term.
Kuna vs. Its Neighbors
| City | Violent Crime (per 1,000) | Property Crime (per 1,000) | Safety Context |
|---|---|---|---|
| Kuna | 1.8 | 5.2 | Below state and national average on both metrics |
| Idaho Statewide | 2.54 | 9.67 | State rate; lowest property crime in U.S. |
| National Average | 3.71 | 18.35 | FBI / BJS, 2024 full-year data |
| Meridian | Not quoted here | Not quoted here | Similar Treasure Valley suburb profile |
| Nampa | Not quoted here | Not quoted here | Larger city; historically higher rates than Kuna |
| Boise | Not quoted here | Not quoted here | Urban core; higher activity than Kuna suburbs |
Meridian, Nampa, and Boise figures are not quoted here to avoid a stale comparison table; the directional ranking — Kuna among the safer options in the Treasure Valley — is consistent across available data sources.
For most families moving from a higher-crime metro, Kuna will feel like a step down in vigilance within a few months. That's not naivety — it's what the data predicts. The city earns its reputation as one of the quieter corners of a genuinely safe state, and the numbers back that up.

Local Expert Takeaway: Kuna's 1.8 violent crimes per 1,000 residents is the number that matters most for families relocating here — it sits well below Idaho's own statewide rate, which is already among the lowest in the country. The practical reality on the ground matches the statistics: residents in newer subdivisions like Pinnacle, Paloma Ridge, and Indian Creek Ranch report almost no day-to-day safety concerns, and the Indian Creek Greenbelt genuinely feels like a neighborhood living room after dark. The one honest caveat is growth: Kuna added thousands of residents in a short window, and the commercial corridors on the west side see more property crime activity than the suburban edges. Research at the subdivision level — not just the city level — before you settle on a specific address.
Quick Takeaways & FAQs
✅ Kuna's property crime rate of 5.2 per 1,000 places it in the 94th percentile for safety nationally — outperforming 94% of U.S. cities on that metric alone.
⚠️ Crime is not evenly distributed: west-side commercial corridors carry notably higher property crime exposure than the newer subdivisions on the city's northern and eastern edges.
📍 The Indian Creek Greenbelt and newer developments like Paloma Ridge and Crimson Point sit in Kuna's lowest-risk zones — north Kuna property crime odds run approximately 1-in-427.
What is Kuna, Idaho's crime rate?
Is Kuna safer than Boise or Meridian?
Which parts of Kuna have the lowest crime?
Has crime in Kuna been increasing as the city grows?
How does Kuna rank for safety compared to other U.S. cities?
Moving to Idaho?
Tell us what you need help with and we'll connect you with local resources.
